Evidence for a subsurface ocean on Europa - Sigríður Kristjánsdóttir
←
→
Page content transcription
If your browser does not render page correctly, please read the page content below
Evidence for a subsurface ocean on Europa

              Sigríður Kristjánsdóttir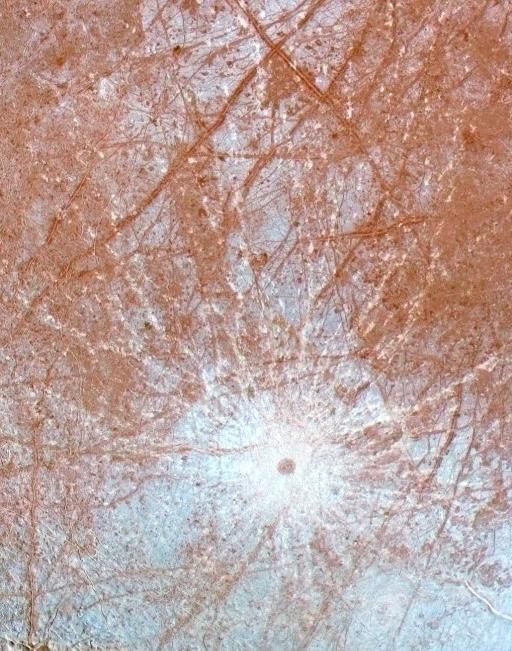
Evidence for a subsurface ocean on Europa

               Sigríður Kristjánsdóttir

           10 eininga ritgerð sem er hluti af
    Baccalaureus Scientiarum gráðu í jarðeðlisfræði

                     Leiðbeinandi
                Þorsteinn Þorsteinsson

                  Jarðvísindadeild
           Verkfræði- og náttúruvísindasvið
                   Háskóli Íslands
            Reykjavík, maímánuður 2010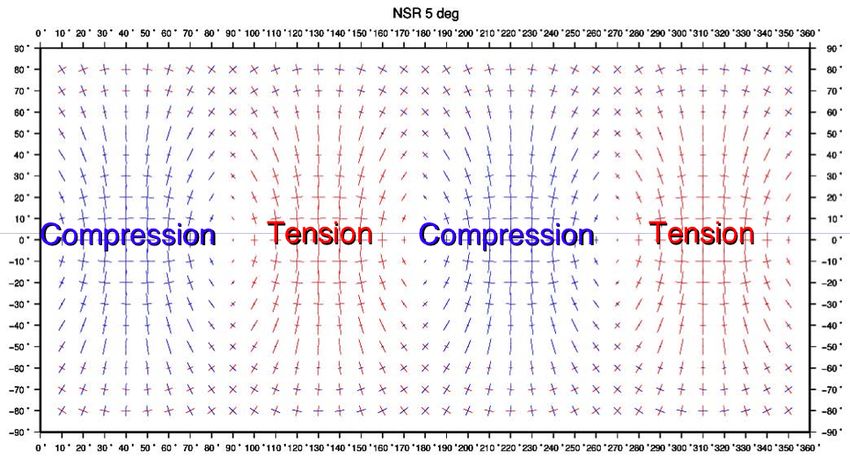
Evidence for a subsurface ocean on Europa
10 eininga ritgerð sem er hluti af Baccalaureus Scientiarum gráðu í jarðeðlisfræði

Höfundarréttur c 2010 Sigríður Kristjánsdóttir
Öll réttindi áskilin

Jarðvísindadeild
Verkfræði- og náttúruvísindasvið
Háskóli Íslands
Sturlugötu 7
101 Reykjavík

Sími: 525 4000

Skráningarupplýsingar:
Sigríður Kristjánsdóttir, 2010, Evidence for a subsurface ocean on Europa, BS ritgerð,
jarðvísindadeild, Háskóli Íslands, 25 bls.

Prentun: Háskólaprent
Reykjavík, maímánuður 2010
Hér með lýsi ég því yfir að ritgerð þessi er samin af mér og að hún hefur hvorki að
hluta né í heild verið lögð fram áður til hærri prófgráðu.

                                           i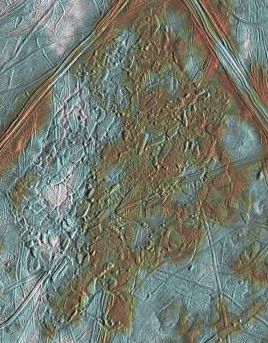
Abstract
    Europa is one of the four Galilean satellites orbiting Jupiter. It was discovered
by Galileo Galilei in 1610 and has since intrigued scientists and amateurs alike.
Its location in the outer solar system permits water ice to exist in abundant form
and beneath the icy shell of Europa scientists believe water to exist in liquid form.
The formation of ridges, cycloids and other linear features crisscrossing the surface
suggest the presence of a liquid water layer underlying the crust. Calculations of
the magnitude of tidal stress needed to break the frozen surface show that sufficient
stress to overcome the strength of the crust is only attained if a liquid layer is present
under the moon’s ice cover. The strongest evidence comes from measurements of
the magnetic field around Europa. The results require a conductive layer of liquid
water with dissolved salts underlying the ice crust at shallow depths. The presence
of liquid water makes Europa one of the few places in our solar system that could
harbour life. To confirm or refute this the National Aeronautics and Space Admin-
istration (NASA) and the European Space Agency (ESA) have joined forces to send
two spacecrafts to the Jupiter system. The two crafts are scheduled for two seperate
launches in 2020 arriving at the Jupiter system in 2025.

                                         Ágrip

Evrópa er eitt hinna svokölluðu Galíleó tungla á braut um Júpíter. Galíleó Galílei á
heiðurinn af uppgötvun þeirra, en hann beindi hinum nýuppgötvaða stjörnusjónauka
að plánetunni árið 1610 og sá tunglin fjögur ganga um Júpíter. Vísindamenn og al-
menningur hafa síðan velt vöngum yfir furðuveröldinni á Evrópu. Vegna legu Evrópu
í ytra sólkerfinu er H2 O-ís til staðar á tunglinu í miklu magni og benda rannsóknir til
þess að vatn finnist í vökvaham undir gaddfreðnu yfirborðinu. Víðáttumiklir hryg-
gir, bogadregnar myndanir sem kallast cycloids og önnur línuleg yfirborðsfyrirbæri
liggja þvers og kruss um yfirborðið. Myndun þessara fyrirbæra hefur verið útskýrð
með tilvist undirlags af fljótandi vatni. Þá hafa vísindamenn komist að því að lag
af vatni á fljótandi formi er nauðsynlegt til þess að hægt sé að kalla fram nægilega
spennu til þess að yfirvinna styrk íssins og brjóta upp yfirborðið. Ennfremur leiða
niðurstöður mælinga á segulsviði í kringum Evrópu til þeirrar niðurstöðu að leiðandi
lag af fljótandi vatni blandað uppleystum söltum sé að finna undir yfirborðinu. En
ein forsenda lífs eins og við þekkjum það er vatn á vökvaformi. Evrópa kemur því til
greina sem einn af fáum stöðum í sólkerfinu þar sem líf kann að þrífast. Bandarísku
og evrópsku geimferðarstofnanirnar (NASA og ESA) hafa tekið saman höndum og
ætla sér að senda tvö geimför til Júpíters gagngert til þess að staðfesta eða hrekja
tilvist lífs í Júpíterkerfinu. Áætlað er að senda förin af stað árið 2020 og ætti ferðin
að taka fimm ár.

                                            ii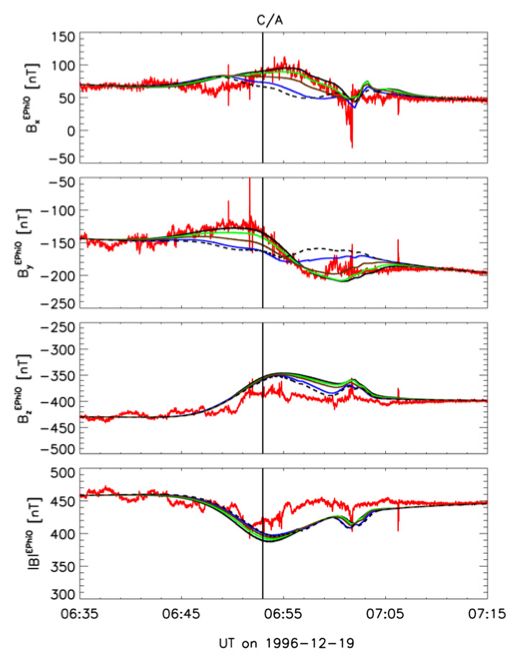
Contents
List of Figures                                                                                                                                   iv

1 Introduction                                                                                                                                    1

2 Surface features                                                                                                                                 3
  2.1 Double ridges . . . . . . .     .   .   .   .   .     .   .   .   .   .   .   .   .   .   .   .   .   .   .   .   .   .   .   .   .   .   . 4
  2.2 Cycloids . . . . . . . . . .    .   .   .   .   .     .   .   .   .   .   .   .   .   .   .   .   .   .   .   .   .   .   .   .   .   .   . 6
  2.3 Dilational bands . . . . .      .   .   .   .   .     .   .   .   .   .   .   .   .   .   .   .   .   .   .   .   .   .   .   .   .   .   . 7
  2.4 Converging bands . . . . .      .   .   .   .   .     .   .   .   .   .   .   .   .   .   .   .   .   .   .   .   .   .   .   .   .   .   . 9
  2.5 Strike-slip fault . . . . . .   .   .   .   .   .     .   .   .   .   .   .   .   .   .   .   .   .   .   .   .   .   .   .   .   .   .   . 9
  2.6 Chaotic terrain . . . . . .     .   .   .   .   .     .   .   .   .   .   .   .   .   .   .   .   .   .   .   .   .   .   .   .   .   .   . 11
  2.7 Non-synchronous rotation        .   .   .   .   .     .   .   .   .   .   .   .   .   .   .   .   .   .   .   .   .   .   .   .   .   .   . 12

3 Inner structure                                                                     15
  3.1 Convection and diapirism . . . . . . . . . . . . . . . . . . . . . . . . . . . 16
  3.2 Estimation of the thickness of the stagnant lid . . . . . . . . . . . . . . . . 17

4 Magnetic field measurements                                                                                                                    20

5 Search for life on Europa                                                                                                                      24

6 Conclusion                                                                                                                                     25

References                                                                                                                                       26

                                                      iii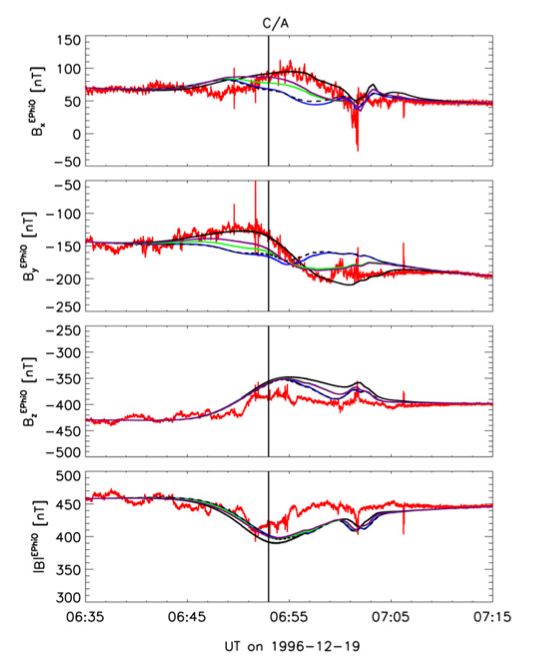
List of Figures
1 Surface of Europa as seen from the Galileo spacecraft. Notable are dark
ridges criss-crossing the surface, many more than 1,600 km long, and dark
patches which scientists believe are the result of melting of the icy surface.
The mosaic covers a large part of the northern hemisphere. It is centered
on 20 degrees north and 220 degrees west and is about as wide as the
United States west of the Mississippi River (NASA/JPL/USGS, 1998). . . 2
2 Stress pattern on Europa resulting from diurnal and non-synchronous
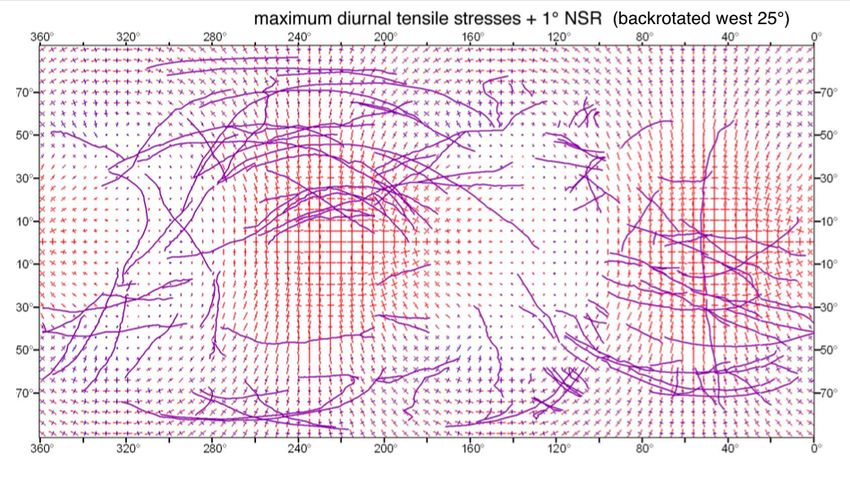
stress (Pappalardo). . . . . . . . . . . . . . . . . . . . . . . . . . . . . . . 3
3 Lineaments on the surface of Europa fitted with the global stress pattern.
A 25◦ backrotation of the non-synchronous rotation gives the best results
(Pappalardo). . . . . . . . . . . . . . . . . . . . . . . . . . . . . . . . . . . 4
4 This high resolution image of Europa’s surface shows in great detail the
general structure of a double ridge running from the lower left hand corner
to the upper right hand corner. It also demonstrates how ridge formations
have continuously rewritten the history of the surface (NASA/JPL/ASU,
1998). . . . . . . . . . . . . . . . . . . . . . . . . . . . . . . . . . . . . . . 5
5 In this enhanced color image taken by Galileo, “triple” bands are clearly
visible in several places, most notably in the upper part. The striking
crater feature near the center of the image is the Pwyll crater, considered
one of the youngest features on Europa (NASA/JPL/UA, 1998a). . . . . . 6
6 Cycloidal ridges near the Europa’s south pole as viewed by the Voyager
spacecraft (cyc, 1979). . . . . . . . . . . . . . . . . . . . . . . . . . . . . . 7
7 Model of cycloidal crack formation on Europa by Hoppa et al. The arrows
represent the amplitude and orientation of the tensile stress. The numbers
below the arrows indicate the hours of the orbit (Hoppa et al., 1999b). . . 8
8 The broad dark features seen here are believed to be dilational bands
formed by tensional stress pulling the crust apart. The arcuate shape
suggests they started out as cycloidal cracks (NASA/JPL, 1997). . . . . . 9
9 An example of surface convergence seen on the trailing hemisphere of Eu-
ropa. The top image shows the current appearance of the region. In
the lower image strike-slip faults in the surrounding area have been re-
constructed resulting in an 8 km gap represented by the white section.
Scientists suggest this area was removed by convergence of the adjacent
plates (Sarid et al., 2002). . . . . . . . . . . . . . . . . . . . . . . . . . . . 10
10 The Conamara chaos. Visible are blocks of ice that seem to have been
broken from the crust and displaced. Some of them still bear markings
of the previous terrain. Scientists differ in opinion on the formation of
chaotic terrain (see text). (NASA/JPL/UA, 1998b). . . . . . . . . . . . . 12
iv11 Distribution of lineaments of different ages. (a) shows ancient bands and
bright wedges oriented northeast-southwest, (b) shows intermediate-aged
triple bands and similarly coloured materials oriented west-east, and (c)
shows young fractures which cross-cut the triple bands oriented northwest-
southeast (Geissler et al., 1998). . . . . . . . . . . . . . . . . . . . . . . . . 13
12 Two models have been proposed for the inner structure of Europa. Top
model: A warm, convecting ice layer lies several kilometers below a brittle
ice crust. Bottom model: A thick layer of liquid water lies below a thin
ice covering (NASA/JPL, 1999). . . . . . . . . . . . . . . . . . . . . . . . 15
13 Scientists suggest that the semicircular uplifted features seen in this image
are surface manifestations of diapirs rising through the outermost icy shell
(NASA/JPL-Caltech, 1997). . . . . . . . . . . . . . . . . . . . . . . . . . . 17
14 Surface deformation, h, as a function of initial diapir radius, r, and con-
ductive lid thickness, δ0 . Dotted lines show results for spherical diapirs
and solid lines for elongated diapirs. . . . . . . . . . . . . . . . . . . . . . 19
15 Observed and modeled magnetic field from Schilling et al., 2007. Data
from the E4 flyby was used and the coordinate system is EPhiO. The
red curve shows the measured field (Kivelson et al., 1997). The dashed
black curve shows the predicted field when no induction is included in
our model. The predicted field by including induction is shown for the
ocean conductivities σoc : 100mS/m (blue), 250 mS/m (brown), 500 mS/m
(green), and 5 S/m (black). The assumed thickness of the crust is 25 km
and the assumed thickness of the ocean is 100 km (Schilling et al., 2007). . 22
16 Same as figure 11 for an ocean thickness of 25 km. The predicted field by
including induction is shown for the ocean conductivities σoc : 100 mS/m
(blue), 500 mS/m (green), 1 S/m (purple), and 5 S/m (black) (Schilling
et al., 2007). . . . . . . . . . . . . . . . . . . . . . . . . . . . . . . . . . . 23
vAcknowledgements
I would like to thank Þorsteinn Þorsteinsson, glaciologist at the Icelandic Met Office,
for his guidance and encouragements. I am very grateful for the help of my parents,
Auður Andrésdóttir and Kristján Guðmundsson, and my mother- and father-in-law,
Karen Sturlaugsson and Björn Sturlaugsson. I would also like to thank my sister, Ólöf
Kristjánsdóttir, for her helpful advice and patience. Last, but not least, I could not have
done this without the support and motivation of my husband, Sturlaugur Jón Björnsson.
viEvidence for a subsurface ocean on Europa
1 Introduction
Europa is one of the four Galilean satellites orbiting Jupiter and discovered by Galileo
Galilei in 1610. The other three are Io, the most volcanically active body in the solar
system, Ganymede, the largest moon in the solar system and Callisto, whose cratered
surface is as old as the solar system. The true nature of Europa eluded researchers for
centuries. Earth-based observations in the 20th century, mainly spectroscopic studies,
indicated that the surface was composed predominantly of water ice, as had been pre-
dicted from its position in the outer solar system. Images from the Voyager spacecrafts
in 1979 revealed a young and possibly active surface and Galileo images taken during
the Galileo mission in the years 1995 - 2003 showed prominent ridge systems and dark
patches where the icy surface seemed to have melted (Fig. 1). Subtle variations in the
spacecrafts’ trajectories implied a differentiated body subdivided into a metallic core of
radius 700 km, a silicate mantle and an outer layer as thick as ∼150 km with the density
of water (Greenberg, 2005). Further details are listed in Table 1.
Table 1: Details of Europa (NASA, 2010)
Radius 1,565 km
Orbital radius 671,000 km
Orbital eccentricity 0.009
Mean density 2.94 g/cm3
Orbit period 3.55 Earth days
Early in the exploration of Europa scientists realized that tides would play a major
role in the forces at work on the moon. Ordinarily, because of the frictional dissipation
of the gravitational potential energy, Europa should have settled into a circular orbit
around Jupiter long ago. In fact, as noted in Table 1, Europa’s orbital eccentricity is
e = 0.009. This is the result of Europa rotating around Jupiter in resonance with Io and
Ganymede. The satellites are locked into a ratio of 1:2:4, i.e. Europa’s period is twice as
long as Io’s and Ganymede’s four times the period of Io. This was discovered by Galileo
in the early 1600s and explained by Pierre-Simon Laplace nearly two centuries later. He
showed that the periodic repetitions of the conjunctions of the galilean satellites enhances
their mutual gravitational effects and thus reinforces and maintains tidal heating in the
1innards of Europa (Laplace, 1805). The tidal heating may be enough to withhold a layer
of liquid water beneath the surface. One of the strongest evidence for a liquid water layer
on Europa comes from magnetic measurements of Jupiter’s magnetic field. An induced
magnetic field generated by electric currents is detected around Europa. The required
conductivity can not be met by water ice, but requires liquid water with dissolved salts.
This, and other evidence for a subsurface ocean, is the subject of this essay.
Figure 1: Surface of Europa as seen from the Galileo spacecraft. Notable are dark ridges
criss-crossing the surface, many more than 1,600 km long, and dark patches which scien-
tists believe are the result of melting of the icy surface. The mosaic covers a large part
of the northern hemisphere. It is centered on 20 degrees north and 220 degrees west and
is about as wide as the United States west of the Mississippi River (NASA/JPL/USGS,
1998).
2Figure 2: Stress pattern on Europa resulting from diurnal and non-synchronous stress
(Pappalardo).
2 Surface features
Two distinctive features characterize the surface of Europa: a complicated network of
ridges and fractures and dark patches where the surface seems to have melted. The first
images of Europa taken by the Voyager spacecrafts showed a smooth surface devoid of
craters. Higher resolution images taken by NASA’s Galileo spacecraft revealed a low
crater density confirming earlier views from Voyager. This scarcity of impact craters
suggests that Europa’s surface is young and possibly active today. Zahnle et al. (2003)
estimate the age of the surface to be between 30 and 70 Myr, which is only about one
percent of the age of the solar system.
Europa’s young surface has been transformed countless times by tectonic activity.
The evidence of this activity gives us clues about the inner structure of the moon and
the processes that have transfigured it. Of the surface structures, linear features are the
most prominent ones. They vary widely in size and shape as they crisscross the entire
surface of the globe. Their origin lies in the tidal stress field on the moon generated
by the moon’s interaction with Jupiter (Greenberg, 2005). The tidal stress is made
up of two components: a background stress which builds up as a tidal bulge migrates
across Europa’s surface due to non-synchronous rotation1 and the diurnal stress formed
as the moon circles Jupiter. However, neither diurnal stress nor non-synchronous stress
alone would suffice to explain the crack patterns observed on Europa. Fig. 2 shows the
stress pattern on Europa resulting from diurnal and non-synchronous stress. Scientists
hypothesize that cracks form perpendicularly to the tensional stress. Fig. 3 shows indeed
1
See further discussion of non-synchronous rotation in section 2.7.
3Figure 3: Lineaments on the surface of Europa fitted with the global stress pattern. A
25◦ backrotation of the non-synchronous rotation gives the best results (Pappalardo).
how the global distribution of lineaments fits with the stress pattern if it is backrotated
25◦ . According to Greenberg (2005) this stress field theory requires a global ocean layer
beneath the icy crust to provide a tidal amplitude large enough to overcome the strength
of the crust. A closer look at these lineaments crisscrossing the surface of the moon
provides a better understanding of the processes at work. Five categories comprise the
set of linear and arcuate features visible on Europa according to appearance or formation:
Double ridges, cycloids, dilational bands, strike-slip faults and converging bands.
2.1 Double ridges
Double ridges are so called because they generally appear in pairs. They comprise a
significant part of the surface and range from a few kilometers in length to hundreds of
kilometers. Fig. 1 shows a mosaic of images taken from NASA’s Galileo spacecraft. The
mosaic covers a large part of the northern hemisphere including the north pole at the top
of the image. Noticable are dark bands lying roughly east-west in the central latitudes,
dark patches towards the west and arcuate lineaments in the south. Some of the dark
bands, among them Udaeus and Minos Linea intersecting in a striking figure X at the
top, stretch for over 1,600 km. Although there is a general consensus that these dark
bands are ridges scientists differ on how they formed. When high resolution images are
studied closely it is evident that processes creating ridges have continuously rewritten
the history of Europa’s surface (Fig. 4).
Fig. 4 also shows the general structure of the double ridge. Two ridges run parallel
to each other seperated by a trench. Darker material flanks the ridges and in earlier
4Figure 4: This high resolution image of Europa’s surface shows in great detail the general
structure of a double ridge running from the lower left hand corner to the upper right
hand corner. It also demonstrates how ridge formations have continuously rewritten the
history of the surface (NASA/JPL/ASU, 1998).
low resolution Voyager photographs, ridges appeared as a bright band lined with darker
material on each side and hence they were called “triple band”. This effect can clearly be
seen in Fig. 5 in the upper part of the image. Higher resolution images revealed the true
form of the double ridges. Several models have been proposed to explain the formation
of these ridges. Of the various models five will be considered here.
Greenberg (2005) suggests that ridges form when cracks are repeatedly opened and
closed during diurnal changes in the stress field (a europan day constitutes 3.5 Earth
days and represents the time of one revolution around Jupiter). Crushed ice is squeezed
upon the surface as the crack closes on a thin film of frozen water. Head et al. (1998),
Head and Pappalardo (1999) and Pappalardo et al. (1998) propose that linear diapirs
rise up buoyantly pushing into preexisting cracks and tilting upward the brittle-elastic
lithosphere along the sides of the crack. Kadel et al. (1998) suggest that double ridges
represent volcanic debris deposited ballistically by gas-driven fissure eruptions of frost,
ice, water and some minor silicate fraction. Others have suggested that ridges are the
result of compression or the injection of melt into shallow cracks (Pappalardo et al., 1999).
These models have different implications for the presence and distribution of liquid water
in Europa’s subsurface. The first model requires a liquid water ocean at most several
kilometers under an icy shell. The diapirism model, as well as the compression model,
requires that subsurface materials deform ductily in response to the stresses involved in
moving this material several kilometers or more to the surface. These two models do not
require a liquid water layer. The remaining two models, the volcanic model and injection
model, both require liquid water at or very near the surface. Figuring out which of these
models represents best how ridges are formed would certainly help to answer the question
of the thickness of the ice crust.
5Figure 5: In this enhanced color image taken by Galileo, “triple” bands are clearly visible
in several places, most notably in the upper part. The striking crater feature near the
center of the image is the Pwyll crater, considered one of the youngest features on Europa
(NASA/JPL/UA, 1998a).
2.2 Cycloids
Among some of the most fascinating and enigmatic features discovered on Europa are
the so-called cycloids (Fig. 6). First discerned in Voyager images, the arcuate ridges
puzzled scientists for years. They are most often observed as double ridges but their
most primitive form is observed as a crack or trough. Previous models for the formation
of cycloidal and other arcuate features depended on compression and thrust faulting.
Galileo observations of these features show no evidence of compression or subduction
along them. Hoppa et al. (1999c) propose that cycloidal cracks form in response to Eu-
ropa’s tides. Their model suggests that the arcuate pattern forms when cracks propagate
across an ever-changing stress field as Europa revolves around Jupiter. The propagation
follows a curved path until it reaches a critical value where the tensile stress is insuffi-
6Figure 6: Cycloidal ridges near the Europa’s south pole as viewed by the Voyager space-
craft (cyc, 1979).
cient to continue the propagation (Fig. 7). When cracking commences again the stress
field has changed and the crack propagates in a new direction creating a cusp. Thus,
one arc is created in one Europan day. This implies that cycloidal cracks form very
rapidly, on the order of weeks. This model also explains several other characteristics of
cycloidal features. It explains how cycloids with arcuate segments opening northward
can be formed next to features that open southward. The former form when cracks
propagate westward in the southern hemisphere, whereas the latter would form when
cracks propagate eastward in the southern hemisphere. The opposite effect would take
place in the northern hemisphere. Most arcuate features are skewed, so that there is a
systematic change in the radius of curvature along the length of some cycloidal ridges.
Hoppa et al.’s model cycloidal cracks are similarly skewed if the crack propagation speed
varies as a function of the tension, which is reasonable to expect. This model also pro-
vides a mechanism for terminating the propagation of these cracks after several hundred
kilometers. If a crack propagates into a region where the diurnal stress never reaches
the strength of the ice, then cracking stops. Finally, this model explains the large-scale
curvature of cycloidal chains. This overall curvature results as a crack propagates to
different longitudes. Hurford et al. (2007) have made improvements to this model. By
allowing material parameters to vary for each arc of an observed cycloid they get an
improved fit when applying their model to actual cycloids (Hoppa et al. had used a fixed
set of material parameters). Refining their new model even further, accounting for stress
accumulating during non-synchronous rotation, in addition to diurnal stress, Hurford et
al. got an even better fit.
2.3 Dilational bands
Dilational bands may have started out as fine cracks in the surface of Europa just like
double ridges. The dilational bands seen on Fig. 8 even seem to have started out as
cycloidal cracks. But instead of material building up on each side of the crack tensional
7Figure 7: Model of cycloidal crack formation on Europa by Hoppa et al. The arrows
represent the amplitude and orientation of the tensile stress. The numbers below the
arrows indicate the hours of the orbit (Hoppa et al., 1999b).
stress has pulled it apart. Their greatest characteristic is that the landscape can be
reconstructed by closing the bands and restoring structures on either side that had been
separated when the band formed. The interior is generally smooth and flat, although
some dilational cracks evolve into wide ridges.
Dilational bands are thought to form in a similar manner to terrestrial mid-ocean
ridges (Prockter et al., 1999; Stempel et al., 2005). This is supported by the general
morphology of the bands. Centered in most bands lies an axial trough and on either side
linear morphological units have built up, indicating a symmetrical development. The
linear units can be divided into a hummocky textured zone closest to the central trough
and subparallel ridges and troughs further out. The boundaries may be marked by a
sharp discontinuation or ridges. Stereo imaging has provided evidence of a dilational band
that stands topographically higher than the surrounding ridged plains, consistent with
emplacement of relatively buoyant material (Pappalardo et al., 1999). The observation
that the band stands high today implies that topographic relaxation has not occurred
as the ice cooled, or that this band formed very recently (Prockter et al., 1999). Slow
non-synchronous rotation and rapid diurnal tidal flexing are the most likely sources of the
tensile stress allowing for buoyant, ductile ice to rise toward the surface (Stempel et al.,
2005). This is consistent with Greenberg’s conclusion that the driving forces of dilation
operate over large regions (Greenberg, 2005). He also concludes that dilation bands are
the result of a very mobile icy crust, which is able to slide readily over a slippery liquid
layer. Furthermore, his vision of the formation of dilational bands requires the crack to
penetrate through the whole crust to a liquid ocean underneath. This enforces the theory
of a liquid ocean beneath the surface as well as implying a thin crust. Others point out
that bands do not provide direct evidence for a liquid water ocean, but may have opened
above warm ductile ice (Pappalardo et al., 1999).
8Figure 8: The broad dark features seen here are believed to be dilational bands formed
by tensional stress pulling the crust apart. The arcuate shape suggests they started out
as cycloidal cracks (NASA/JPL, 1997).
2.4 Converging bands
One of the unsolved problems of the formation of dilational bands is the question of
surface area budget. Little evidence has been found of converging zones although Green-
berg and his team believe Agenor Linea in the southern hemisphere of Europa to be
a convergence feature. To support this they point out that Agenor has resisted efforts
at reconstruction excluding the explanation that it is a dilational band. Furthermore,
Agenor Linea’s proximity to the Wedges region suggests that Agenor is the site for sur-
face removal to balance out the surface created at the Wedges region. Other examples
of convergence have been located when dilation bands and strike-slip faults have been
reconstructed (Greenberg, 2005). One example can be seen in Fig. 9 where a strip of
material seems to have been removed by convergence of adjacent plates.
2.5 Strike-slip fault
Strike-slip displacement along cracks in the surface ice is common and widely distributed
on Europa. The first predominantly strike-slip displacement, Astypalaea Linea, was
identified by Randy Tufts in 1996 (Tufts et al., 1999). Hoppa et al. (1999a) propose
9Figure 9: An example of surface convergence seen on the trailing hemisphere of Europa.
The top image shows the current appearance of the region. In the lower image strike-
slip faults in the surrounding area have been reconstructed resulting in an 8 km gap
represented by the white section. Scientists suggest this area was removed by convergence
of the adjacent plates (Sarid et al., 2002).
10that diurnal tides due to orbital eccentricity may drive strike-slip motion on Europa
through a process they call “tidal walking” in which faults open and close out of phase
with alternate right- and left-lateral shear. As an example, a right-lateral strike-slip
fault would be formed in this sequence: 1) Tensional stress opens a crack 2) The stress
field shifts so that shear stress is applied and one side moves to the right compared to
the other 3) The stress field shifts again closing the crack 4) The stress becomes shear
stress once again but it is now applied to a closed crack and no displacement occurs.
Thus, this sequence can “walk” the fault in a manner closely analogous to actual walking.
Preblich et al. (2007) have modelled the process of “tidal walking” using a finite-element
numerical simulation of the behaviour of viscoelastic materials. For material parameters
that are plausible for the water ice composing Europa’s crust, the simulation confirms
earlier analytic results for strike-slip displacement along a crack that penetrates down to
the liquid water substrate.
The study of strike-slip displacement has provided valuable evidence regarding the
physical processes at work on Europa. Reconstruction of strike-slip fault displacement
delivered the first evidence of convergence bands that compensate for the dilation that
has gone on elsewhere (Sarid et al., 2002). Strike-slip study has also provided further
evidence of non-synchronous rotation. Furthermore, the distribution of strike slip in
both hemispheres provides evidence for polar wander. In general, right lateral shear is
predicted to predominate in the far southern hemisphere, and left lateral in the north,
with a mix depending on azimuth within ∼ 30◦ of the equator (Hoppa et al., 1999a).
When the distribution of strike slip is compared with predictions of the theory of tidal
walking, the crust of Europa appears to have slid as a single unit relative to the spin axis
(Sarid et al., 2002). The theory of tidal walking indicates that the top layer of the crust
is decoupled from a lower layer. This enforces the idea that underneath the surface lies
an ocean. In addition, the theory requires that cracks penetrate to the lower decoupling
layer indicating that the ice must be quite thin, less than 10 km (Greenberg, 2005).
2.6 Chaotic terrain
We now turn our attention to the other prominent feature on the surface of Europa,
chaotic terrain. In earlier Voyager images these areas appeared as dark patches but
images obtained by Galileo revealed chaotic regions where ice blocks bearing marks of
preexisting terrain lie stranded in a rough and hummocky texture. Greenberg et al.
(1999) found by extrapolation that 18% of Europa’s surface is covered by fresh chaotic
terrain, another 4% is covered by modified terrain and still more older terrain has been
overprinted by tectonic structures.
High-resolution images of the Conamara Chaos, the most intensily studied chaotic
region, show in great detail small scale blocks of ice that have been mobilized and possibly
tilted (Fig. 10). This indicates local melting where the ice blocks are analogous to
buoyant icebergs on Earth. Different models have been proposed for the formation of
chaotic terrain. Greenberg et al. (1999) suggest that local or regional heating melts
through the icy crust, starting at the bottom at its interface with a global ocean, and
continuing until the crustal thickness is reduced to essentially zero over some portion
11Figure 10: The Conamara chaos. Visible are blocks of ice that seem to have been
broken from the crust and displaced. Some of them still bear markings of the previ-
ous terrain. Scientists differ in opinion on the formation of chaotic terrain (see text).
(NASA/JPL/UA, 1998b).
of the surface. However, Pappalardo et al. (1999) point out that this model requires
more heat than is available at one particular point over a period of time. Pappalardo
et al. (1998) propose that chaotic terrain is the result of solid-state ice rising diapirically
toward the surface. However, solid-state diapirism is inconsistent with the observed size
range of chaos blocks (Collins et al., 2000). The timescale of block movement in warm
ductile ice is expected to be longer than the timescale of thermal diffusion causing blocks
to cool in place (Greeley et al., 2004).
2.7 Non-synchronous rotation
Like most other moons in our solar system, the Galilean satellites were long thought to
rotate synchronously with their orbital motions around Jupiter, i.e. always presenting
the same face to the planet. Non-synchronous rotation was predicted by Greenberg and
Weidenschilling in 1984 by considering the orbitally averaged torque exerted by Jupiter on
the satellite’s tidal bulges (Greenberg and Weidenschilling, 1984). Tidal torques rapidly
drive spin rates toward exact synchronous rotation if the orbit is circular. However,
Europa’s orbit is slightly eccentric (e = 0.009) due to its dynamical interaction with Io
and Ganymede and tides tend to increase the spin rate. If Europa’s ice shell is decoupled
12from the interior by a layer of liquid or ductile ice the outermost shell could slip over
the lower layer rotating gradually relative to the direction of Jupiter. Evidence for
non-synchronous rotation can be found in Europa’s geological history. As the surface
reorientates relative to fixed global patterns of tidal stress, systematic changes in the
orientation of lineaments with age may be expected (Geissler et al., 1998). Geissler et
al. analyzed the orientation and distribution of lineaments in multispectral images of
Europa’s northern high-latitude region performed during Galileo’s first orbit of Jupiter.
They found at least three distinct classes of linear features in false-colour composites made
up from those images. Their distribution are shown in Fig. 11. One can see that the
orientation has gone from roughly northwest-southeast in the ancient bands and bright
wedges in Fig. 11a to roughly northeast-southwest orientation of the youngest fractures
in 11c, i.e. a clockwise rotation of stress direction has taken place in this region over
time. Other scientists have found other examples of lineaments orienting clockwise with
age (Kattenhorn, 2002). Geissler et al. suggest that the reorientation can be explained
by non-synchronous rotation. They do not assume that Europa’s lineaments necessarily
formed in response to the stresses associated with rotational reorientation, but rather that
as the surface rotates it carries the lineaments with it. However, Greenberg et al. (1998)
found that tidal stress results from a combination of diurnal and non-synchronous effects.
More recent research has cast doubt on the argument that the observed reorientation of
Figure 11: Distribution of lineaments of different ages. (a) shows ancient bands and
bright wedges oriented northeast-southwest, (b) shows intermediate-aged triple bands
and similarly coloured materials oriented west-east, and (c) shows young fractures which
cross-cut the triple bands oriented northwest-southeast (Geissler et al., 1998).
lineaments results from non-synchronous rotation (Sarid et al., 2004, 2005). Sarid et
al. show that the sequence of reorientation would fit as well into an arbitrary model
with rotation in the opposite sense from that predicted by theory. Nevertheless, the
changing orientation of lineaments observed on the surface is consistent with the theory
of non-synchronous rotation, but does not provide compelling evidence for it. In addition,
other evidence has been found that support theoretical predictions. Firstly, the crust is
expected to expand west of the sub- and anti-jove point as the surface stretches over
13the tidal bulges. Geissler et al. report a large region near Europa’s equator to the west
of the anti-jove point to be characterized by relatively short, dark wedge-shaped bands,
thought to be extensional bands. Secondly, if Europa rotated synchronously with respect
to Jupiter, an asymmetry in crater density should be seen in the trailing and leading
hemisphere. Indeed, no such asymmetry has been observed. Thirdly, Hoppa et al. (2001)
produced a model of the formation of cycloidal ridges which requires non-synchronous
rotation.
Future exploration carries the task of confirming with direct measurements the rate
of rotation of Europa’s crust. From the limit of less than one cycloidal crack forming
per 180◦ of rotation relative to the direction of Jupiter, and the estimated age of the
surface of 50 Myr, Europa’s non-synchronous rotation period has been estimated as <
250,000 years. A rotation rate in this range is fast enough to be directly observed in
the not-too-distant future (Hoppa et al., 2001). The confirmation of non-synchronous
rotation is an important step in verifying the existence of global subsurface ocean on
Europa.
143 Inner structure
From spectroscopic measurements in the 1960’s it was evident that Europa’s surface
consisted mostly of water ice and gravitational measurements from both Voyager and
Galileo spacecrafts indicate a differentiated body (Greeley, 1999). Detailed analysis of
the data reveal a dense metallic core of radius 700 km, a silicate mantle 700 km thick and
an outer layer of H2 O as thick as ∼150 km. The extreme cold temperatures on the surface
of Europa and the lack of a dense atmosphere eliminate the possibility of water existing
in liquid form on the surface. However, tidal dissipation resulting from Europa’s eccentric
orbit and Jupiter’s enormous tides may provide enough frictional heat to keep the water
in liquid form in a subsurface layer (Greenberg, 2005; Peale et al., 1979). Magnetic field
measurements strongly support this hypothesis and as described in previous chapters the
formation of many surface features can be explained by the existence of an interior liquid
ocean (magnetic field measurements are the subject of Chapter 4).
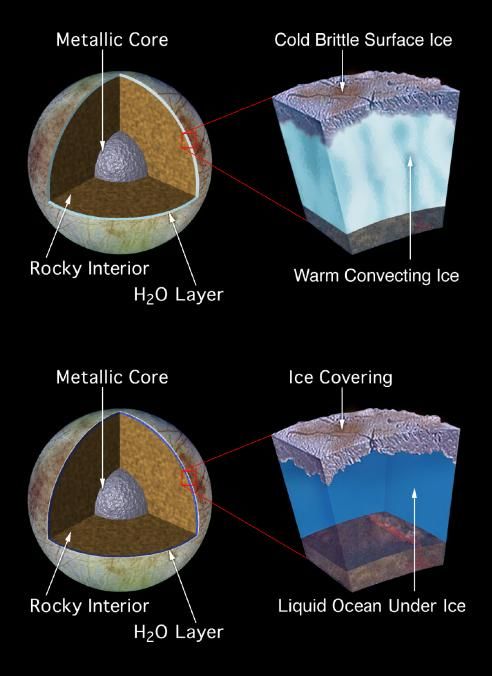
Figure 12: Two models have been proposed for the inner structure of Europa. Top model:
A warm, convecting ice layer lies several kilometers below a brittle ice crust. Bottom
model: A thick layer of liquid water lies below a thin ice covering (NASA/JPL, 1999).
Ojakangas and Stevenson (1989) found that if the total thickness of the water layer
exceeds 25 km it is unlikely to be completely frozen. The thickness of the outermost
ice shell is the subject of a great debate between scientists. Two main models have
been proposed: A thick shell consisting of a cold brittle surface layer overlaying a warm
15convecting layer and on the other hand a thin ice shell directly above a thick liquid layer
(Fig. 12). Billings and Kattenhorn (2005) published a list of estimates for the thickness
of the ice shell found by various methods. They found that the thickness ranges from 30 km depending on the method used. The range results from the difference in
methods, some apply to the total thickness of the ice shell including a ductile2 lower layer
while other methods give only the thickness of the elastic3 layer. Billings and Kattenhorn
(2005) also used flexure analysis, where they modeled the elastic ice layer as flexing under
a line load, to assess the thickness of the elastic layer. For three linear ridges examined
they found the thickness to be 500-2200 m in two sites and 200-1000 m in the third. This
is in accordance with the general conclusion that the thickness of the elastic layer is ≤2
km (Pappalardo et al., 1999). Ojakangas and Stevenson (1989) used thermal equilibrium
to estimate the global thickness and found an average thickness of 13-25 km depending
on the type of rheology (Maxwell rheology or generalized flow law). Hoppa et al. (1999c)
explained the formation of cycloidal features on Europa with a model that requires the
shell thickness to be only a few kilometers and directly overlying a liquid ocean. By
inspecting impact craters Schenk (2002) infers a total ice thickness of at least 19 km.
For a fluid layer that is heated from below or within and cooled from above gravitational
unstability should arise from the density difference of the light warm fluid and the cool
dense fluid (Turcotte and Schubert, 2002). Scientists suggest that if the layer reaches a
certain thickness convection would take place in the ductile layer.
3.1 Convection and diapirism
Pappalardo et al. (1998) calculated the required thickness of a warm sublayer for the
onset of solid-state convection. From the definition of the critical Rayleigh number
ρgh3 α∆T
Racr = (1)
κη
where the density is assumed ρ = 923 kgm−3 , the thermal expansivity α = 1.4·10−4 K −4 ,
the thermal diffusivity κ = 1.4 · 10−6 m2 s−1 , ∆T = 76 K, g = 1.31 ms−2 and the effective
viscosity ηef f ∼
= 108 − 109 M P a s Pappalardo et al. found, for Racr = 2000 ± 1500, the
thickness of the sublayer to be h = 2 − 8 km at the start of convection. They suggest
that diapirism, the buoyant upwelling of relatively warm and light ice, generates roughly
circular surface features collectively called pits, domes and spots (Fig. 13). The formation
of salt domes on Earth are another example of diapirism. Greenberg (2005), an advocate
of the thin ice model, criticizes the definition of pits, spots and domes and claims they
are simply locations of chaotic terrain which he explains as places of melt through of
the thin ice. Pappalardo and Barr (2004) later revised their model to a double-diffusive
convection model, where the required buoyancy is achieved by a difference in composition
of the warm diapir and the surrounding ice. Nimmo and Giese (2005) examined both the
2
Ductile or plastic deformation is a continuous, irreversible deformation without fracture.
3
Elastic materials deform when a force is applied and return to their original shape when the force is
removed. Earth’s crust is divided in a similar manner.
16Figure 13: Scientists suggest that the semicircular uplifted features seen in this image
are surface manifestations of diapirs rising through the outermost icy shell (NASA/JPL-
Caltech, 1997).
melt through model and the diapirism model in relation to chaos formation and found
that neither could satisfactorily explain the development of chaotic terrain. In another
article Nimmo, in association with Michael Manga, used the diameter of dome-shaped
features to infer the thickness of a conductive stagnant lid overlying a convective layer
(Nimmo and Manga, 2002). They also used the mean observed dome diameter to infer
the thickness of a lower thermal boundary layer. In the following section Nimmo and
Manga’s estimations of the thickness of the stagnant lid are re-calculated.
3.2 Estimation of the thickness of the stagnant lid
The surface temperature of Europa is around 100 K (Greenberg, 2005) and the ice near
the surface behaves in a rigid fashion. This is the conductive stagnant lid. The top
portion of the stagnant lid (≤2 km; Pappalardo et al. (1999)) behaves elastically and
may reduce the deformation caused by convection. Nimma and Manga assume that
the thickness of the stagnant lid, δ0 , and the thickness of the elastic layer, te , are simply
related because both are dependent on temperature. They give t0 = φδ0 where φ = 0.4 by
comparison of the elastic thickness with the oceanic lithosphere on Earth. The maximum
stress induced on the elastic layer by a rising spherical diapir of radius r can be found by
applying Archimedes’ principle to a cube of diameter 2r. The stress is given by S = FA
where F = ∆ρV g = ∆ρ(2r)3 g is the buoyancy force and A = (2r)2 is the area of the top
face of the cube. Thus, the maximum stress is S = ∆ρ2rg. Following Watts (2001) the
height, h, of the surface deformation by an ascending spherical diapir of initial radius r
17is given by
2r∆ρ 1 Et3e
h= 4 , D = . (2)
ρ 1 + 16Dπ
4
12(1 − σ 2 )
λ ρg
E is the Young’s modulus, λ is the effective wavelength of the diapir, σ is the Poisson’s
ratio and ρ the density of the ice. ∆ρ is the density difference between the diapir and
the surrounding ice and g is the gravitational acceleration.
The change in volume, and therefore the change in density, ∆ρ, can be calculated
from the definition of thermal expansivity (Turcotte and Schubert, 2002):
∆V0
α= ∆T. (3)
V
For the given value of α = 1.4 · 10−4 K −1 , the temperature difference ∆T = 40 K and
the ice density ρ = 917 kgm−3 we get ∆ρ = 5.1 kgm−3 . The authors assume that the
effective wavelength appropriate for a spherical diapir is λ = 4r and for an elongated
diapir λ = 8r. The elongated diapirs account for the lateral spreading of the diapir as
the stagnant lid is approached. The effect of spreading is the reduction of the surface
deformation by a factor of four (Koch and Manga, 1996, as cited by Nimmo and Manga).
From equation (2) we can now calculate the topography for a given radius of a diapir
and thickness of the stagnant lid.
Fig. 14 shows the results of the calculations. Assuming the lowest detectable height
of domes to be 10 m we can see that the minimum radius of a spherical diapir capable
of deforming the surface to a detectable degree is 1 - 2 times δ0 . Spreading diapirs show
the same results. The smallest dome-shaped features detected on Europa (also called
lenticulae) have a radius of 2 km, implying that the value of δ0 unlikely exceeds 2 − 4 km.
Taking uncertainties into consideration, Nimmo and Manga find the lid thickness to range
from 1 - 5 km. The uncertainties lie mainly in determining φ and the properties of the
ice, which are poorly known. The debate of the thickness of Europa’s ice shell will likely
not be resolved until new data emerge from future exploration missions.
18Figure 14: Surface deformation, h, as a function of initial diapir radius, r, and conduc-
tive lid thickness, δ0 . Dotted lines show results for spherical diapirs and solid lines for
elongated diapirs.
194 Magnetic field measurements
As mentioned in Chapter 1 the strongest evidence for a current subsurface ocean on Eu-
ropa comes from measurements of Jupiter’s magnetic field in the vicinity of the satellite.
Jupiter’s magnetic field is slightly tilted and as Europa orbits the rotating planet, the
moon experiences a time-varying magnetic field. This time-varying magnetic field drives
inductive currents through the electrically conducting layer of liquid water believed to
lie near the surface. The inductive currents generate a secondary field, whose source can
be represented as a time-varying magnetic dipole moment lying in Europa’s equatorial
plane with an orientation approximately anti-parallel to the instantaneous orientation of
the primary field (Kivelson et al., 2000). Scientists have found evidence of this secondary
field in magnetic measurements from Galileo. First results were inconclusive because the
possibility of a permanent dipole moment tilted toward the y-axis4 could not be excluded
as the source of the observed magnetic perturbations (Kivelson et al., 2000). The rea-
son was that the data used came from the close Europa passes on Galileo’s fourth and
fourteenth orbit (E4 and E14) and both passes occurred in Jupiter’s northern magnetic
hemisphere. An induced equatorial dipole moment changes orientation and amplitude
over a synodic period in a predictable manner. To confirm the existence of the inductive
field a flyby in the southern magnetospheric hemisphere was designed. Kivelson et al.
found that the signature observed on the close Europa pass of the 26th orbit around
Jupiter (E26), which occurred in the southern hemisphere, was consistent with a reorien-
tation of the equatorial dipole moment confirming that Europa has an induced magnetic
field.
In addition to the induced magnetic field there are magnetic field perturbations ow-
ing to the interaction of Europa’s atmosphere with the jovian magnetospheric plasma
(Schilling et al., 2007; Kivelson et al., 2000). Europa’s tenuous atmosphere consists
mostly of oxygen, with a vertical O2 column density of 2.4 − 14 · 1018 m−2 (Hall et al.,
1998). The magnetospheric plasma which Europa travels in rotates with Jupiter at
approximately the same speed. The azimuthal speed of the plasma is faster than the
orbital velocity of the Europa, so the plasma overtakes the satellites (Kivelson et al.,
2004). This is true for the other Galilean satellites as well. The interaction of the plasma
with the atmosphere generates currents which leads to a secondary induction effect, cre-
ating discrepancies in the modeled signature and the data (Kivelson et al., 2000). The
time-varying field generated in the interior of the moon also has an effect (Schilling et al.,
2007). Schilling et al. combine in their model the electromagnetic induction taking place
in the interior of Europa and perturbations from the plasma interactions. Their results
show an improved fit to observation data. Fig. 15 and 16 show the observed and mod-
eled magnetic field for the E4 flyby in the EPhiO coordinate system. The E4 pass of
Europa occurred in Jupiter’s northern magnetic hemisphere (Kivelson et al., 2000). The
red curve shows the magnetic field measured by the Galileo spacecraft (Kivelson et al.,
4
The coordinate system used in Kivelson et al. is Europa-centric with x along the co-rotating plasma
flow, y radially in toward Jupiter, and z parallel to Jupiter’s spin axis. This coordinate system is referred
to as EPhiO (Kivelson et al., 2000).
201997; as cited by Schilling et al. 2007). The dashed black curve represents results for
a pure plasma interaction without induction in the interior. The other lines show the
predicted field including induction for a range of ocean conductivities. In fig. 15 the
assumed thickness of the crust is 25 km and the assumed thickness of the ocean is 100
km. In fig. 16 the assumed value of the thickness of the crust is the same as in fig. 15
but the ocean assumed to be 25 km thick. By considering results from two additional
flybys (E14 and E26) the authors conclude that an ocean conductivity of 500 mS/m or
larger combined with ocean thicknesses of 100 km and smaller fit the magnetic field data
best. This leads to the following relation: electrical conductivity × ocean thickness ≥ 50
S/m km. Because the induced field is almost saturated for ocean conductivities > 500
mS/m the authors are not able to set an upper limit for the conductivity. The results of
Schilling et al. (2007) agree with the findings of Zimmer et al. (2000). They conclude that
Europa possesses a conductive layer with conductivity of at least 60 mS/m at maximum
depth of 200 km.
21Figure 15: Observed and modeled magnetic field from Schilling et al., 2007. Data from
the E4 flyby was used and the coordinate system is EPhiO. The red curve shows the
measured field (Kivelson et al., 1997). The dashed black curve shows the predicted field
when no induction is included in our model. The predicted field by including induction
is shown for the ocean conductivities σoc : 100mS/m (blue), 250 mS/m (brown), 500
mS/m (green), and 5 S/m (black). The assumed thickness of the crust is 25 km and the
assumed thickness of the ocean is 100 km (Schilling et al., 2007).
22Figure 16: Same as figure 11 for an ocean thickness of 25 km. The predicted field by
including induction is shown for the ocean conductivities σoc : 100 mS/m (blue), 500
mS/m (green), 1 S/m (purple), and 5 S/m (black) (Schilling et al., 2007).
235 Search for life on Europa
The great allure of Europa lies in the possibility of a vast subsurface ocean encircling
the satellite beneath an icy crust, as indicated by magnetic field measurements (Kivelson
et al., 2000). Water is one of the fundamental conditions for the evolvement of life as we
know it (Chyba, 2000). This makes Europa one of the likeliest places in our solar system
to harbor extraterrestrial life. Two other places in our solar system have been proposed
as suitable for life, either in the past or present: our neighbour Mars and Saturn’s
largest moon Titan (Lunine, 2005). Other requirements of life as we know it include the
presence of organic material, notably including carbon, and a useful source of free energy
(Chyba, 2000). All these factors help scientists to detect signs of life. The near-infrared
mapping spectrometer on Galileo (NIMS) found no evidence of organic molecules on the
surface (Lunine, 2005). This does not exclude the potential for organic molecules existing
below the icy crust, but indicates that when the molecules reach the surface the carbon-
hydrogen bonds are broken apart by particle radiation and the hydrogen escapes into
space. NIMS has however found evidence of hydrated minerals, such as evaporite salts
and clays, on the surface of Europa, suggesting that water is extruded to the surface.
Greenberg (2005) points out that life could exist in these cracks and slivers of sunlight
might reach these organisms enabling photosynthesis. Others have suggested the thermal
diapirs as habitable environments (Ruiz et al., 2007). Other sources of free energy have
also been proposed. Organisms might feed directly off the thermal energy radiating from
the ocean base, similar to creatures around so called black smokers on the ocean floor of
the Earth. Tidal currents might provide kinetic energy and even the magnetic fields in the
ocean have been considered as possible sources of free energy (Lunine, 2005). The future
exploration of Europa centers on one hand on confirming the existence of liquid water
beneath the icy crust, e.g. by radar measurements of the thickness of the outermost layer
and the behaviour of the ice shell as it is pulled and squeezed by tidal forces, and on the
other hand on finding signs of life. The National Aeronautics and Space Administration
(NASA) and the European Space Agency (ESA) have joined together in the Europa
Jupiter System Mission (EJSM) in the exploration of Jupiter, Europa and Ganymede
with the goal of answering the question whether the Jupiter system harbors habitable
worlds (NASA/ESA, 2009). It consists of two flight systems, the Jupiter Europa Orbiter
(JEO) from NASA and the Jupiter Ganymede Orbiter (JGO) from ESA, planned for
two separate launches in 2020 arriving at the Jupiter system in 2025.
246 Conclusion
Strong evidence have been found of a global layer of liquid water underlying the frozen
crust of the icy moon Europa. Results from magnetic measurements require a layer of
liquid water with dissolved salts underlying the ice shell at relatively shallow depths. A
liquid layer is necessery to enable the crust to deform sufficiently to account for the stress
needed to overcome the strength of the ice, leading to the formation of ridges, cycloids
and other linear features on the surface. Non-synchronous rotation and polar wander
suggest that the crust is decoupled from the mantle by a liquid layer enabling the ice
shell to slip as a whole relative to the spin axis.
Although the science community generally agrees on the existence of a subsurface
ocean the thickness of the ice shell covering the satellite is one of the most strongly
debated issues concerning Europa with estimates ranging from 30km. Un-
fortunately, existing data is unsufficient to resolve this matter and scientists will have to
wait for new data to be collected, hopefully within the next 20 years. Another question
burning on scientists, and the public as well, is whether Europa, or other moons in the
Jupiter system, harbor conditions suitable for the existence of life. The presence of water
certainly makes Europa a primary target for astrobiologists and hunters for extraterres-
trial life but we should not expect intelligent life forms. If there is life on Europa it is
more likely in the form of microbes and tiny creatures able to survive the harsh condi-
tions of the icy world. All we can hope for is that our curiosity and thirst for knowledge
that drives our exploration of the solar system will one day bring us the answers of all
these unanswered questions, whether it will be in the time of our generation or the next.
25References
(1979). http://pirlwww.lpl.arizona.edu/ hoppa/science/cycloid1.jpg.
Billings, S. E. and Kattenhorn, S. A. (2005). The greath thickness debate: Ice shell
thickness models for Europa and comparisons with estimates based on flexure at ridges.
Icarus, 177.
Chyba, C. F. (2000). Searching or life on Europa from a spacecraft lander. In NRC
Committee on Astrobiology. Workshop on life detection.
Collins, G. C., Head, J. W., Pappalardo, R. T., and Spaun, N. A. (2000). Evaluation of
models for the formation of chaotic terrain on Europa. J. Geophys. Res., 105.
Geissler, P. E., Greenberg, R., Hoppa, G., Helfenstein, P., McEwen, A., Pappalardo,
R., Tufts, R., Ockert-Bell, M., Sullivan, R., Greeley, R., Belton, M. J. S., Denk, T.,
Clark, B., Burns, J., Veverka, J., and the Galileo Imaging Team (1998). Evidence for
non-synchronous rotation of Europa. Nature, 391.
Greeley, R. (1999). Europa. In Beatty, J. K., Petersen, C. C., and Chaikin, A., editors,
The New Solar System. Sky Publishing Corporation and Cambridge University Press,
Cambridge, fourth edition.
Greeley, R., Chyba, C. F., Head, J. W., McCord, T. B., McKinnon, W. B., Pappalardo,
R. T., and Figueredo, P. H. (2004). Geology of Europa. In Bagenal, F., Dowling, T. E.,
and McKinnon, W. B., editors, Jupiter: The Planet, Satellites and Magnetosphere.
Cambridge University Press, Cambridge.
Greenberg, R. (2005). Europa The Ocean Moon: Search for an Alien Biosphere. Springer
Praxis Books, Chichester.
Greenberg, R., Geissler, P., Hoppa, G., Tufts, B. R., Durda, D. D., Pappalardo, R.,
Head, J. W., Greeley, R., Sullivan, R., and Carr, M. H. (1998). Tectonic processes on
Europa: Tidal stresses, mechanical response, and visible features. Icarus, 135.
Greenberg, R., Hoppa, G., Tufts, B. R., Geissler, P., and Riley, J. (1999). Chaos on
Europa. Icarus, 141.
Greenberg, R. and Weidenschilling, S. J. (1984). How fast do Galilean satellites spin?
Icarus, 58.
Hall, D. T., Feldman, P. D., McGrath, M. A., and Strobel, D. F. (1998). The far-
ultraviolet oxygen airglow of Europa and Ganymede. The Astrophysical Journal, 499.
Head, J. W. and Pappalardo, R. T. (1999). Brine mobilization during lithospheric heating
on Europa: Implications for formation of chaos terrain, lenticulae texture, and color
variations. In Lunar Planet. Sci. Conf., volume XXX. [CD-ROM].
26You can also read