Ireland: Recovery begins amid vaccine rollout success - NTMA Investor Presentation September 2021
←
→
Page content transcription
If your browser does not render page correctly, please read the page content below

Ireland: Recovery begins amid
       vaccine rollout success
           NTMA Investor Presentation
                     September 2021
Index
Summary – Page 2

Macro – Page 7

Fiscal – Page 22

NTMA Funding – Page 31

ESG Sustainability – Page 41

Structure of Irish economy – Page 52

Brexit – Page 61

Property – Page 67

Banks & other data – Page 74

                                       1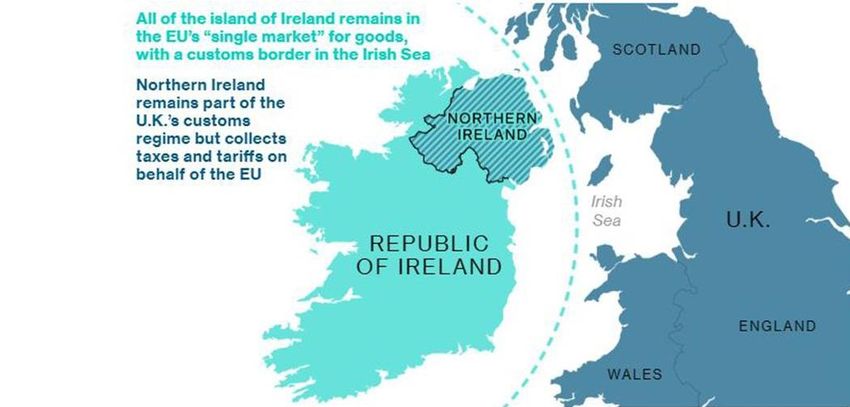
Summary
Irish economy has shown remarkable
resilience amid Covid shock

                                     2
Economic recovery showing promise
Vaccine rollout underpins spending led recovery
Domestic demand* gives better picture Unemployment steadily falling as Value added from ICT & pharma has
of Covid economic impact economy begins its recovery given Ireland resilience
30% 700 250
25% 600
200
20% 500
15% 400 150
10% 300
5% 200 100
0% 100
-5% 0 50
-10%
Sep-20
Apr-20
Nov-20
Apr-21
Feb-20
Mar-20
Jan-20
Jul-20
Feb-21
Mar-21
Aug-20
Jan-21
Jul-21
Aug-21
May-20
Dec-20
May-21
Jun-20
Oct-20
Jun-21
-15% 0
1998
1996
2000
2002
2004
2006
2008
2010
2012
2014
2016
2018
2020
2005
2007
2010
2012
2015
2017
2020
Unemployment claimants GVA: Domestic sectors
Domestic Demand GDP (Index, Jan 20 = 100)
GVA: Multinational dominated sectors
(€bns)
Source: CSO, NTMA Analysis
3
* Domestic demand series accounts for multinational activity and known as modified final domestic demand (excludes inventories)
Ireland’s debt ratios to rise again in 2021
       Large fiscal response required but Govt. will look to narrow deficit after 2021

Run of primary surpluses before ‘20 GG                   Debt position reversed in 2020    Debt fell from 166% to 95% of national
     deficit c. €19bn (9% of GNI*)                                                                     income pre-Covid

10%                                                                                        180%
                                                                   Debt-to-GNI*
 5%                                                                                        160%
                                                              (105% 2020; 95% in 2019)
                                                                                           140%
 0%
                                                                                           120%
                                                                Debt-to-GG Revenue
-5%                                                                                        100%
                                                             (258% 2020; 232% in 2019)
-10%                                                                                        80%
                                                                                            60%
-15%                                                           Average interest rate        40%
-20%                                                      (1.8% 2020, from 2.2% in 2019)    20%
       1995 2000 2005 2010 2015 2020                                                         0%
                                                                  Debt-to-GDP                     1995 2000 2005 2010 2015 2020
           GG Balance (% GNI*)
                                                           (58% 2020, from 57% in 2019)
           Primary Balance (% GNI*)                                                                Debt to GNI*     Debt to GDP

                                 Source: CSO, Department of Finance forecasts
                                                                                                                                  4
Medium term economic challenges
Covid recovery, deficit reduction and possible OECD tax reform

 Recovery                                Fiscal                             Tax
   Restrictions have been         Significant stimulus of c.21%       Proposed corporate tax
 eased and vaccine rollout a      of GNI* announced for 2020       reform led by the OECD may
           success                          and 2021                 impact Ireland's growth
                                                                              model
  Timely labour market and         Deficits are necessary but in
    spending data suggest             time public support to         Global minimum tax rate
  recovery began in Q2 and           economy to be reduced         challenges Ireland’s offering
      continues into Q3                                             to multinationals, possibly
                                                                      reducing future growth

                                                                                                   5
NTMA funding range of €18-20bn for 2021
€14.75bn already funded this year
Flexibility >10 years AA-
Ireland has large cash Weighted average maturity Ireland rated in the AA
balances and no of debt one of longest in category with S&P
redemptions until March Europe
2022 Despite Covid impact both
The ECB’s QE programs have Moody’s and DBRS have
In addition to bond funding, enabled NTMA to extend upgraded the outlook for
Ireland received €2.5bn in debt maturities and reduce Ireland to positive
EU Sure funding in Q1 interest cost. highlighting Ireland’s
resilience and fundamentals
6Macro
Rebound in spending and labour
market highlights recovery
7Cases rising on Delta variant
Thankfully severe outcomes like hospitalisation and deaths have been contained
14 day Covid-19 cases/deaths per 100k of population – Delta Ireland case numbers versus other countries (per 100k of
uptick modest so far population)
1,400 25 1,400
1,200 1,200
20
1,000 1,000
800 15 800
600 10 600
400 400
5
200 200
- - -
Cases Deaths (RHS) Ireland Germany US UK
Source: DataStream
8Vaccine rollout has been a success
c. 75% of total population with one dose, 69% fully vaccinated
Rollout progress expected to impact path of Delta variant in Ireland near the top in terms of vaccine rollout in Europe
coming weeks
80% 82% of Portugal
70% population aged Spain
60% Ireland
12+ fully Canada
50% vaccinated Finland
40% Belgium
France
30% Italy
20% UK
Netherlands
10% Germany
0% EU
US
Japan
0 20 40 60 80 100
% of total population fully vaccinated Population: % fully vaccinated
% of total population with at least one dose Population: % one dose
Source: ECDC, DataStream
9Ireland performed relatively well during Covid
GDP growth does not tell the appropriate story, domestic demand gives the best guide
GDP growing very strongly, modified domestic demand has Real MDD down 4.5% in Covid period (versus 2019 levels) –
begun to rebound better than EA average
40% 2%
0%
30%
-2%
20% -4%
-6%
10%
-8%
0% -10%
NL
Denmark
Sweden
Belgium
France
Italy
Finland
S Korea
US
Germany
EA-19
Austria
UK
Ireland
Portugal
Japan
Switzerland
-10%
-20%
2013
2005
2007
2009
2011
2015
2017
2019
2021 Impact on MDD from Covid shock (last six quarters vs
Domestic Demand GDP 2019 level)
Source: CSO, DataStream
Note: MDD for Ireland is modified for multinational activity by Ireland’s Central Statistics Office (CSO). For other 10
countries MDD = Domestic demand = Consumption + Government (current) spending + InvestmentConsumer spending rebounded in Q2
Strong recovery in spending data continues in Q3
Recovery in modified domestic demand in Q2 was driven by Spending continued into Q3: now four straight months of
spending after restrictions eased (y-o-y growth) card spending well in excess of 2019 levels
16% 60%
12%
40%
8%
4% 20%
0% 0%
-4%
-20%
-8%
-12% -40%
Apr-20
Nov-20
Feb-20
Sep-20
Feb-21
Jan-20
Jul-20
Jan-21
Apr-21
Jul-21
Mar-20
Mar-21
Aug-20
Aug-21
May-20
Dec-20
May-21
Jun-20
Oct-20
Jun-21
-16%
2006 2008 2010 2012 2014 2016 2018 2020
Investment Consumption Spending on debit & credit cards (y-o-y change)
Other MFDD Spending on debit & credit cards (versus 2019 average)
Source: CSO, CBI
* Domestic demand series accounts for multinational activity and known as modified final domestic demand 11
(excludes inventories)Sector performance during Covid period
Multinationals strong performance, domestic side hit hard
50%
40% 36%
Domestic sectors hit hard –
30% these has begun to recover
19%
20% as restrictions eased
10% 1% 1%
0%
-10% Two sectors 0%
least impacted -9% -11%
-20%
are dominated -19% -19%
-30% by FDI -26%
-40%
Industry (Incl. ICT Agri, Forest Public Admin, Real Estate Prof, Admin Fin and Construction Dist, Trans, Arts,
Pharma) and Fish Educ & Health and Support Insurance Hotels and Entertainment
Rest
GVA Growth (2020 Q3 to 2021Q2 versus 2019)
Source: CSO
12Labour market improving in recent months
Unemployment rate slowly decreasing as workers fall off income support schemes
Covid-19 adjusted unemployment rate* fell to 12.4% in Those on the pandemic unemployment payment scheme are
August spread across all sectors with focus on retail/hospitality
35 Other Sectors Agri + others
Arts,
7% Construction 1%
entertainment
30 3%
8%
25 Financial &
real estate
20 4% Industry
6%
15 Wholesale &
Health retail trade
10 12.4 4% 16%
5 Education Transport
6.4 4% 4%
0
Public admin Admin
2005
2006
2007
2008
2009
2010
2011
2012
2013
2014
2015
2016
2017
2018
2019
2020
2021
2% services Hotels, Rest
12% 21%
Unemployment Prof, sci, tech
services ICT
Covid-19 Adjusted Unemployment 5% 3%
Source: CSO
* The CSO have estimated this as the upper bound of the unemployment rate. The CSO have urged caution around 13
this data given the likelihood of revisions and the unique nature of employment in the pandemic.Over 40% fall in those on income support
Approx. 460k on income support; down from above 800k in Q1 2021
Those on the PUP has halved since start of 2021; fall in EWSS Supports helped disposable income grow in 2020 more akin
number much more gradual to US than EU
1.2 10%
Millions
1 8%
6%
0.8
4%
0.6
2%
0.4 0%
0.2 -2%
0 -4%
NL
France
Belgium
Denmark
Greece
Italy
EU-27
Australia
Germany
UK
US
Austria
Ireland
EA-19
Canada
Portugal
Spain
Nov-20
Mar-20
Apr-20
Jul-20
Jan-21
Jul-21
Aug-20
Sep-20
Dec-20
Feb-21
Mar-21
Apr-21
Aug-21
May-20
Jun-20
Oct-20
May-21
Jun-21
Wage Subsidy Scheme (TWSS/EWSS) Gross Disposable Household Income (y-o-y change
Pandemic Unemployment Payment 2020)
Source: Revenue, DEASP, CSO, Revenue
14Consumption fell in Q1 but recovering in Q2
Consumption is up 12.6% q-o-q in Q2 2021
Q2 data best since pandemic began, still behind 2019 levels Retail sales numbers starting to rise along with economy re-
opening
30 30% 40%
25 20% 20%
0%
20 10%
-20%
15 0% -40%
10 -10% -60%
5 -20% -80%
-100%
0 -30%
20M11
19M01
19M03
19M05
19M07
19M09
19M11
20M01
20M03
20M05
20M07
20M09
21M01
21M03
21M05
21M07
2008
1998
2000
2002
2004
2006
2010
2012
2014
2016
2018
2020
Consumption Growth (Y-o-Y, RHS) All Retail Food Retail
Consumption (€bns, LHS) Bars Department Stores
Source: CSO
15
Note: RHS charts growth rate versus two years previouslyQ1 investment impacted by lockdown
Construction sector has moved in & out of lockdown but now open since April
Investment hit in Q1 but impact more muted thanks to M+E IP distortions less than in previous quarters – surge in 2020
investment (annual change) likely tax regime related
40% 300
30% 250
20%
10% 200
0%
150
-10%
-20% 100
-30%
-40% 50
1997 2000 2003 2006 2009 2012 2015 2018 2021 0
2004 2006 2008 2010 2012 2014 2016 2018 2020
Investment
Building & Construction Building Investment Other Domestic Inv.
Distortions (mainly IP) Modified GFCF
Investment ex B+C Total GFCF
Source: CSO; NTMA calculations
16
RHS Chart is 4Q sum in Euro billionsHousehold balance sheets improving
Debt levels much lower coming into pandemic + new Covid savings
Gross HH saving rates have jumped in Ireland more than in Legacy of 2008-12 financial crisis is on Government not
most countries due to forced savings/income supports private balance sheets
30 180%
157%
% of Disposable Income (4Q MA)
160%
25 135%
140% 129%
20 120% 109% 105%
100%
15 80% 71% 69% 64%
60% 44% 51%
10 35%
40% 18%
5 20%
0%
0 Household debt SME debt (% of Public debt (% of
2002 2005 2008 2011 2014 2017 2020 (% of GNI*) GNI*) GNI*)
Ireland EA-19 UK 2003 2008 2013 2020
Source: Eurostat, ONS, CSO ; CBI
Note: Gross Savings as calculated by the CSO has tended to be a volatile series, some caution is warranted when interpreting this data
Note: Private debt includes household and Irish-resident enterprises (ex. financial intermediation) 17
CBI quarterly financial accounts data used for household and CSO data for nominal government liabilities.External environment supportive
2021 seeing the global economy rebound given large stimulus & vaccines
2020 2021 Exports driven by demand for multinationals products –
Pharma. and Tech
Maximum Maximum
EA Monetary Policy 50%
accommodative accommodative
40%
EU Fiscal Policy Expansionary Expansionary
30%
Maximum Maximum 20%
US Monetary Policy
accommodative accommodative 10%
0%
US growth Covid-19 shock Rebound
-10%
Oil price
Significantly down
Rising -20%
despite rebound
2018
2000
2002
2004
2006
2008
2010
2012
2014
2016
2020
Covid-19 shock; Brexit Brexit resolved;
UK growth
unresolved Rebound
Exports
Euro Growth Covid-19 shock Rebound
Chemical Products and Computer Services
Strengthening vs.
Euro currency Unclear Exports ex. Chem & Comp
Dollar
Source: NTMA analysis, DataStream, CSO
18Inflation up to 3.1% in Ireland
But likely transitory as with rest of Euro Area
Inflation has ticked up after subdued decade – current rate Philips Curve: Full employment has led to inflation in past but
likely to be transitory a long way from there currently
8 10%
Nominal COE growth per head*
6 8% R² = 0.8
4 6%
2 4%
2% 2020
0 outlier
0%
-2
-2%
-4
-4%
1999
2021
1997
1998
2001
2002
2004
2005
2006
2008
2009
2011
2012
2014
2015
2016
2018
2019 2% 5% 8% 11% 14% 17% 20%
HICP Ireland HICP Euro Area
Unemployment Rate
Source: CSO, NTMA analysis;
19
*Non-Agriculture employment /wage data on yearly basis (1999-2020)OECD’s BEPS process may impact FDI offering
Ireland broadly supportive but reservations remain on Pillar Two
Pillar One: proposal to re-allocate taxing rights on non- Pillar Two: proposal for minimum effective global tax rate
routine profits
Over 130 countries have signed on for the BEPS 2.0 two- Countries will introduce a minimum effective tax rate with
pillar set of reforms. the aim of reducing incentives to shift profits. A rate of “at
least 15%” has been suggested.
The first pillar focuses on proposals that would re-allocate
some taxing rights between jurisdictions where companies Where income is not taxed to the minimum level, there
reside and the markets where user/consumers are based. would a ‘top-up’ to achieve the minimum rate of tax.
Ireland has reservations on the minimum tax rate proposal.
Under such a proposal, a proportion of profits would be re-
allocated from small countries to large countries. Discussions are on-going and should conclude in October.
If the minimum rate agreed is greater than the 12.5% rate
Pillar 1 would reduce Ireland’s corporation tax base. Some
that Ireland levies, it erodes some of Ireland’s comparative
estimates place the hit at up to 20% per annum.
advantage in attracting FDI.
Ireland has been fully supportive of Pillar One despite the Ireland could need to lean on other positives; educated
implied cost to the Exchequer. and young workforce, English speaking, EU access, and
ease of doing business
20Underlying growth robust pre-Covid
MNCs profits ultimately repatriated but growth obvious after adjusting for distortions
Ireland’s income = wages (all sectors) + domestic sectors Pre-Covid, Ireland had a robust underlying economy;
profits + tax on MNC profits compared favourably to EA (2008 = 100)
250
200
Comp of 150
Employee,
MNC 100
29%
Sector
Profits, 50
46%
0
Domestic
Sector
Profits,
MNC Sector Profits Domestic Sector Profits
25%
Compensation of Employee Real GVA ex. MNC Profits
Real GVA - EA19
Source: CSO, NTMA calculations (Nominal 2020 data used in left chart)
21
Ireland’s GVA data has been adjusted to strip out the distortionary effects of some of the multinational activity that
occurs in Ireland. Specifically a profit proxy is estimated for the sectors in which MNCs dominate.Fiscal
Revenues have shown remarkable
resilience; deficit expansion more
spending related
22Fiscal policy response to Covid has been swift
Large deficit expected in 2021 similar to 2020
Response Revenues Debt
Total fiscal response of Ireland’s economic structure Debt ratios have reversed
€43bn over 2020 and 2021 has meant revenues have due to Covid
(c. 21% of GNI*) is large held up despite Covid-19
Ireland has responded to Strength of both Corporate Gross Government debt
Covid with first attempt at and Income tax revenues 57% of GDP at end-2019 but
counter-cyclical fiscal policy from multinational sectors close to 95% of GNI*.
in its 100 year history has helped sustain Ratios were c.59% and
government finances 105% for end-2020
23Ireland fiscal response of c. 21% of GNI*
Highly skewed to direct supports unlike others in EU
Combined 2020/21 Covid-19 fiscal response (% of GDP/GNI*) 2021 General Government Balance: Ireland forecasted above
Euro Area average (% of GDP)
50 0
40 -2
-4
30 -6
20 -8
-10
10 -12
0 -14
-16
NL
France
Italy
Sweden
Norway
Denmark
Belgium
Germany
Finland
Singapore
Australia
UK
US
Ireland
Czech Rep
Korea
Canada
Spain
Japan
Switzerland
New Zealand
Ireland (GNI*)
-18
NL
Italy
Denmark
Belgium
France
Greece
Sweden
Estonia
Bulgaria
Austria
Finland
Germany
Ireland
Lithuania
UK
Slovakia
EA-19
Slovenia
Japan
US
Portugal
Romania
Spain
Ireland (GNI*)
Switzerland
Direct Supports Indirect Supports
Source: IMF, European Commission, Department of Finance
24
Direct supports = Additional spending and forgone revenue. Indirect supports = Equity, loans, and guaranteesFiscal response to Covid is opposite of GFC
Interest bill won’t balloon and investment set to increase
After global financial crisis, Ireland cut capital spending, paid …now revenues are more resilient, spending (incl. inv.)
more interest as taxes fell… increases, interest bill unchanged
30 30
€bns
€bns
25 25
20 GG Capital 20
15 expenditure 15
10 GG Interest 10
5 Costs 5
0 0
GG Expenditure
-5 (underlying) -5
-10 -10
GG Revenue
-15 -15
-20 -20
07 08 09 10 11 12 13 19 20 21f 22f 23f 24f 25f
Source: CSO, Department of Finance forecasts. Charts represent the change in billions for selected fiscal variables versus
2007/2019 levels. Underlying GG expenditure numbers used (excludes banking recapitalisations)
25Covid-19 stimulus hits deficit in 2020/21
After 2021 Ireland plans to narrow its deficit again
Gen. Govt. Balance (% of GNI*) will be in significant deficit in Revenues strong in 2021 so far; income tax in particular is
2020/21 impressive given lockdown
10% 40%
5% 30%
0% 20%
-5% 10%
0%
-10%
2021f
GGB % of GDP -5.1% -10%
-15% GGB % of GNI* -9.4%
-20%
-20% 2021f 2021 vs 2019 (YTD)
2023f
2025f
1995
1997
1999
2001
2003
2005
2007
2009
2011
2013
2015
2017
2019
Income tax VAT Excise duties
GG Balance (% GNI*) Primary Balance (% GNI*) Corporation tax GG Revenue GG Expenditure
Source: CSO; Department of Finance
^ Underlying GG and primary balance numbers used (excludes banking recapitalisations) 26
Corporate tax receipts outsized for now, will likely revert to c. 5-10% above 2019 level by year-endGross Government debt ratios increase
58.5% of GDP at end-2020 and close to 105% of GNI*
180%
160%
140%
120%
100%
80%
60%
40%
20%
0%
1995 1999 2003 2007 2011 2015 2019 2023f
Debt to GNI* Debt to GDP
Source: CSO; Department of Finance 27The “i-g” snowball effect to likely swing back
Low interest rates coupled with reversion to growth may be helpful in coming years
With low rates locked in, Ireland’s “hurdle rate” for a positive Histogram of Ireland’s recent growth history (2001-2020)
snowball effect is low
25% 10
Nominal GNI* grew by
20%
Number of years
8 more than 4% in 14 of last
15% 20 years
10% 6
5% 4
0%
2
-5%
-10% 0
-6-4%
-4-2%
8-10%
12%+Revenues resilient against Covid
CT revenue cushioned by Pharma and ICT; income tax protected by nature of shock
Corporation tax (CT) receipts to plateau after more than Progressiveness of income tax system and sector mix limits
doubling since 2014 hit to overall receipts
25% 15 40%
35%
20% 12
30%
15% 9 25%
10% 6 20%
15%
5% 3 10%
0% - 5%
2021f
1995
1997
1999
2001
2003
2005
2007
2009
2011
2013
2015
2017
2019
0%
Corporation Tax (€bns, RHS)
Corporation Tax (% of tax revenue)
Corporation Tax (% of GG Revenue) % of taxable income cases % of income tax collected
Source: Department of Finance, Revenue, NTMA analysis 29Alternative Debt Metrics
Need to assess other metrics apart from debt to GDP when analysing debt sustainability
2020 GG debt to GG revenue % GG interest to GG rev % GG debt to GDP %
Greece 403.5% 5.9% 205.6%
Italy 326.0% 7.3% 155.8%
Portugal 312.4% 6.7% 133.6%
Cyprus 291.3% 5.3% 118.2%
Spain 290.4% 5.4% 120.0%
UK 259.8% 5.5% 102.1%
Ireland 258.1% 4.4% 58.5% (105% GNI*)
Belgium 225.6% 3.9% 114.1%
France 218.8% 2.5% 115.7%
EA19 213.5% 3.3% 100.0%
Slovenia 185.5% 3.7% 80.8%
EU28 177.2% 3.5% 79.4%
Austria 171.1% 2.7% 83.9%
Germany 148.8% 1.4% 69.8%
Slovakia 144.8% 3.0% 60.6%
Finland 135.0% 1.3% 69.2%
Source: EU Commission
30NTMA Funding
Flexibility in funding strategy due to
smooth maturity profile and no 2021
bond redemptions
31NTMA funding range of €18-20bn for 2021
€14.75bn already funded this year
Flexibility >10 years AA-
Ireland has large cash Weighted average maturity Ireland rated in the AA
balances and no of debt one of longest in category with S&P
redemptions until March Europe
2022 Despite Covid impact both
The ECB’s QE programs have Moody’s and DBRS have
In addition to bond funding, enabled NTMA to extend upgraded the outlook for
Ireland received €2.5bn in debt maturities and reduce Ireland to positive
EU Sure funding in Q1 interest cost. highlighting Ireland’s
resilience and fundamentals
32High level of flexibility in NTMA issuance plans
Helped by smoother maturity profile and no bond redemptions in 2021
20
18
16
14
12
10
8
Billions €
6
4
2
0
Bond (Fixed) EFSM EFSF Bond (Floating Rate) Green Other (incl. SURE)
Source: NTMA
33Near-term redemptions lower than recent past
Lower borrowing costs also provides NTMA with flexibility
NTMA issued €104.5bn MLT debt since 2015; 13.4 yr. Even with extra Covid-19 borrowings, NTMA might not
weighted maturity; avg. rate 0.75% exceed supply in 2017-2020 period
30 5.5 6 80
25 5 70
3.9
20 4 60
2.8
15 3 50
10 1.5 2 40
0.9 1.1 0.9
0.8 30
5 0.2 0.1
1
20 Redemptions
0 0
2012 2013 2014 2015 2016 2017 2018 2019 2020 21 10
YTD 0
Syndication (€bns) Auction
Issuance (2018-2021) Redemptions + est. EBR
Avg. Yield % (RHS) (2022-25)
Source: NTMA, Department of Finance LHS chart showing marketable MLT debt (auctions and syndications). Other
34
issuance such as inflation linked bonds, private placement and amortising bonds occurred but not shown.NTMA has lengthened weighted maturity
Debt management strategy took advantage of QE to extend debt profile since 2015
Various operations have extended the maturity of …Ireland (in years) compares favourably to other EU
Government debt … countries (end-July)
20 12
10
15
8
10 6
11.1 10.7 10.6
4 8.2 8.2 7.9 7.7 7.2
5 7.2 7.0 6.9
2
0 0
2015 2016 2017 2018 2019 2020 2021 AT BG IR ES NL FR DK FN BD IT PT
YTD Govt Debt Securities - Weighted Maturity
Weighted Average Maturity Issued (Years) EA Govt Debt Securities - Avg. Weighted Maturity
Source: NTMA for Ireland data; ECB for other countries
35
Note: Weighted maturity for Ireland includes Fixed rate benchmark bonds, FRNs, Amortising Bonds,
Notes issued under EMTN programme, T-Bills and ECP Data. It excludes programme loans and retail.Funding needs and sources
Various sources of funding will be used to meet Covid-19 borrowing requirements
No bonds mature in 2021. The next bond redemption is €25
not until March 2022. Other: 2
Other: 5
Sure: 2.5
€20 UK Bilateral: 0.5
The Exchequer Borrowing Requirement (EBR) for 2020 was
lower than expected at €12.3bn. Thus, NTMA entered
2021 with a larger cash balance of €17.4bn. €15
Bond
NTMA has received monies from the EU SURE scheme. It is €10 EBR: 18.8 issuance: 20
a diversified source of funding in 2021 (c. €2.5bn).
€5
End year cash balances are currently forecasted at levels
higher than those of end-2020.
Source: NTMA
€-
Funding Requirements (€bn) Sources of Funding (€bn)
Notes:
Rounding may affect totals as some figures have been rounded up to the nearest €bn.
1. The NTMA bond funding range for 2021 is €18-€20bn. While €19bn is reflected as an indicative estimate in the chart, it also includes
cash proceeds from issuance undertaken to end-July.
2. Other funding needs includes provision for the potential bond/FRN purchases and general contingencies.
3. Other funding sources includes retail (State Savings), private placements and EIB loan drawdowns.
4. SURE refers to the European instrument for temporary Support to mitigate Unemployment Risks in an Emergency. 36
5. EBR is the Department of Finance’s SES (July 2021) estimate of the Exchequer Borrowing RequirementECB’s PEPP & PSPP offering strong support
Flexibility (no limits) & size (€1.85trn) of pandemic purchases is noteworthy
6 70
€ Billions
5 60
50
4
40
3
30
2
20
1 10
0 0
Q1 2019
Q1 2015
Q2 2015
Q3 2015
Q4 2015
Q1 2016
Q2 2016
Q3 2016
Q4 2016
Q1 2017
Q2 2017
Q3 2017
Q4 2017
Q1 2018
Q2 2018
Q3 2018
Q4 2018
Q2 2019
Q3 2019
Q4 2019
Q1 2020
Q2 2020
Q3 2020
Q4 2020
Q1 2021
Q2 2021
Q3 2021f
Q4 2021f
PSPP Net IGB purchases (LHS) PEPP/PSPP net purchases (LHS) Cumulative Net ECB Purchases (RHS)
Source: ECB, NTMA Calculations
Notes: Forecasts sees Ireland’s capital key of 1.69% and assumes 90% of new purchases will be for public sector 37
assets with 7% of public sectors assets being supranational issuers.Diverse holders of Irish debt
Sticky sources account for over 55%; will increase further with Eurosystem’s PEPP
Ireland roughly split 80/20 on non-resident versus resident “Sticky” sources - official loans, Eurosystem, retail - make up
holdings (Q4 2020) over 55% of Irish debt
250
200
Other Debt
(incl. Official) 150
22% IGBs - Private
Non Resident 100
32%
Retail, 50
Resident
11% 0
2005
2006
2007
2008
2009
2010
2011
2012
2013
2014
2015
2016
2017
2018
2019
2020
IGBs - Private IGBs - Private Non Resident IGBs - Private Resident
Eurosystem Short term Eurosystem
Resident
25% Short term Retail Other Debt (incl. Official)
6%
4% Total Debt (€bns)
Source: CSO, Eurostat, CBI, ECB, NTMA Analysis
IGBs excludes those held by Eurosystem. Eurosystem holdings include SMP, PSPP, PEPP and CBI holdings of FRNs. Figures do not
include ANFA. Other debt has included IMF, EFSF, EFSM, Bilateral as well as IBRC-related liabilities over time. Retail includes 38
State Savings and other currency and deposits. The CSO series has been altered to exclude the impact of IBRC on the data.Investor base
Demand for Government bonds is wide and varied
Country breakdown: Investor breakdown:
Average over last five syndications Average over last five syndications
8.8% 10.0%
14.6%
11.8% 31.6%
24.0%
42.4% 7.2%
46.6%
Ireland UK
US and Canada Continental Europe Fund/Asset Manager Banks/Central Banks*
Nordics Asia & Other Pensions/Insurance Other
Source: NTMA
39
* Does not include ECB. ECB does not participate on primary market under its various asset purchasing programmesCredit Rating for Ireland
Ireland rated in “AA” category by Standard & Poor's
Outlook/ Date of last Date of next
Rating Agency Long-term Short-term
Trend change review
Standard & Poor's AA- A-1+ Stable Nov 2019 Nov 2021
Fitch Ratings A+ F1+ Stable Dec 2017 2022
Moody's A2 P-1 Positive Aug 2021 2022
DBRS Morningstar A(high) R-1 (middle) Positive July 2021 2022
R&I A+ a-1 Stable Jan. 2021 2022
KBRA AA- K1+ Stable Jan. 2020 Dec 2021
Scope AA- S-1+ Stable May 2021 Nov 2021
40ESG Sustainability
Issuance & government policy
demonstrate Ireland’s green commitment
41Ireland’s Greenhouse Gas emissions
State of Play
Ireland’s emissions fell post financial crisis – Covid likely Emissions from agriculture make up a more significant
meant they fell again in 2020 portion of total In Ireland (c. 10% in EU or US)
80
Energy
60 Industries Waste
16% 2%
40 Agriculture
35%
Residential
20 11%
Manuf.
0 Combustion
2004
1990
1992
1994
1996
1998
2000
2002
2006
2008
2010
2012
2014
2016
2018
Commercial
F-gases 8%
Services
2%
Other Transport 1%
Industrial Processes Manufacturing Combustion Industrial Transport Public
Residential Energy Industries Processes 20% Services
Agriculture Total GHG emissions 4% 1%
Source: Environment Protection Agency (Ireland)
42
Note: Metric used is million tonnes carbon dioxide equivalent (Mt CO2eq))Close to OECD average on progress
But behind some of the leaders in Europe
Ireland similar to OECD but behind others when considering Ireland compares well to the OECD average
intensity metrics
GHG OECD CO2 OECD % 0.0
OECD
emissions Ranking (1st emissions Ranking (1st Renewable
Ranking (1st
per unit of = High per unit of = High energy
is desirable) 0.5
GDP Intensity) GDP Intensity) supply
Ireland 0.2 30 0.09 35 11.1 24
1.0
Ire (GNI*) 0.3 11 0.14 24
OECD 0.3 n/a 0.14 n/a 1.5
Australia 0.5 2 0.32 2 7.1 35
Belgium 0.2 19 0.17 14 7.8 32 2.0
Canada 0.5 4 0.34 1 16.4 18
France 0.2 33 0.10 34 10.7 26 2.5
Germany 0.2 23 0.16 17 14.6 21
Italy 0.2 28 0.13 27 18.2 16 3.0
NL 0.2 25 0.16 17 7.2 34 Water Sustainable Climate Oceans Biodiversity
UK 0.2 32 0.12 30 12.5 23
Production
Spain 0.2 27 0.13 27 14.7 20
US 0.4 6 0.24 6 7.9 31
Ireland OECD
Source: OECD, EPA
RHS shows the average distance the country needs to travel to reach each SDG. 0 indicates that the level for 2030
has already been attained: and 3 is the distance most OECD countries have already travelled. Bars show the average 43
country performance against all targets under the relevant GoalIreland in top 20 most sustainable countries
Ireland rated highly by Sustainalytics and rating agencies on ESG
Ireland ranks 17th globally by Sustainalytics for ESG risk Moody’s view on Ireland much like other agencies – strong
governance a key risk mitigant
18
“For an issuer CIS-1 (Positive), its ESG
16
14 attributes are overall considered as having a
12
positive impact on the rating. The overall
10
8 influence… … is material”.
6
4
2
0
Germany
Qatar
Norway
Sweden
Denmark
Finland
Hong Kong
Singapore
Australia
Austria
Netherlands
Brunei
United States
Canada
Japan
Luxembourg
Switzerland
New Zealand
Iceland
Ireland
Ireland’s ESG Credit Impact Score:
“low exposure to environmental risk”
“a positive influence of its social considerations”
“very strong governance profile”
Source: Sustainalytics, Moody’s
44
Note: Sustainalytics score is out of 100, closer to zero means less ESG riskClimate Action Legislation
The Climate Action & Low Carbon Development Bill 2021 supports transition to Net Zero by 2050
• Carbon Budgeting: The Bill embeds the process of carbon budgeting into law. It requires
Government to adopt a series of economy-wide-five-year carbon budgets. 80
• Sectoral Action Plans: Actions for each sector will be detailed in the Climate Action Plan, 60
updated annually.
40
• Climate Action Strategy: A national plan will be prepared every five years.
20
• Legally binding targets: Govt. Ministers responsible for achieving targets for their sector.
0
1990
1994
1998
2002
2006
2010
2014
2018
2022
2026
2030
• 51% reduction: First carbon budgets will aim for a reduction of 51% of emissions by 2030.
• All of Government approach: Local Authorities is required to prepare a Climate Action GHG emissions ((Mt CO2eq)))
Plan and public bodies obliged to conduct their functions in line with the national plan.
Implementing 2019 Climate Action Plan
• Gas Exploration: Government approved draft amendments to end the issuance of new Without legislated measures
licenses for the exploration and extraction of gas. Climate Bill 2021 commitment
Source: Department of the Environment, Climate and Communications, EPA, NTMA Economics analysis
45Irish Sovereign Green Bonds (ISGB)
Cumulative €6.3bn allocated to green projects following third year
• €6.1bn nominal outstanding (€6.5bn cash equivalent) • Launched 2018 and based on ICMA Green Bond Principles –
• Circa €200mn remains to be allocated to eligible Use of proceeds model
expenditure in 2021 • Governed by a Working Group of government departments
and managed by the NTMA
• Issuance through two syndicated sales and one auction
• Compliance reviews by Sustainalytics
• Pipeline for eligible green expenditure remains strong Top 10 Issuers Amount Outstanding
% of Total Debt
Globally (US$bn equiv.)
• The Climate Action and Low Carbon Development France 42 1.4%
Germany 21 0.8%
(Amendment) Bill 2021 will support Ireland’s transition to
Belgium 13 2.1%
Net Zero Netherlands 12 2.3%
Chile 12
• ISGB 2020 Allocation Report Italy 10 0.3%
Indonesia 8
• ISGB 2019 Impact Report Ireland 7 2.7%
Hong Kong 7
Sweden 5 0.2%
Source: Bank of America, bonddata.org
46Irish Sovereign Green Bonds (ISGB)
Allocation of ISGB funding has focused on Water/Waste management and transportation
Built
€3,000 Sustainable water
Environm
and wastewater
ent/
€2,500 management
energy
30%
efficiency
€2,000 5%
€1,500
€1,000
€500 Clean
transport
€0 ation
Allocation €million Mgmt of 54%
natural
resources 8% Climate change
Tidal defences and public space enhancement; Clonakilty adaptation 3%
2017/8 2019 2020
Flood Relief Scheme
47Irish Sovereign Green Bonds (ISGB)
Irish Sovereign Green Bond Impact Report 2019: sample impacts
Some highlights from Report*
• Built Environment/ Energy Efficiency
• Energy saving (GigaWattHours) : 621.06
• Number of homes renovated : 24,777
• EV home charger grants provided: 2,548
• Clean Transportation
• Number of public transport passenger journeys : 294.6
million
• Greenway users: 1,196,428**
• Take-up of Grant Schemes/ Tax foregone provided
(number of vehicles) : 24,122
• Climate Change Adaptation
• 13 major Flood relief projects at planning, development
or construction phase.
• 6,685 properties protected on completion Rediscovery Centre Ballymun; A-rated retrofitted sustainability and reuse centre
*For a more detailed break-down please see the ISGB 2019 Impact Report
** Raw count from 3 longest Greenways- Waterford, Old Rail Trail, Royal Canal 48
GreenwayIrish Sovereign Green Bonds (ISGB)
Irish Sovereign Green Bond Impact Report 2019: sample impacts cont.
Some highlights from Report*
Environmentally Sustainable Management of Living Natural
Resources and Land Use
Number of hectares of forest planted : 3,550
Number of Landfill Remediation projects being funded: 76
Renewable Energy
Number of companies (including public sector organisations)
benefitting from SEAI Research & Innovation programmes as lead,
partner or active collaborators : 36
SEAI Research & Innovation awards: 46
Sustainable water and wastewater management
Water savings (litres of water per day) : 160 million
New and upgraded water and wastewater treatment plants : 14
Length of water main laid (total) : 393km
Irish peatlands; Clara Boardwalk
*For a more detailed break-down please see the ISGB 2019 Impact Report 49Ireland compares well to OECD on “S&G”
Based on the 17 Sustainability and Development Goals of the UN
0.0
0.5
1.0
1.5
2.0
2.5
3.0
Poverty
Cities
Climate
Oceans
Energy
equality
Economy
Inequality
Water
Biodiversity
Institutions
Food
Health
Infrastructure
Education
Implementation
Sus. production
Gender
Ireland OECD
Source: OECD (2019)
Each bar shows “distance” country needs to travel to reach each SDG. Distances are measured in standardised units
with 0 indicating that the level for 2030 has already been attained: and 3 is the distance most OECD countries have
already travelled. Bars show the average country performance against all targets under the relevant Goal for which 50
data are available, and diamonds show the OECD average.NTMA Best Practice
NTMA aiming to be a domestic leader in ESG
NTMA-wide ISIF
• Objective of making the NTMA the most sustainable • Goal to reduce carbon intensity of the global portfolio by
public service workplace in Ireland - Strategy goal of 50% by 2025.
becoming an environmentally sustainable and net zero • In the Irish portfolio the strategy is two-fold;
emissions organisation by 2030.
• help Ireland meet its emissions targets by 2030 by
• Our office building has achieved an A3 BER rating and investing in sustainable infrastructure
LEED Platinum certification.
• achieve Net Zero by 2050 or earlier by investing in new
• Working on collating agency wide data as we seek to technologies and business models that will underpin
baseline our current emissions ahead of delivering Net this transition
Zero commitment
NDFA
• Established a NTMA Sustainability Group which supports
• Advising State Authorities on a number of climate related
the delivery of climate initiatives across the NTMAs
capital projects
mandates and drives the NTMA’s Climate Action Strategy.
New Era
• Continues to progress a Climate Framework for the
commercial semi-states
51Structure of the Irish
Economy
Multinationals distort the “true”
economic picture but have added
resilience during Covid-19
52Multinational activity distorts Ireland’s data
Notwithstanding those issues, MNCs have real positive impact
Multinationals dominate GVA: profits are booked here but Domestic side of economy adds jobs; MNCs add GVA/high
overstate Irish wealth generation wages
Arts & Other Share of Share of Share of Gross Weekly
1% Employment Wage Bill GVA Earnings €
Professional (2020) (2019) (2020) (Q4 2019)
Public
services Agriculture 4.5% 1% 1% N/A
sector
10% 11% Industry (incl. 12.2% 15% 38% 916
Pharma.)
Industry 6.2% 4% 2% 821
Real estate (incl. Construction
6% Pharma) Dist., Tran,
25.4% 17% 9% 571
38% Hotel & Rest
Financial & ICT (Tech) 5.4% 9% 17% 1,241
insurance Financial 4.5% 8% 4% 1,235
4% Real Estate 0.4% 1% 6% 730
Dist, tran, Professional 10.8% 13% 10% 810
hotel & rest ICT (Tech)
18% 25.6% 30% 11% 836
9% Public Sector
Arts & Other 5% 2% 1% 514
Source: CSO
53
2020 Nominal GVA used€0.5trn of intellectual property into Ireland
Assets brought here by tech. & pharma. in recent years
Ireland is now a leader in Computer Services; Exports have Enormous inflows (c. €0.5trn) of IP assets into Ireland since
trebled since 2014 2015 on the back of BEPS reforms
120 16.0% 300
€billions, Constant prices
100 250
12.0%
80
200
60 8.0%
40 150
4.0%
20 100
0 0.0%
50
2005
2006
2007
2008
2009
2010
2011
2012
2013
2014
2015
2016
2017
2018
2019
0
Computer Services Exports (€bn) 1995-2014 2015 2016-19
Chemical Products (€bn)
% of World Computer Services Exports (RHS) 2015 once-off IP assets increase estimate
% of World Chemical Products Exports (RHS) Fixed Capital Investment - IP assets
Source: IMF, UN Comtrade, CSO, NTMA Economics Calculations
54Ireland has navigated global economy
Ireland has moved with trends this century (even after adjusting GVA)
Euro Area manufacturing base hollowed out over time: The digitalisation of the economy: Ireland able to grow its
Ireland less impacted than most tech sector in recent years
2 3
0 2.5
-2 2
-4 1.5
-6 1
-8 0.5
-10 0
-12 -0.5
-14 -1
EA 19
EA 19
Finland
Portugal
Portugal
Finland
Latvia
Estonia
Latvia
Estonia
Netherlands
Netherlands
Belgium
Austria
Spain
France
Cyprus
Greece
Greece
Spain
France
Belgium
Luxembourg
Germany
Ireland*
Lithuania
Cyprus
Germany
Luxembourg
Ireland*
Italy
Lithuania
Italy
Austria
Malta
Slovenia
Slovakia
Slovenia
Slovakia
Malta
Manufacturing GVA: pp change in share of economy Tech Sector GVA: pp change in share of economy
since 1999 since 1999
Source: Eurostat, NTMA calculations (1999-2019 data)
* Ireland’s GVA data has been adjusted to strip out the distortionary effects of some of the multinationals activity. A
profit proxy is removed from the GVA data for the sectors in which MNCs dominate (parts of Manufacturing, ICT, 55
and renting and leasing services). Unadjusted Ireland’s figures are +7.1pp (manufacturing) and +6.5pp (tech sector).Underlying economy was robust pre-Covid
MNCs add real substance to IE economy
Ireland’s income = wages (all sectors) + domestic sectors Pre-Covid, Ireland had a robust underlying economy;
profits + tax on MNC profits compared favourably to EA (2008 = 100)
250
200
Comp of 150
Employee,
MNC
€101bn , 100
Sector
29%
GOS, 50
€165bn ,
Domestic
46% 0
Sector
Profits,
€87bn ,
MNC Sector Profits Domestic Sector Profits
25%
Compensation of Employee Real GVA ex. MNC Profits
Real GVA - EA19
Source: CSO, NTMA calculations (Nominal 2020 data used in left chart)
Ireland’s GVA data has been adjusted to strip out the distortionary effects of some of the multinational activity that 56
occurs in Ireland. Specifically a profit proxy is estimated for the sectors in which MNCs dominate.High value MNC activity adds to tax base
Ireland revenue less impacted by Covid
GDP overstates Ireland’s progress but is still a good Multinational sectors critical for Income tax and Corporation
barometer for Revenue, in particular CT and IT tax (2020 data)
30% 100%
20%
10% 80%
0%
60%
-10%
-20% 40%
-30%
Real Estate
Prof, Admin
Construction
Industry
ICT
Fin & Ins.
Agri, For, Fish
Dist, Trans, Hotels &
20%
Public
Arts, Entertainment
0%
Rest
VAT PAYE CT Three taxes
Manufacturing (incl. Pharma) ICT (tech sector)combined
Admin (incl. Aircraft Leasing) Fin & Ins.
% of CT, PAYE, VAT y-o-y change in GVA (2020) Other Sectors
Source: CSO, Revenue, NTMA Calculations
Elasticity based on 1995-2019 data. E = (annual % change in tax)/(annual % change in growth variable 57Ireland’s population helps growth potential
Age profile younger than the EU average
Ireland’s population estimated at 5.01m in 2021: younger Ireland’s population will remain younger than most of its EA
population than EU counterparts
70% Japan
Greece
60% Portugal
Italy
50% Spain
Germany
Finland
40% France
Denmark
30% Ireland
UK
Belgium
20% China
Canada
10% Sweden
USA
0% WorldMigration improves Ireland’s human capital
Ireland’s net migration has swung back and forth on economic performance
Latest Census data show net migration positive since 2015 – Migration inflow particularly strong in highly educated cohort
recent slowdown due to Covid – work in MNCs attractive
150 40
30
100
20
50
10
0 0
-50 -10
-20
-100
-30
1987
1989
1991
1993
1995
1997
1999
2001
2003
2005
2007
2009
2011
2013
2015
2017
2019
2021
Third level Other Education Net Migration
Immigration Emigration Net Migration 2009-2013 annual average 2015-2021
Source: CSO
59Income equality has improved
Ireland’s progressive system the main driver and cushioned the economy in 2020
Lower inequality (1985-2015): economic rise reduced GINI Progressive system means Ireland is around the OECD
coefficient unlike others average for GINI after tax
0.06 0.8 Lower GINI score means
0.7 more equal societyc
0.04 0.6
0.02 0.5
0.4
0.00 0.3
-0.02 0.2
0.1
-0.04 0
Iceland
Australia
Greece
Latvia
Korea
Lithuania
USA
Slovakia
Sweden
Austria
Hungary
Poland
Luxembourg
Canada
Italy
Portugal
Israel
Turkey
South Africa
Finland
Belgium
Russia
Mexico
Czech Rep
Denmark
France
Switzerland
Estonia
Slovenia
Netherlands
Germany
Ireland
Spain
UK
Chile
Costa Rica
Norway
Japan
-0.06
-0.08
Belgium
Portugal
Ireland
Denmark
USA
Canada
Japan
Netherlands
UK
France
Greece
Norway
Luxembourg
Sweden
Spain
Germany
Finland
Italy
Austria
Switzerland
Pre Taxes and Transfers
GINI Coefficient (Post Taxes and Transfers)
Source: IMF, OECD
60Brexit
“Hard Brexit” risk eliminated by free
trade agreement leaving smaller long
term impact
61Brexit - Free Trade Agreement reached
Allows for tariff free trade but non-tariff barriers will increase
Main points of FTA
• From January 1 2021, the UK became a “third country” outside the EU’s single market and customs union. As such without a
free trade agreement, trade would be subject to tariffs and quotas.
• Under the deal, goods trade between the two blocs will remain free of tariffs.
• However, goods moving between the UK and the EU will be subject to customs and other controls, and extra paperwork is
expected to cause disruptions.
• Due to these non-tariff barriers, Brexit will likely result in less trade.
• Under the deal, services trade between the two blocs will continue but again could be hampered.
• The Agreement provides for a significant level of openness for trade in services and investment.
• But providing services could be hampered. For example, UK service suppliers no longer have a “passporting” right,
something crucial for financial services. They may need to establish themselves in the EU to continue operating.
• The deal means less cooperation in certain areas compared to before Brexit. Financial and business services are only included
to a small extent. Cooperation on foreign policy, security and defence will be lower also.
• Brexit is likely to result in less trade in the long run between the EU and the UK but the deal does avoid the worst case
scenarios: Hard Brexit has been averted and the economic impact to Ireland will be more modest.
62Withdrawal Agreement signed in 2019
Northern Ireland protocol within Withdrawal Agreement resolves many of the land border issues
• The withdrawal agreement is a legally binding international
treaty which works in tandem with the free trade agreement.
• Northern Ireland will remain within the UK Customs Union but
will abide by EU Customs Union rules – dual membership for NI.
• No hard border on the island of Ireland: the customs border will
be “in the Irish sea”. Goods crossing from Republic of Ireland to
Northern Ireland will not require checks, but goods that are
continuing on to the UK mainland will.
• Complex arrangements will be necessary to differentiate
between goods going to NI and those travelling through NI to UK
or vice versa. Customs checks at ports, VAT and tariff rebates
and alignment of regulations will be needed.
63Impact of Brexit on Ireland likely net negative
Deal means the shock is smaller & spread over longer horizon
Modelled impact on output versus No Brexit baseline: FTA IE trading partners: UK important for good imports (land
reduces impact significantly bridge) & services exports
0 % of Goods Services Total
total (2019) (2019) (2019)
-1
Exp. Imp. Exp. Imp. Exp. Imp.
-2
-3 US 30.8 15.5 15.8 18.6 21.9 17.9
-4 UK (ex
8.9 20.6 15.8 6.9 13.5 10.6
NI)
-5
NI 1.4 1.9 n/a n/a n/a n/a
-6
EU-27 37.1 36.7 29.8 19.8 32.8 23.8
-7
2020 2021 2022 2023 2024 2025
China 5.9 5.8 2.8 1.3 4.0 2.3
FTA WTO Disorderly No-Deal
Other 15.9 19.4 35.9 53.4 27.8 45.5
Source: CBI, NTMA analysis
64Trading flows are changing after FTA
NI imports and exports have jumped in H1 2021
NI trading route more important than ever for IE-UK trade – UK exit from single market will continue trend of lower goods
special trade status of NI a factor trade between IE & UK
30.0% 60%
NI share of total Irish
25.0% trade has jumped but 50%
remains c. 3%
20.0% 40%
15.0% 30%
10.0% 20%
5.0% 10%
0.0% 0%
2003
2001
2002
2004
2006
2007
2008
2009
2011
2012
2013
2014
2016
2017
2018
2019
2021
1977
1980
1983
1986
1989
1992
1995
1998
2001
2004
2007
2010
2013
2016
2019
Exports to NI (% of exports to UK) % of Irish agri exports going to UK
Imports from NI (% of imports from UK) % of other Irish goods exports going to UK
Source: CSO
65Possible benefit: FDI inflows into Ireland
Service suppliers in UK may need to re-establish in EU
FDI: Ireland benefitting already Companies that have indicated jobs have or will be moved to
Ireland
Ireland could be a beneficiary from displaced FDI. The chief
areas of interest are
• Financial services
• Business services
• IT/ new media.
Dublin is primarily competing with Frankfurt, Paris,
Luxembourg and Amsterdam for financial services.
The UK (City of London) has lost significant degree of
access to EU market so there may be more opportunities
in time.
2019 figures from the IDA have shown that at least 70
investments into Ireland have been approved since the
announcement of Brexit.
66Property
Price gains in 2021 brought about by a
lack of supply and unchanged demand
67With supply hampered, prices have risen
House prices plateaued before the virus hit but since have increased
House prices 12% off previous peak in 2007 but up 6.9% Transactions have begun to increase again after Covid
year-on-year lockdowns
110 80000 50%
100 70000 40%
90 60000 30%
50000
80 20%
40000
70 10%
30000
20000 0%
60
10000 -10%
50
0 -20%
40
Q1 2011
Q4 2011
Q3 2012
Q2 2013
Q1 2014
Q4 2014
Q3 2015
Q2 2016
Q1 2017
Q4 2017
Q3 2018
Q2 2019
Q1 2020
Q4 2020
30
2015
2005
2006
2007
2008
2009
2010
2011
2012
2013
2014
2016
2017
2018
2019
2020
National Excl. Dublin Dublin 4Q Sum of Transactions Y-o-Y Change (RHS)
Source: CSO;
68Covid-19 impacted supply for 2020 and 2021
Q1 supply impacted by lockdown
Housing Completions* close to 25,000 in 2020; 20,000+ in Covid hampering supply for 2020-21 but recent housing
new dwelling completions in 2021 starts show supply is responding
30000 30000
25000 25000
20000 20000
15000
15000
10000
10000
5000
5000
0
2015 2016 2017 2018 2019 2020 2021f 0
New dwelling completion Unfinished 2017 2018 2019 2020 2021 2022
Reconnection Non-Domestic Starts (advanced 12 months)
All connections Completions (new dwellings)
Source: DoHPCLG, CSO, NTMA Calculations
* Housing completions derived from electrical grid connection data for a property. Reconnections of old houses or
connections from “ghost estates” overstate the annual run rate of new building. 69
**2021 completions forecasted down 10-20% on 2020 based on market estimatesUnderlying supply demand mismatch
Housing supply still well below demand – est. need at least 33K units a year
12 Average annual New Dwelling
Thousands of housing units
10 housing demand Completions (last four
(2020-2030) quarters)
8
6
4 State 33.6 19.7
2
0
GDA 17.2 10.5
Ex-GDA 16.5 9.2
Average annual housing demand (2020-2030)
New Dwelling Completions (last four quarters) Greater Dublin Area (Dublin + Mid East) requires the
majority of needed dwellings.
Source: CSO; NTMA analysis 70Mortgage drawdowns affected by Covid
Restrictions impacted drawdowns but have begun to increase since initial trough
Mortgage drawdowns* (000s) rose in recent quarters after Non-mortgage transactions still important – c.40% of all
Covid-19 impact transactions
120 25 80%
Thousands
100 20 60%
80 15
60 40%
10
40 20%
5
20
0 0%
0
2011
2012
2013
2014
2015
2016
2017
2018
2019
2020
2021
2006 2008 2010 2012 2014 2016 2018 2020
Residential Investment Letting Non-mortgage transactions
Mover purchaser Mortgage drawdowns for house purchase
First Time Buyers Non-mortgage transactions % of total (RHS)
Source: BPFI; CSO
71
*4 quarter sum used (LHS)Covid-19 impact on prices coming through
Inflation starting to show and rents pressure back
House prices up 6.9% in the year to June 2021 Rents pressures returning after initial Covid related softening
30% 180
Rents now well
160
20% above prices
140
10% 120
0% 100
80
-10%
60
-20% 40
20
-30%
0
2005 2007 2009 2011 2013 2015 2017 2019
2005
2006
2007
2008
2009
2010
2011
2012
2013
2014
2015
2016
2017
2018
2019
2020
2021
National (Y-o-Y %) Ex Dublin (Y-o-Y %)
Dublin (Y-o-Y %) Rents (100 = 2005) Price
Source: CSO; RTB 72Price valuation metrics well below 2008 level
Deviation from average price-to-income ratio (2020, red dot represent Q1 2008)
60%
40%
20%
0%
-20%
SD LX NL BG OE DN NW FR UK EA ES PT IE BD GR FN IT
Deviation from average price-to-rent ratio (2020, red dot represent Q1 2008)
100%
50%
0%
-50%
SD NW BG UK LX DN FR NL ES IE OE EA FN BD PT GR IT
Source: OECD, NTMA Workings
Note: Measured as % over or under valuation relative to long term averages since 1980.
73Banks & other
Ireland’s banks among best capitalised in
Europe – complete reverse of late 2000s
74Ireland’s Banking Sector Overview
Less competition possible
• Banks profitable before Covid-19: income, cost and balance sheet metrics much improved.
• Covid impact on asset quality has been muted so far – will need to see how market sits after fiscal policy fades
• Ulster Bank and KBC - both of which have no govt. ownership have decided to leave Irish banking market. Reduced competition
is main impact.
• The Irish government intends to sell part of its 13.9% share in BOI over rest of 2021. The pace of shares sold will depend on
market conditions. Shares are not to be sold below a certain level. Will leave just AIB and PTSB with government involvement.
• An IPO of AIB stock (28.8%) occurred in June 2017. This returned c. €3.4bn to the Irish Exchequer. It was used for debt reduction.
Net Interest Margin Profit before Tax
3.0% 2
2.0% 1
1.0% 0
AIB BOI PTSB
0.0% -1
AIB BOI PTSB -2
2017 2018 2019 2020 2021 H1 2017 2018 2019 2020 2021 H1
Source: Annual reports of banks - BOI, AIB, PTSB 75Capital ratios strengthened in last 10 years
Bank’s balance sheets contracted and consolidated since GFC
CET 1 capital ratios allow for ample forbearance in 2021/22 Loan-to-deposit ratios have fallen significantly as loan books
were slashed
25% 200
20% 150
15% 100
10% 50
19.3% 17.4%
15.3% 16.4%
14.1% 15.3% -
5%
Loan-to- Loans (€bn) Loan-to- Loans (€bn)
Deposit % Deposit %
0%
CET1 % (Transitional) CET1 % (Fully Loaded) AIB BOI
AIB BOI PTSB Dec-10 Dec-20
Source: Published bank accounts
76
Note: “Fully loaded” CET1 ratios used. Refers to the actual Basel III basis for CET1 ratios.Mortgage arrears have not reversed course
We will know more on asset quality as economy fully re-opens
Mortgage arrears (90+ days) have steadily declined with no Principal Dwelling Mortgage arrears (thousands)
noticeable Covid impact
20% 12.0
8.0
15%
4.0
0.0
10%
-4.0
5% -8.0
10 11 12 13 14 15 16 17 18 19 20 21
0%
13 14 15 16 17 18 19 20 21 Over 90 days 90-180 days 181-360 days
PDH + BTL (by balance) PDH + BTL (by number) 361-720 days >720 days Total change
Source: CBI
77Commission’s ruling on Apple annulled
Further appeal by EC means case continues
• In 2016, the European Commission had ruled that Ireland illegally provided State aid of up to €13bn, plus interest to Apple.
This figure is based on the tax foregone as a result of a historic provision in Ireland’s tax code. The Irish Government closed
this provision on December 31st 2014.
• Apple appealed the ruling, as did the Irish Government. The General Court granted the appeal in July 2020, annulling the
EC’s ruling.
• This case had nothing to do with Ireland’s corporate tax rate. It related to whether Ireland gave unfair advantage to Apple
with its tax dealings. The General Court has judged no such advantage occurred.
• The Commission has decided to appeal to a higher court: the European Court of Justice. This process could still be lengthy.
Pending the outcome of the second appeal, the €13bn plus EU interest will remain in an escrow fund.
• The NTMA has made no allowance for these funds in any of its planning throughout the whole process. There is no need to
adjust funding plans given the decision by the General Court or by the Commission’s decision to appeal.
78Disclaimer
The information in this presentation is issued by the National Treasury Management Agency (NTMA) for
informational purposes. The contents of the presentation do not constitute investment advice and should not be
read as such. The presentation does not constitute and is not an invitation or offer to buy or sell securities.
The NTMA makes no warranty, express or implied, nor assumes any liability or responsibility for the accuracy,
correctness, completeness, availability, fitness for purpose or use of any information that is available in this
presentation nor represents that its use would not infringe other proprietary rights. The information contained in
this presentation speaks only as of the particular date or dates included in the accompanying slides. The NTMA
undertakes no obligation to, and disclaims any duty to, update any of the information provided. Nothing contained
in this presentation is, or may be relied on as a promise or representation (past or future) of the Irish State or the
NTMA.
The contents of this presentation should not be construed as legal, business or tax advice.
79You can also read