Retail - Colliers International
←
→
Page content transcription
If your browser does not render page correctly, please read the page content below
C A P I TA L M A R K E T S AU S T R A L I A &
N E W ZE A L A N D I N V ES T M E N T R E V I E W
YE AR I N R E V I E W AND OUTLOOK 2020

Retail

                                Accelerating success.
RETAIL INVESTMENT REVIEW | ANZ Introduction Key Findings Major Transaction Overview NZ Overview Debt Advisory Thought Leadership Detailed Transaction List Authors / Team A CAPITAL MARKETS PUBLICATION | 2
Introduction
R E TA I L I N V ESTMENT IN AUST RAL I A
Against the backdrop of changing consumer preferences, Australian retail property assets remain well sought after with $6.84 billion trading in 2019,
underpinned by domestic and offshore groups who continue to see value in the sector. Despite the continued growth of online retail, brick-and-mortar stores
remain an essential part of the retail landscape and continue to evolve to meet consumer expectations. For landlords, this has meant a narrowed focus on
$6.84bn
Retail assets trading in 2019
optimising their tenancy mix and as a result we are seeing shopping centres becoming more service based to meet the needs of the local catchment.
Despite selective demand, retail investment volumes
were constrained by fewer assets being brought to
market with a 10 per cent fall in the number of assets
sold in 2019 when compared to 2018. Given this, high
quality centres with strong catchments and solid trading
metrics continue to be the key focus of both domestic
and offshore capital. Similarly, domestic institutions have
progressively reweighted their portfolios and disposed of
selected non-core assets. This environment has created
opportunities for proactive investors willing to undertake
refurbishment works to reposition centres. Private and
Offshore purchasers have recognised these opportunities
in an oversold market and have increased their investment
activity, purchasing from Institutional investors who have
been generally looking to rebalance their portfolios.
By number, Neighbourhood shopping centres remain the
most active sub-sector with 42 sales recorded in 2019.
With volumes totalling $1.49 billion for the year, demand
for Neighbourhood centres continues to stem from
a high exposure to non-discretionary stores while the
average price point of approximately $35.4 million
remains affordable to a broader range of investors.
Regional centres accounted for the largest share of
investment volumes in 2019 with $1.82 billion trading.
This results from the sale of 50 per cent stakes in
Westfield Marion ($670 million), Westfield Burwood
($575 million) and Garden City Booragoon ($575 million).
Investment volumes for Sub‑Regional centres more than
halved in 2019 with just over $1.18 billion being sold over
the year, supported by the sale of Noosa Civic ($235 million)
which represented one-fifth of investment in the sub -sector.
Notwithstanding headwinds impacting the sector,
underscored by shifting consumer sentiment and low
wages growth, demand for Australian retail property
is expected to remain strong in 2020 with a significant
weight of capital looking for opportunities in the market.
We hope you find this publication useful and look forward
to engaging with you further on the Australian retail
Central Park Mall
investment market.
t
RETAIL INVESTMENT REVIEW | ANZ            Introduction Key Findings   Major Transaction Overview NZ Overview Debt Advisory Thought Leadership   Detailed Transaction List Authors / Team                                             A CAPITAL MARKETS PUBLICATION | 3

Key Findings
R E TA I L PROPERT Y SALES

R E TA I L P R O P ER T Y S A L ES TOTA L VA LUE                                                                                 R E TA I L P R O P E R T Y S A L ES BY SUB-SEC TOR

        10 (Billion $AUD)                                                                                                                10 (Billion $AUD)

                                                                                                   9.39
        8                                                                                                                                8
                                                                             8.45                          8.25
                                             7.50                 7.29
                                                        7.22                           7.22
        6                                                                                                            6.84                6

        4                                                                                                                                4

                            3.33   3.51
                   2.87
        2                                                                                                                                2

        0                                                                                                                                0
                  2009      2010   2011      2012       2013      2014       2015      2016        2017    2018      2019                       2009        2010      2011       2012        2013      2014          2015     2016     2017     2018     2019
                                                                                                                                             Sub Regional      Regional      Neighbourhood     Large Format Retail      CBD      Freestanding   Other

        A total of $6.84 billion in retail assets transacted in Australia in                                                             Regional centre sales accounted for the largest dollar share of the
        2019. This is down 19 per cent YoY and represents the lowest total                                                               retail investment market with $1.82 billion of centres trading in 2019 -
        transaction value for the retail investment market since 2011.                                                                   down 6 per cent YoY.

                                                                                               t
RETAIL INVESTMENT REVIEW | ANZ Introduction Key Findings Major Transaction Overview NZ Overview Debt Advisory Thought Leadership Detailed Transaction List Authors / Team A CAPITAL MARKETS PUBLICATION | 4
Key Findings
AUSTRALI AN RE TAIL INV EST MENT SNAPSHOT
In 2019 the retail investment market saw a total of 122
NT
transactions with an average deal price of $56 million
– the fourth highest on record in a decade.
National transaction activity totaled $6.84 billion. NSW
$70.2m $35m/Deal
accounted for the largest dollar share of investment
QLD
volumes with $2.5 billion in sales. This represents 36
per cent of the total retail investment market. $1.4bn $48m/Deal
$829.2m $69m/Deal
WA
NSW
R E TA I L PROPERT Y TR ANSAC T I O N S 2 0 0 9 - 2 0 19
200 (No. Transactions)
$726m $182m/Deal
SA
$2.5bn $58m/Deal
AC T
$79.1m $26m/Deal
$48m / Deal
160 $48m / Deal
175 $61m / Deal
$50m / Deal $48m / Deal
154 $62m / Deal
146 151 149
120 $29m / Deal
136
$56m / Deal
VIC
$69m / Deal
$1.2bn $43m/Deal
$32m / Deal 121 122
109
$6.84bn
80 $36m / Deal
104
80
40 Total sales
0
2009 2010 2011 2012 2013 2014 2015 2016 2017 2018 2019
$56m/Deal TA S
NO MAJOR TRANSACTIONS
RECORDED FOR 2019
Source: Colliers International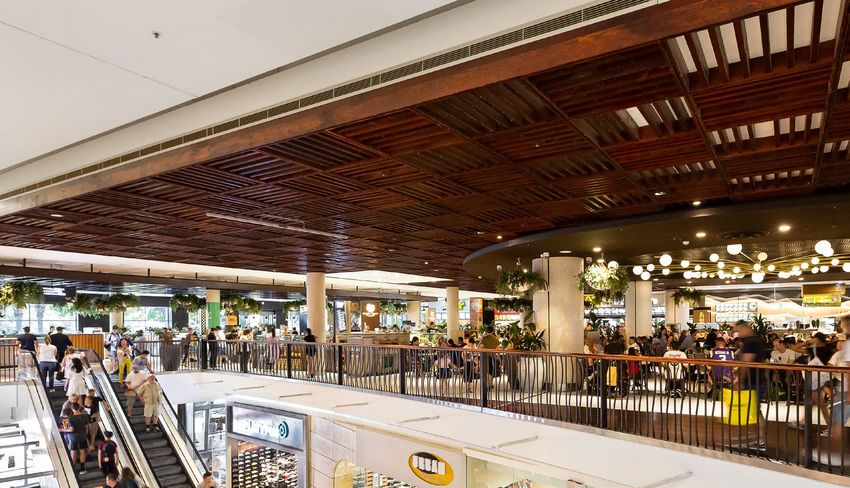
RETAIL INVESTMENT REVIEW | ANZ                 Introduction Key Findings   Major Transaction Overview NZ Overview Debt Advisory Thought Leadership   Detailed Transaction List Authors / Team                                   A CAPITAL MARKETS PUBLICATION | 5

Key Findings
PU RC HA S E R SO URCE O F C API TAL

Private Investors were the dominant purchaser group, accounting for 47 per cent of all retail transactions in 2019, by dollar value.
Institutional Investors were the second-most active                Syndicators have become increasingly prevalent in the              Whilst the overall retail market has contracted in terms of      The growth in investment by these purchaser types has
purchaser group by dollar value, accounting for 39 per             retail investment market over 2019, now accounting for 12          dollar figures between 2018 and 2019, Private investment         been counteracted by reduced activity from the Institutional
cent of total retail transactions. Institutional Investors have    per cent of the overall market. This is a significant increase     has grown by $259 million, or 9 per cent YoY, and Syndicate      investor group. Institutional investors accounted for $2.70
contracted from the retail market relative to their market         from the previous year, having almost quadrupled their             investment has grown by $560 million, 205 per cent YoY.          billion of retail investments in 2019, almost halving their
share in 2018, where they accounted for 59 per cent of             relative market share.                                                                                                              investment levels since 2018 of $4.93 billion.
all transactions.

 R E TA I L P R O P ER T Y T R A N S AC T I O N VO LU M E P R O P O R T I O N S BY P U RC H A S E R T Y PE                 T R A N S AC T I O N S P E N D    BY P U R C H A S E R T Y P E

                                                                                                                                      6 (Billion $AUD)
            OT H ER

           2%                                                                                                                         5                                           4.93
            SY N D I C AT E

           12%
                                                                                                                                      4

                                                                                                                                                              3.20
                                                                                                                                                 3.05

                                        $6.84bn
                                                                                                                                      3
                                                                                                                                                                                                2.70

                                                                                                                                      2

                                        Total
                                                                                                                                      1
                                                                                                                                                                                                                      0.83

                                                                                                                                                                                                           0.27
                                                                                                                                                                                                                                         0.15           0.11
                                                                                                      P R I VAT E                     0

            INSTITUTION                                                                                   47%                                           Private                      Institution              Syndicate                         Other
                                                                                                                                                                                                                                           2018          2019
           39%

                                                                                          t
RETAIL INVESTMENT REVIEW | ANZ                    Introduction Key Findings   Major Transaction Overview NZ Overview Debt Advisory Thought Leadership   Detailed Transaction List Authors / Team                             A CAPITAL MARKETS PUBLICATION | 6

Key Findings
PU RC HA S E R SO URCE O F C API TAL

                                                                                                                                                                                                     Private investors increased their market share in
R E TA I L P R O P ER T Y T R A N S AC T I O N VO LU M E P R O P O R T I O N S BY P U R C H A S E R T Y P E & S U B -S EC TO R                                                                       the CBD, Regional, Sub-Regional, Neighbourhood
                                                                                                                                                                                                     and Freestanding subsectors, and purchased less
                                                                                                                                                                                                     Large Format Retail and Other Retail assets.
                        CBD                                                                                                                                                                          Institutional investors increased their market share
                                                                                                                                                                                                     in Large Format Retail and Outlet Centres over the
                    Regional
                                                                                                                                                                                                     year, and reduced their market share of CBD, Regional,
                Sub-Regional                                                                                                                                                                         Sub‑Regional, Neighbourhood and Freestanding assets.
              Neighbourhood                                                                                                                                                                          Syndicates demonstrated their increased appetite for
                                                                                                                                                                                                     higher average dollar value assets, with increased
                Freestanding
                                                                                                                                                                                                     market share in Sub-Regional, Large Format Retail,
          Large Format Retail                                                                                                                                                                        Neighbourhood assets, and contracting from the
                                                                                                                                                                                                     Freestanding sub-sector.
                Outlet Centre

                       Other

                  Total Retail
                                 0%                             20%                              40%                          60%                             80%                             100%
                                      Private   Institution   Other     Syndicate

R EL AT I V E T R A N S AC T I O N VO LU M E P R O P O R T I O N S C H A N G E V E RS U S P R E V I O U S Y E A R BY P U R C H A S E R T Y P E & S U B -S EC TO R

                        CBD

                    Regional

                Sub-Regional

              Neighbourhood

                Freestanding

          Large Format Retail

                Outlet Centre

                       Other
                            (40%)                   (30%)               (20%)               (10%)               0%                  10%                 20%                30%                 40%
                                      Private   Institution   Other     Syndicate

                                                                                             t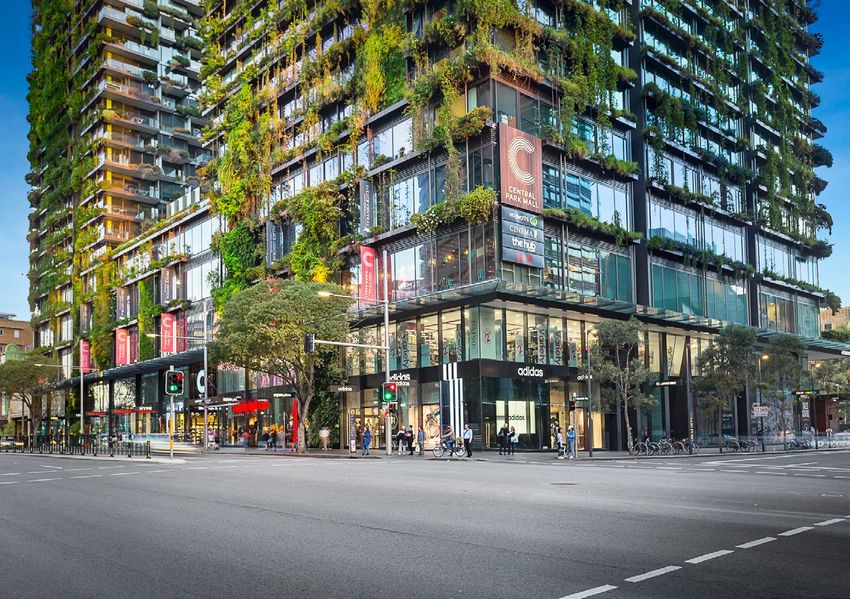
RETAIL INVESTMENT REVIEW | ANZ                         Introduction Key Findings   Major Transaction Overview NZ Overview Debt Advisory Thought Leadership   Detailed Transaction List Authors / Team                                                   A CAPITAL MARKETS PUBLICATION | 7

Key Findings
PU RC HA S E R SO URCE O F C API TAL

P U R C H A S ER O R I G I N BY S UB-SEC TO R                                                                     O F FS H O R E P U R C H A S E RS R E L AT I V E M A R K E T S H A R E C H A N G E V E RS U S P R E V I O U S Y E A R BY P U R C H A S E R T Y P E

                        CBD                                                                                                                  CBD                                                                                                                   34%

                    Regional                                                                                                              Regional                                                                                                      26%

               Sub-Regional                                                                                                                                                            (19%)
                                                                                                                                     Sub-Regional
             Neighbourhood
                                                                                                                                    Neighbourhood                                                        (4%)
               Freestanding
                                                                                                                                      Freestanding                                                   (5%)
         Large Format Retail
                                                                                                                              Large Format Retail                                                                       2%
               Outlet Centre

                       Other                                                                                                         Outlet Centre

                  Total Retail                                                                                                              Other                   (31%)

                                 0%              20%           40%          60%          80%         100%                                       (40%)          (30%)           (20%)             (10%)             0%              10%            20%            30%          40%
                                      Domestic     Offshore

   Offshore purchasers increased their relative and actual dollar investment in                                   O F FS H O R E P U R C H A S E R AC T I V I T Y BY CO U N T RY O F O R I G I N A N D T R A N S AC T I O N VA LU E
   retail assets between 2018 and 2019. Offshore purchasers accounted for 28
   per cent of the total retail investment market over 2019, an increase of 7 per
   cent from 2018. Offshore purchasers lifted their investment activity from                                                  $1000m
   $1.79 billion in 2018 to $1.91 billion in 2019, an increase of 6 per cent.

   Offshore investors boosted their market share of CBD and Regional                                                          800
                                                                                                                                                845
   acquisitions and reduced their Sub-Regional acquisition activity.

   Singaporean investors accounted for the largest source of offshore                                                         600
   investment in retail assets, through the purchase of Westfield Marion
   by Moelis Australia on behalf of SPH REIT for $670 million, and
   Central Park Retail by Fortius Funds Management on behalf of                                                               400
   SC Capital for $174.5 million.

                                                                                                                              200                             257
                                                                                                                                                                              167              163
                                                                                                                                                                                                             130             115                                         43
                                                                                                                                                                                                                                          105             82
                                                                                                                              0
                                                                                                                                              Singapore      Taiwan         Malaysia       China            Macau          Asia          France         Canada         USA
                                                                                                                                                                                                                         (Country)

                                                                                                     t
RETAIL INVESTMENT REVIEW | ANZ                 Introduction Key Findings    Major Transaction Overview NZ Overview Debt Advisory Thought Leadership   Detailed Transaction List Authors / Team                                A CAPITAL MARKETS PUBLICATION | 8

Key Findings
TOTA L RE TAIL SALES BY STAT E AND SUB- SEC TOR

NSW recorded the highest total transaction value with over $2.5 billion in sales.
This accounts for 36 per cent of the total retail investment market for 2019.

R E TA I L P R O P ER T Y S A L ES TOTA L VA LUE                 N S W R E TA I L SA L ES                                            Q L D R E TA I L SA L ES                                    VIC    RE TAI L SALES

      TOTAL                                                           TOTAL                                                               TOTAL                                                        TOTAL

     $6.84bn                                                         $2.5bn                                                              $1.4bn                                                    $1.2bn
       N SW: 3 6% | $2.5 B N         S A : 11% | $726M                     C B D: 21% | $520 M                                              C B D: 24% | $3 42M                                         C B D: 1% | $15 M
       Q L D: 21% | $1.4B N          AC T: 1% | $79.1M                     R EG I O N A L : 23% | $57 5 M                                   S U B R EG I O N A L : 25% | $3 6 6M                        S U B R EG I O N A L : 3 3% | $398 M
       V I C: 18% | $1. 2B N         N T: 1% | $70. 2M                     S U B R EG I O N A L : 17 % | $ 413 M                            N EI G H B O U R H O O D: 3 4% | $ 4 8 5 M                  N EI G H B O U R H O O D: 19 % | $23 3 M
       WA : 12% | $ 829 M                                                  N EI G H B O U R H O O D: 20% | $5 07 M                          FR EESTA N D I N G : 4% | $5 3 M                            FR EESTA N D I N G : 20% | $24 8 M
                                                                           FR EESTA N D I N G : 4% | $92M                                   L A RG E FO R M AT R E TA I L : 11% | $15 5 M               L A RG E FO R M AT R E TA I L : 6% | $70 M
                                                                           L A RG E FO R M AT R E TA I L : 13% | $3 3 4 M                   OT H ER: 3% | $ 4 0 M                                       O U T L E T: 6% | $ 6 8 M
                                                                           OT H ER: 2% | $3 8 M                                                                                                         OT H ER: 15% | $18 3 M

 WA     RE TA IL SALES                                                SA       R E TA I L SA L ES                                        AC T R E TA I L SA L ES                                   NT       RE TAI L SALES

      TOTAL                                                                  TOTAL                                                            TOTAL                                                       TOTAL

     $829.2m                                                                $726.0m                                                          $79.1m                                                      $70.2m
       R EG I O N A L : 69 % | $57 5 M                                        R EG I O N A L : 92% | $ 670 M                                   N EI G H B O U R H O O D: 8 7 % | $ 69 M                    N EI G H B O U R H O O D: 41% | $29 M
       N EI G H B O U R H O O D: 17 % | $14 4 M                               N EI G H B O U R H O O D: 3% | $22M                              FR EESTA N D I N G : 13% | $11M                             L A RG E FO R M AT R E TA I L : 59 % | $ 41M
       FR EESTA N D I N G : 5% | $ 42M                                        L A RG E FO R M AT R E TA I L : 5% | $3 4 M
       L A RG E FO R M AT R E TA I L : 4% | $3 5 M
       OT H ER: 4% | $32M
RETAIL INVESTMENT REVIEW | ANZ Introduction Key Findings Major Transaction Overview NZ Overview Debt Advisory Thought Leadership Detailed Transaction List Authors / Team A CAPITAL MARKETS PUBLICATION | 9
Major Transaction
Overview
CBD
Nationally, CBD assets reported an increase in
the total transaction value by 6 per cent to approximately
$876.7 million across twelve assets in 2019. Eight of
which transacted in Sydney, two in Brisbane, one in
Surfers Paradise and one in Melbourne.
Sydney CBD recorded the highest sales activity in 2019, with
$520.1 million in sales, which by dollar value, accounted for
59 per cent of retail CBD transactions nationally. Queensland
followed closely behind with $342.1 million in sales recorded,
accounting for 39 per cent of retail CBD transactions nationally.
The sale of one of Sydney’s newest and most diverse retail
precincts, Central Park Retail marked the single largest pure
play retail transaction within this sub-sector for 2019. This
transaction includes Central Park Mall, DUO Retail and Park
Lane Retail, all of which are located within the city-shaping
Central Park precinct in downtown Sydney CBD. Central
Park Retail was acquired by Fortius Funds Management with
Singapore‑based SC Capital from Frasers Property Australia
and Sekisui House Australia for $174.5 million at a fully
leased yield of 5.50 per cent.
Queen & Albert on Queen Street Mall was offered to the
market for the first time ever in 2019 and represented a
rare opportunity to acquire a significant land holding in the
centre of Queen Street Mall in the Brisbane CBD. The sale
of this asset confirmed the strong demand for rarely traded
trophy assets.
CENTRAL PARK RETAIL CBD Centres Transacted
SY D N E Y C B D
$174.5 million 5.50% October 2019
Vendor: Frasers Property Australia & Sekisui House Australia
Purchaser: Fortius Funds Management & SC Capital
Sold by: Colliers International
$876.7m YoY
6%
Central Park Mall
QLD
TOTAL
39%
AVERAGE YIELD CBD TRANSACTIONS LARGEST PURE RETAIL TRANSACTION
CBD SALES
4.92% 5.94% 13% $174.5m
OF THE
CENTRAL PARK
SYD TOTAL RETAIL
RETAIL
12 59%
INVESTMENT MARKET
SYDNEY CBD QUEENSLAND
ASSETS
VIC
2%
t
RETAIL INVESTMENT REVIEW | ANZ                        Introduction    Key Findings Major Transaction Overview NZ Overview    Debt Advisory Thought Leadership    Detailed Transaction List Authors / Team   A CAPITAL MARKETS PUBLICATION | 10

     Major Transaction Overview
     R E G I ON A L

     Nationally, three transactions were recorded in the Regional sub-sector in 2019, all             A 50 per cent interest in Westfield Marion – South Australia’s only super regional
     brokered by Colliers International.                                                              shopping centre – sold for $670 million in Q4 2019. The Centre was purchased
                                                                                                      by Moelis Australia with an investment vehicle fully capitalised by SPH REIT. The
     With a total transaction value of $1.82 billion, Regional centres represented 27 per cent
                                                                                                      acquisition deepens SPH REIT’s presence in the Australian market following its first
     of the total retail investment market. By dollar value, this is a small decline of 6 per cent
                                                                                                      acquisition of Figtree Grove Shopping Centre in December 2018.
     from the $1.94 billion transacted across four assets in 2018.
                                                                                                      In Q4 of 2019, Scentre Group acquired a 50 per cent share with management rights
     Westfield Burwood was the first regional transaction of 2019 with a 50 per cent
                                                                                                      in Garden City Booragoon, Western Australia’s best performing Regional centre.
     interest sold by Scentre Group to Perron Group for $575 million. Westfield Burwood
                                                                                                      The Centre, now rebranded Westfield Booragoon, was sold for $575 million by
     is located halfway between Sydney CBD and Parramatta CBD, at the heart of Sydney’s
                                                                                                      AMP Capital Diversified Property Fund at a 4.75 per cent cap rate. Scentre Group
     economic and population growth. Scentre Group and Perron Group have a longstanding
                                                                                                      will commence pre-development work for a new development scheme.
     joint venture relationship and co-own Westfield Woden, Westfield Airport West and
     Westfield Geelong.

                                                                                                              REGIONAL TRANSACTIONS LARGEST REGIONAL TRANSACTION
            Regional Centres Transacted

           $1.82bn                                   YoY

                                                     6%                    3
                                                                          ASSETS
                                                                                         3
                                                                                                               27%
                                                                                                               OF THE TOTAL RETAIL
                                                                                                               INVESTMENT MARKET
                                                                                                                                               $670.0m
                                                                                                                                                WESTFIELD MARION, SA

                                                                                       STATES
                                                                                     WA, SA, NSW

           WESTFIELD
           BURWOOD
             N S W, R EG I O N A L

            $575 million (50% interest) May 2019
            Vendor: Scentre Group
            Purchaser: Perron Group
            Sold by: Colliers International

Westfield Burwood
RETAIL INVESTMENT REVIEW | ANZ Introduction Key Findings Major Transaction Overview NZ Overview Debt Advisory Thought Leadership Detailed Transaction List Authors / Team A CAPITAL MARKETS PUBLICATION | 11
Major Transaction Overview
S UPER REG IONAL
WESTFIELD
MARION
S A , S U P E R R EG I O N A L
$670 million (50% interest) 5.50% December 2019
Vendor: Australian Prime Property Fund Retail (Managed by Lendlease)
Purchaser: Moelis Australia & SPH REIT
Sold by: Colliers International, with co-agent
Westfield MarionRETAIL INVESTMENT REVIEW | ANZ Introduction Key Findings Major Transaction Overview NZ Overview Debt Advisory Thought Leadership Detailed Transaction List Authors / Team A CAPITAL MARKETS PUBLICATION | 12
Major Transaction
Overview
GARDEN CITY
REG I ONAL BOORAGOON
WA , R EG I O N A L
$575 million (50% interest) 4.75% December 2019
Vendor: AMP Capital Diversified Property Fund
Purchaser: Scentre Group
Sold by: Colliers International, with co-agent
Garden City BooragoonRETAIL INVESTMENT REVIEW | ANZ Introduction Key Findings Major Transaction Overview NZ Overview Debt Advisory Thought Leadership Detailed Transaction List Authors / Team A CAPITAL MARKETS PUBLICATION | 13
Major Transaction Overview
S UB- REGI ONAL
With a total transaction value of $1.18 billion across ten assets, the Sub-Regional sub-sector represented 17 per cent of the total retail investment Sub-Regional Centres Transacted
market in 2019. This is a sharp decrease from the $2.08 billion transacted across 20 assets in 2018.
$1.18bn YoY
43%
Institutions were the most active investor-type in the Sub-Regional
SYNDICATE DOMESTIC CAPITAL LARGEST sub-sector for 2019 – accounting for 45 per cent or $524 million,
MARKET SHARE MARKET SHARE TRANSACTION a 25 per cent decrease in market share year on year. Private
16% 17% $235m
investors closely followed, representing 34 per cent or $398 million
NOOSA of the sub-sector. Syndicates experienced the largest increase in
market share year on year, increasing by 16 per cent to represent
CIVIC
NOOSA CIVIC, QLD
22 per cent of the total sub‑sector in 2019.
New South Wales recorded the most activity within the sub‑sector
Q L D , S U B - R EG I O N A L with a total transaction value of $413.3 million across four assets.
This accounted for 35 per cent of national sales. Victoria and
$235 million 6.00% August 2019
Queensland were the only other states to report sales within the
Vendor: Queensland Investment Corporation
sub-sector during 2019, with both states recording similar levels
Purchaser: Stockwell Funds Management
Sold by: Colliers International of activity.
Victoria recorded three sales totalling $398 million, or 34 per cent
of sub-sector volumes nationally. Queensland followed closely
behind with $366 million recorded across three sales, accounting
for the remaining 31 per cent of national sub-sector dollar value
in 2019.
Noosa Civic Shopping Centre was the largest Sub‑Regional
transaction for 2019. The 100 per cent interest was acquired
by Stockwell Funds Management from Queensland Investment
Corporation in Q3 of 2019. Purchased for $235 million, the
sale reflected a yield of 6.00 per cent and was facilitated
by Colliers International.
10
ASSETS
SOLD
Noosa CivicRETAIL INVESTMENT REVIEW | ANZ Introduction Key Findings Major Transaction Overview NZ Overview Debt Advisory Thought Leadership Detailed Transaction List Authors / Team A CAPITAL MARKETS PUBLICATION | 14
Major Transaction WAURN PONDS
Overview SHOPPING CENTRE
SUB -REGIONAL
V I C , S U B - R EG I O N A L
$145 million (50% Interest) 6.05% July 2019
Vendor: Australian Unity
Purchaser: ISPT Core Fund
Sold by: Colliers International
Waurn Ponds Shopping CentreRETAIL INVESTMENT REVIEW | ANZ Introduction Key Findings Major Transaction Overview NZ Overview Debt Advisory Thought Leadership Detailed Transaction List Authors / Team A CAPITAL MARKETS PUBLICATION | 15
Major Transaction Overview
NE IGHBOU R HOO D CENTRES
The Neighbourhood sub-sector recorded the most transaction activity in 2019 with 42 asset sales totaling $1.49 billion.
42
By dollar value this is a 10 per cent decline from 2018 levels.
New South Wales and Queensland recorded $507 million and $485 million respectively Private investors dominated the market, accounting for $786 million of The sale of Norton Plaza in New South Wales was the largest Neighbourhood
in Neighbourhood centre sales. Combined, New South Wales and Queensland registered total sales and 53 per cent of market share in the sub-sector. Syndicates centre transaction of 2019. Occurring in Q3, the 100 per cent interest was offered
ASSETS
13 deals and accounted for 66 per cent of sub-sector transaction volume nationally. were more active in 2019 increasing market share to 26 per cent or to the market by the GPT Wholesale Shopping Centre Fund and acquired by a SOLD
Victoria and Western Australia each recorded six transactions and together accounted $386 million, proportionately five times greater than 2018 levels. Private Investor for $153.2 million on a 5.50 per cent yield.
for 25 per cent of the national sub-sector sales value. The Australian Capital Territory,
Northern Territory and South Australia comprised the remaining Neighbourhood SYNDICATE DOMESTIC CAPITAL LARGEST
Neighbourhood Centres Transacted
$1.49bn
sub‑sector, recording a total of four sales. MARKET SHARE MARKET SHARE TRANSACTION
16% 17% $153.2m
YoY
10% NORTON PLAZA,
NSW
NORTON PLAZA
N S W, N EI G H B O U R H O O D C E N T R E
$153.2 million 5.50% August 2019
Vendor: GPT Wholesale Shopping Centre Fund
Purchaser: Private Investor
Sold by: Colliers International, with co-agent
Norton PlazaRETAIL INVESTMENT REVIEW | ANZ Introduction Key Findings Major Transaction Overview NZ Overview Debt Advisory Thought Leadership Detailed Transaction List Authors / Team A CAPITAL MARKETS PUBLICATION | 16
Major Transaction Overview
F R EESTAN DING
23
The Freestanding retail sub-sector remained steady during 2019 with $446.5 million worth of transactions
across 23 assets. Sales declined marginally from 2018, by 2 per cent, but remain high compared to activity
during 2016 and 2017, which recorded $316.2 million and $182 million in sales, respectively. ASSETS
TRANSACTED
Freestanding Retail Transacted
$446.5m YoY
2%
COLES Victoria accounted for 56 per cent of national transaction
WEST RYDE volume in the Freestanding retail sub-sector in 2019. The
State recorded $247.9 million in sales across twelve assets.
W ES T RY D E , N S W This was more than double the second-most active state
of New South Wales, where $92.4 million in sales was
$23.85 million 5.85% December 2019 recorded over six transactions.
Vendor: Coles Group Property Developments Pty Ltd
Purchaser: Confidential Coles Group anchored freestanding retail assets accounted
Sold by: Colliers International
for the majority of sales recorded in 2019, with a total
of $304.6 million sold across thirteen transactions,
including the sale of Coles & Kmart Northcote Plaza and
Coles & Kmart Boronia.
The largest Freestanding retail transaction in 2019 was
the combined of sale of Coles and Kmart within the strata
shopping centre Northcote Plaza. The assets were purchased
by a private developer at a sub 5 per cent cap rate.
Private investors were the only purchasers of Freestanding
retail assets in 2019. The development arms of Coles
Group and Woolworths Group sold eight freestanding
retail assets, while institutional landlords disposed of
four freestanding retail assets in 2019.
13 7
MOST ACTIVE STATE VIC
$247.9m 56% OF
TOTAL VALUE
COLES GROUP WOOLWORTHS
TENANTED GROUP TENANTED LARGEST TRANSACTION
$35m
ASSETS ASSETS
COLES & KMART
NORTHCOTE PLAZA
Coles West RydeRETAIL INVESTMENT REVIEW | ANZ Introduction Key Findings Major Transaction Overview NZ Overview Debt Advisory Thought Leadership Detailed Transaction List Authors / Team A CAPITAL MARKETS PUBLICATION | 17
Major Transaction Overview
L A RGE FORMAT RE TAIL / OUT L E T C E NT RES
In total, 23 assets in the Large Format Retail and Outlet Centre sub-sector 23ASSETS
transacted in 2019 for an aggregate sale volume of $736.8 million. SOLD
LFR & Outlet Centres Transacted
HOMEMAKER
$736.8m YoY
39%
PROSPECT
New South Wales recorded the highest sales volume within
the sub-sector with $334.0 million transacting over nine
assets, accounting for 45 per cent of total Large Format Retail
N S W L A R G E F O R M AT R E TA I L (LFR) investment sales in 2019.
$64.3 million 7.10% July 2019 Institutional investors were highly active within the sub‑sector,
Vendor: Altis Property Partners purchasing $340.2 million of LFR and Outlet Centre assets
Purchaser: Dexus across eight transactions. Institutional purchasers also
Sold by: Colliers International, with co-agent accounted for five out the ten largest LFR investment sales
in 2019.
A total of nine Bunnings Warehouse anchored assets were
purchased in 2019, accounting for $256.2 million or 32 per
cent of the total LFR sales.
The single Outlet Centre transaction in 2019 was the
acquisition of a 50 per cent stake in Uni Hill Factory Outlets
for $67.8 million. Vicinity Centres purchased the stake from
LFR ACCOUNTED FOR
their joint venture partner MAB Corporation on a 6.50 per
11% OF TOTAL RETAIL
INVESTMENT MARKET
cent initial yield. The transaction is subject to ACCC approval
and is expected to settle in early 2020.
The $64.3 million sale of Homemaker Prospect in Sydney’s
LARGEST OUTLET TRANSACTION western suburbs was the largest transaction for the LFR
$67.8m 50% INTEREST UNI HILL
FACTORY OUTLETS
sector in 2019. Homemaker Prospect was purchased
by Dexus on a cap rate of 7.10 per cent.
LARGEST LFR TRANSACTION
$64.3m HOMEMAKER
PROSPECT
FREESTANDING BUNNINGS WAREHOUSES
$256.2m
MOST ACTIVE STATE NSW
Homemaker Prospect
$334.0m 45% OF
TOTAL VALUERETAIL INVESTMENT REVIEW | ANZ Introduction Key Findings Major Transaction Overview NZ Overview Debt Advisory Thought Leadership Detailed Transaction List Authors / Team A CAPITAL MARKETS PUBLICATION | 18
New Zealand
OV ERVI EW
It is the ongoing buoyant levels of spending in an evolving and testing retail environment H OY T S E N T X , C H R I S TC H U R C H A L B A N Y L I F E S T Y L E C E N T R E , AU C K L A N D
that has enabled purchasers of retail assets to remain active this year.
WHY INVESTING IN NZ MAKES SENSE FROM AN OFFSHORE PERSPECTIVE:
$48,800,000 May 2019 $89,000,000 Mar 2020
Vendor: Calder Stewart Vendor: Argosy Property Trust
Purchaser: Private Local Investor Purchaser: Augusta Funds Management
A BENIGN TAX POSITIVE NET Retail sales comprised 30 per cent of all transactions in New
Zealand during 2019, this is up on previous years which
What all the sales demonstrate is that experienced retail
property investors continue to favour the sector. While
STRUCTURE MIGRATION usually sees 20 per cent of transaction activity occur within
the retail market.
investors are typically focussing on prime assets in supportive
catchments, some investors are also re‑evaluating the sector’s
and limited property associated taxes: and demographic profiles Investors have been particularly active in their search for
potentially higher yielding return opportunities in comparison
to some other sectors. However, with higher returns, typically
LFR properties, accounting for a large proportion of major
L I M I T E D C A P I TA L G A I N S TA X comes higher risk, and comprehensive due diligence is critical
transactions (NZD$20 million or more) in 2019.
N O S TA M P D U T Y O R C O N V E YA N C E D U T Y to the long‑term successful outcome of these decisions.
However, it is not just LFR assets that are pursued by
We forecast investors to remain vigilant in their due
investors. One of the other largest retail transactions of
diligence but cautiously confident in their purchasing
the year was the sale of Hoyts EntX in Christchurch. The
Supportive investment for foreign and local ownership property has a seven-screen cinema and 19 hospitality outlets.
decisions in 2020.
The three-level building is on a 5,000 square metre site on
Favourable current debt to yield spreads Colombo Street with Hoyts occupying approximately 40 per
cent of the premises. Developers Calder Stewart sold the
Centre for NZD$189 million to local private investors, reflecting
Transparent real estate sector: indefensibility of title a yield of 6.5 per cent.
While still to be settled due to a syndication selldown that will
Favourable long-term economic indicators take place in 2020, Oyster Property Group is set to acquire
a 60 per cent share in Tauranga Crossing. This includes
Solid, long-term total returns with relatively low volatility Tauranga Crossing Shopping Centre, Lifestyle Centre, and
land for further development. The remaining 40 per cent will
be retained by the current owner and developer, Tauranga
A stable political regulatory environment Crossing Limited. The purchase price of the Property is
NZD$189 million.RETAIL INVESTMENT REVIEW | ANZ Introduction Key Findings Major Transaction Overview NZ Overview Debt Advisory Thought Leadership Detailed Transaction List Authors / Team A CAPITAL MARKETS PUBLICATION | 19
Debt Advisory
T H E AUST RALIAN R E TAIL PROPERT Y DI FF ER EN C E
The trends that began emerging in commercial real estate debt markets over three years ago have not only continued,
but deepened throughout 2019. It is our expectation that they will carry over into 2020 and beyond.
MAJOR BANKS ALTERNATIVES
slow growth, declining market share momentum keeps building
Enhanced regulatory oversight and guidelines have well Despite growing geopolitical tensions, Australia remains In 2018, at least $80 billion of alternative private debt
and truly cemented permanent change in how Australian a ‘safe haven’ for investment capital, with 30 per cent of was estimated to be available to the market. In 2019, we
Deposit-taking Institutions (“ADIs”) – particularly the major the $31 billion in commercial real estate transacted in 2019 have witnessed borrower enquiry for alternative CRE
banks – approach Commercial Real Estate (CRE) lending. A acquired by foreign capital. loan products grow and, alongside it, no shortage of
Notwithstanding
greater level of transaction diligence, conservatism around
loan terms, deal and client selectiveness are now the Foreign Investment in Aus Commercial Real Estate (>A$20m)
commitments from all manner of debt investors.
PERCEIVED ‘HEAD WINDS’
10-year Australian Government Bond Yields
banking norm. As a result, the major banks’ market share
the Retail asset class is
of CRE lending continues to trend downwards as it slowly Undisclosed 12.00%
approaches more normalised levels.
purchasers
receiving support from lenders
10.00%
Major Bank Market Share of Total ADI CRE Exposures Domestic
purchasers
400,000 (Million $AUD) 100%
8.00% Whilst all core real estate sectors remain of interest
90%
to varying degrees, financiers are assessing
350,000
80%
Foreign
purchasers
6.00% each lending opportunity on its merits and not
300,000 70% prejudicing any one asset class. Good quality retail
60%
4.00% assets with strong tenancy profiles, manageable
Total transaction
250,000
50% volumes (>$20m) exposure to discretionary spend and online threats,
200,000
50%
2.00% are still considered an attractive asset class to
40%
0 5,000 10,000 15,000 20,000 25,000 30,000 35,000 lenders. Banks understand the defensive nature
(Millon $AUD) 0.00%
150,000 30% of these assets that are underpinned by the major
Office Other sectors
Se 5
Se 6
Se 7
Se 9
Se 0
Se 01
Se 3
Se 4
Se 5
Se 7
Se 8
Se 3
Se 5
Se 6
Se 7
09
Se 11
Se 2
Se 19
20
21
supermarkets and offer strong reliable cash flow.
1
0
1
9
0
1
1
1
9
0
9
9
0
0
0
p-
p-
p-
p-
p-
p-
p-
p-
p-
p-
p-
p-
p-
p-
p-
p-
p-
p-
p-
p-
p-
20%
Se
Se
Se
100,000
10% Australian CRE offers relative value by regional and We expect this support to continue into 2020.
50,000 0% global standards, our domestic transparency and liquidity With most disappearing from the ASX post-crisis, the
measures are high and our broader economy – despite its re-emergence of the listed CRE debt fund is arguably
Se 05
Se 07
Se 0
Se 11
Se 2
Se 5
Se 6
Se 17
Se 18
19
S e 04
Se 08
Se 3
Se 4
Se 6
Se 9
1
1
1
1
1
0
0
1
p-
p-
p-
p-
p-
p-
p-
p-
1
p-
p-
p-
p-
p-
p-
p-
p-
the most notable trend of the last twelve months. We
Se
challenges – has managed to keep growing.
Total CRE Exposure (ADIs) (LHS) predict momentum to keep gathering in this space, as
% Foreign Bank Exposure (RHS) These market features have worked to attract increasing an increasing number of investment managers seek to
investment in CRE debt in recent years, with no slowdown diversify their capital-base and product offering to the
% Major Bank Exposure (RHS)
noted in 2019. Motives and models vary, but in general, market. This will see retail investors gain access to real
CRE debt products provide investors with: estate debt opportunities that, for the last decade, have
• Downside protection against potential drops in capital values; only been available to banks, sophisticated, wholesale and
institutional investors.
• A significant spread above the risk-free rate which is
– and forecast to remain for the foreseeable future – at Adding numbers and diversity to the alternatives pool and
record lows; and increasing the supply of CRE debt capital available is a
• Diversification of exposure among real estate sectors, positive for borrowers, who should experience structuring
locations, clients and capital structures. and pricing benefits as a result.RETAIL INVESTMENT REVIEW | ANZ Introduction Key Findings Major Transaction Overview NZ Overview Debt Advisory Thought Leadership Detailed Transaction List Authors / Team A CAPITAL MARKETS PUBLICATION | 20
Debt Advisory
T H E AUST RALIAN R E TAIL PROPERT Y DI FF ER EN C E
LOWER FOR LONGER… and longer… and longer WHAT ABOUT KYC?
The ‘lower for longer’ concept has been bandied around Short-term rates have remained higher than medium-term
for at least the last two to three years as the cash rate rates through 2019 and the sustained view from the market
2018 saw the financial services industry come under heavy review by the
remained unchanged at 1.50 per cent for the period August is that interest rates will remain low, at least until 2021. Financial Services Royal Commission. Its findings exposed many shortcomings,
2016 to June 2019, and we encountered an inverted yield Even then, increases are forecast to be small and gradual. regulatory breaches and misleading behaviours of the banks, fuelling
curve during the fourth quarter of 2018.
stakeholder-doubt around the integrity of Australia’s financial system.
2018 vs. 2019 Yield Curve 10-year Monthly BBSW3M Forecast
Not less than nine months since the Royal Whilst satisfaction of KYC has been a condition
3.00% (Rate P.A.) 3.50% (Rate P.A.) Commission’s final report was presented to precedent to securing real estate loans for years,
2.50%
Parliament (and less than 18 months since the we have witnessed the level of complexity and
3.00% Commonwealth Bank of Australia agreed to pay depth of information requested by lenders increase
2.00% the biggest fine in Australian corporate history for year-on-year. With additional funding having been
2.50% breaches of anti-money laundering and counter- granted to AUSTRAC in the 2019/2020 Budget,
1.50% terrorism finance laws), the financial services the government clearly intends to ramp-up its
2.00% industry is dominating the headlines once again as intention to monitor for – and prosecute – non-
1.00% serious breaches of Know Your Customer (“KYC”) compliance. Accordingly, borrowers can expect
1.50% laws by our largest banks are uncovered. to have to offer up more detail on their directors,
0.50% shareholders, nature of business, sources of equity
For banks and other reporting entities, KYC
1.00% than ever before as lenders respond to higher levels
0.00% requirements – the way a business verifies the
of scrutiny.
0.1 0.2 0.3 0.3 0.4 0.5 1 2 3 4 5 7 identity of its clients and seeks to understand
0.50%
Swap tenor (years) their financial affairs – are legislated under the Satisfying KYC can become a protracted process
Dec - 19 Dec - 18 22 Anti-Money Laundering and Counter-Terrorism where more questions are asked than answered
Au 21
Fe 21
Au 23
Au 24
Au 7
Au 5
Au 26
Au 8
Au 0
22
Fe 3
Fe 24
Fe 27
Fe 5
Fe 6
28
Fe 0
g- 2
2
2
2
2
2
2
2
b-
g-
b-
b-
Au
b-
g-
g-
g-
b-
b-
b-
g-
g-
g-
b-
b-
g-
Fe
Fe
Financing Act 2006 and overseen by the Australian with each piece of information that is provided. Our
Current 1 Month Ago 6 Months Ago 12 Months Ago Transaction Reports and Analysis Centre advice – especially if you have personnel living,
(“AUSTRAC”). and entities domiciled, offshore – is always to
Despite the significant improvement in investors’ cash start it early.
flow driven by ever-reducing borrowing costs, we are yet
to see any mainstream adoption of levered IRRs or cash
flows informing asset pricing. Given where rates have
been, and are forecast to go, the question should be asked
– is it time for buyers to adapt their thinking? Those who
are in a position to value the benefits of an efficient and
cost-effective financing structure will be more competitive,
successful bidders for assets.RETAIL INVESTMENT REVIEW | ANZ Introduction Key Findings Major Transaction Overview NZ Overview Debt Advisory Thought Leadership Detailed Transaction List Authors / Team A CAPITAL MARKETS PUBLICATION | 21
Feature Thought Leadership
T H E C U R RE NT STATE OF THE AUST RAL I AN RE TAI L MAR K E T : T R E N DS A N D IM P L IC AT IO N S
The Australian retail market remains in relatively good shape despite the negative headwinds around the globe.
Together these categories accounted for 78 per cent of
Retail sales have increased by 2.7 per cent over the year to December 2019, outperformed the overall economy which
the total retail consumption in Australia. The weighted
expanded by 1.7 per cent to September 2019. Growing population, low interest rate and a solid employment outlook average growth rate of these groups over the past year
continue to support private consumption. Food retailing, Clothing & Footwear, Café & Restaurants and Other retailing – was 3.4 per cent, which was 29 per cent faster than the
national average. Food retailing was the largest retail
which includes recreational goods, pharmaceutical and cosmetic products remained the outperforming retail categories. category while clothing and footwear is the fastest growing
at 4.8 per cent over the past year.
Household goods and Department stores were sectors
AU S T R A L I A N R E TA I L S A L ES G R OW T H BY C AT EGO RY A N D S I ZE most impacted by cyclical headwinds and structural
changes in consumer preferences. The slowing housing
market and falling building approvals were the main
catalysts for the recent slowdown in household good
$200,000 Annual turnover ($ million)
consumption. However, Colliers International believes
these issues are only cyclical and have a temporary
effect. Looking forward, as the housing market makes
UNDERPERFORMERS OVERPERFORMERS further progress towards a recovery, household good
R E TA I L S A L E S consumption is expected to strengthen. Our analysis
160,000
2.7%
shows population growth continues to be the long-term
driver of household goods despite the cyclical impact
of housing construction. Department stores, on the
other hand, are navigating through structural changes in
Food
consumer preferences – which are more permanent. One
have increased over the
120,000 of the most important changes in consumer behaviours
year to December 2019
is the rise of conscious consumerism, especially among
young consumers. Retailers that are slow in response will
risk losing their market share and will be most vulnerable
to market dynamics.
80,000
R E TA I L T U R N OV E R
Cafe & Restaurants
FOOD: 41%
Household Goods CLOTHES & FOOTWEAR: 8%
F O O D R E TA I L I N G Other
40,000 OTHER: 14%
CAFE & RESTAURANTS: 14%
was the largest retail
HOUSEHOLD GOODS: 17%
category and also had the
DEPARTMENT STORES: 6%
growth rate of
Department Stores
3.8%
Clothes & Footwear
0
(1.0%) 0 1.0% 2.0% 3.0% 4.0% 5.0%
tRETAIL INVESTMENT REVIEW | ANZ Introduction Key Findings Major Transaction Overview NZ Overview Debt Advisory Thought Leadership Detailed Transaction List Authors / Team A CAPITAL MARKETS PUBLICATION | 22
Feature Thought Leadership
THE RISE OF CONSCIOUS CONSUMERISM IMPLICATIONS FOR THE RETAIL INDUSTRY
While Australian consumers have always been conscious of the social and environmental The rising trend toward more sustainable consumption is having
impacts of their consumption, a gap between their intention and action existed. This significant implications for the retail industry in Australia.
phenomenon is identified as the attitude-behaviour gap, which postulates that while Consumers increasingly expect retailers and shopping centre
consumers are generally concerned about ethical issues their actions and engagement are owners to actively drive environmentally sustainable business
not commensurate in accordance. However, recent research has shown that this attitude- as part of their corporate social responsibility. Information
behaviour gap has begun to narrow in recent years. Australian consumers are becoming transparency and local community engagement are other key
increasingly ethically‑minded and taking direct action to adjust their purchasing behaviours to considerations. As the retail landscape continues to evolve, retail
bring about social, economic and environmental change. brands must compete on values, ethics and sustainability rather
than just low prices. In the future, more space allocation may be
given to brands that focus on durability and sustainability to meet
the ethical expectations of consumers and the society.
Sustainability initiatives will become the norm and must be
integrated into the daily operations of centres. Some of which
Generation MillZ Quality over Quantity
The rise of conscious consumerism in recent years can These trends are consistent with our analysis, which include environmentally-friendly transportation arrangements,
be attributed to several factors, including; the spread of reveals consumers are increasingly shying away from low- electric vehicle charging stations, recycling stations, energy and
information through social media influencers as well as the quality and disposable products to opt for more durable water-efficient solutions and solar-power. All major shopping centre
emergence of the Millennials and Generation Z (those who and higher-quality ones. As a result, retail brands that
owners such as Scentre Group, Vicinity, AMP, Dexus and Lendlease,
were born after 1996) as the largest consumer segment haven’t paid attention to improving their quality offerings
in the developed world. These cohorts of consumers - have struggled with growth in recent years, while the among others are at the forefront of this evolution. Colliers
collectively known as ‘Generation MillZ’ - now makes up higher end of the market has continued to prosper. The International are partnering with companies such as Solar Bay,
40 per cent of the Australian working population and are collapse of Forever 21 and Big W's closure of 30 stores who specialise in funding the installation of energy infrastructure
gaining tremendous power – commercially, socially and nationwide highlight these challenges. and selling back electricity to tenants, and Tomra, which provides
politically.
With a generation easily influenced by social media and Reverse Vending Solutions for used bottles and cans. We believe
Generation MillZ are not only extremely tech-savvy but also marketing, retailers must focus on quality, value proposition conscious consumerism will driver further development in the
more environmentally conscious than any other generation. and brand positioning to meet the ethical demand of
These characteristics are shaping their purchasing habits. today’s consumers. Some successful stories include
sector for businesses who can assist with sustainable practices.
At the forefront of their concerns are climate change and brands such as H&M, which is committed to supply chain
the human impact on the environment, according to a transparency by publishing a list of 98.5 per cent of their
recent study by Deloitte. A survey by HP Australia and suppliers’ names and addresses on their website and
Planet Ark further indicates that young Australians are update it on a quarterly basis. Other brands such as David
increasingly diverting their consumption toward products Jones, Myer, ALDI are also committed in driving positive
and services that align with their ethical values. social and environmental change through their supply
chains. These initiatives are yielding results with examples
such as Australian shoemaker, R.M. Williams, which
focuses on sustainability and longevity, having to double
their production to meet the rising demand.RETAIL INVESTMENT REVIEW | ANZ Introduction Key Findings Major Transaction Overview NZ Overview Debt Advisory Thought Leadership Detailed Transaction List Authors / Team A CAPITAL MARKETS PUBLICATION | 23
2020 Retail Investment Forecast
IN V ESTM ENT O UTLOOK
Investors continue to hold a positive long-term view on the Australian retail While the fundamentals remain solid, retail landlords in We anticipate investor demand for Australian retail
Australia are focusing on future-proofing their assets property to grow over the next 12 months as investment
market despite short-term challenges. The Australian population continues through innovative strategies. Owners are embracing yields are becoming more attractive. With the bond rate
to grow and is expected to reach 30 million by 2030 featuring one of the the changing consumer habits and recognising the new trending towards historic lows, the yield gap between
demand stemming from digitally-oriented retail tenants. core retail yields and bond rates have surpassed its long-
fastest rates of growth in the developed world. The economy is entering its Global eCommerce giants such as Amazon, Alibaba and term average. The average yield gap as at December
28th year of uninterrupted expansion – the most prolonged period of growth JD.com have all started to penetrate the brick-and-mortar 2019 currently sits at around 400-500 basis points. This
retail space, while traditionally pure-play retailers are attractive pricing proposition has continued to attract
in the world. On the other hand, the new supply of retail space is declining as
increasingly engaging an Omni-retailing approach through offshore investors, who are increasingly looking to capital
developers hold back on developments while there is an increasing amount click & collect strategy. Our research consistently shows partner with high-quality managers in Australia. Assets
of retail space being converted to alternative uses such as co-working offices that physical stores can be a significant complementary that are dominant in their catchments and well supported
driver of online sales. For many retailers, their physical by the local population remain highly attractive to both
and industrial. With Australia already having one of the lowest levels of retail showrooms are no longer a channel to drive revenue, but foreign institutions and local value-add investment funds.
space per capita and per available land area, there is a potential shortage of an extension of their online business. As a result, there is
a need for more appropriate metrics to capture the total
retail space in Australia over the next few years. impacts of brick-and-mortar stores.
R E TA I L S U P P LY BY C ATE GORY
1.20 (Million)
1.00
0.80
0.60
0.40
0.20
0.00
2018 2019 2020 2021 2022 2023
CBD Retail Freestanding Large Format Mixed Use Shopping Centre
Coles WillowdaleRETAIL INVESTMENT REVIEW | ANZ Introduction Key Findings Major Transaction Overview NZ Overview Debt Advisory Thought Leadership Detailed Transaction List Authors / Team A CAPITAL MARKETS PUBLICATION | 24 Retail Investment Transactions 2019 T R AN SAC T IO NS > $10 MILL I ON ( AUD ) CBD Centre Suburb State GLAR M² Sale Price Sale Date Stake Cap Rate $SP/m² Purchaser Vendor Queen & Albert (Retail Component) Brisbane City QLD 7,283* $200,000,000* Nov-19 100% 5.50%* $27,461 Shayher Group QIC Frasers Property Australia Central Park Mall Sydney NSW 14,716 $174,500,000 Oct-19 100% 5.50% $11,858 Fortius Funds Management & SC Capital & Sekisui House Australia Sydney Trust Building (Retail Strata) Sydney NSW 1,472 $105,000,000 Jul-19 100% VP $71,332 Hermes Gennaro Autore Glasshouse Shopping Centre (Retail component) Sydney NSW 5,406 $82,000,000 Aug-19 50% 4.29% $30,337 Investa (ICPF) Stockland 130 Queen Street Brisbane City QLD 3,771 $77,100,000 May-19 100% 5.29% $20,446 Marquette Smorgon Family Circle on Cavill Surfers Paradise QLD 12,586 $65,000,000 Dec-19 100% 8.05% $5,164 Loi Keong Kuong EG Funds Management Rockpool & Spice Temple, 66 Hunter Street Sydney NSW 2,030 $40,000,000 Dec-19 100% 5.00% $19,704 Daybreak Holding Australia Allegra European Holdings Barangaroo House (Leasehold) Sydney NSW 1,492 $38,600,000 Jul-19 100% 3.63% $25,880 Hualong Investments Pty Ltd Lendlease Guylian Café at Opera Quays Sydney NSW 304 $35,000,000 Aug-19 100% VP $115,132 Beatus Holdings Kazal Bros Pty Ltd Buckley’s Bar at Opera Quays Sydney NSW 408 $25,100,000 Dec-19 100% 3.50% $61,520 Private Investor Huang Family Castlereagh Club Sydney NSW 2,622 $19,850,000 Sep-19 100% 6.50% $7,571 Fife Capital Leda Holdings Shark Fin House (131-135 Little Bourke Street) Melbourne VIC 928 $14,500,000 May-19 100% 3.60% $15,625 Private Investor Private Investor Syndicate Total $876,650,000 * Retail component only
RETAIL INVESTMENT REVIEW | ANZ                 Introduction Key Findings   Major Transaction Overview NZ Overview   Debt Advisory Thought Leadership Detailed Transaction List Authors / Team                      A CAPITAL MARKETS PUBLICATION | 25

Retail Investment Transactions 2019
T R AN SAC T IO NS > $10 MILL I ON ( AUD )

Regional
Centre                                             Suburb                  State    GLAR M²           Sale Price        Sale Date       Stake      Cap Rate        $SP/m²       Purchaser                    Vendor
										                                                                                                                                                                                                   Australian Prime Property Fund Retail
Westfield Marion Oaklands Park SA 136,851 $670,000,000 Nov-19 50% 5.50% $9,792 Moelis Australia & SPH REIT                                                                                                   (Managed by Lendlease)
Westfield Burwood                                  Burwood                 NSW         63,219     $575,000,000             May-19         50%         4.75%         $18,191     Perron Group                 Scentre Group
Garden City Booragoon                              Booragooon              WA          72,843    $575,000,000*             Dec-19         50%         4.75%        $15,787      Scentre Group                AMP Capital Diversified Property Fund
Total Regional Transaction Volume				 $1,820,000,000
* inc. $5 million of ancillary residential properties

Sub-Regional
Centre                                             Suburb                  State    GLAR M²           Sale Price        Sale Date       Stake      Cap Rate        $SP/m²       Purchaser                    Vendor
Noosa Civic                                        Noosaville              QLD         31,607     $235,000,000             Aug-19        100%         6.00%         $7,435      Stockwell Funds Management   QIC
Brimbank Shopping Centre                           Deer Park               VIC         37,576      $152,000,000            Dec-19        100%         7.25%         $4,045      Mulpha                       Blackstone
Waurn Ponds Shopping Centre                        Waurn Ponds             VIC        48,505       $145,000,000             Jul-19        50%         6.05%         $5,979      ISPT Core Fund               Australian Unity
Rockdale Plaza                                     Rockdale                NSW          21,331    $142,000,000             Mar-19        100%         6.25%         $6,657      Charter Hall Retail REIT     City Freeholds
Stockland Jesmond                                  Jesmond                 NSW         20,347      $118,000,000            Aug-19        100%         7.50%         $5,799      Haben Property Fund          Stockland
Corio Central                                      Corio                   VIC         31,503      $101,000,000            Nov-19        100%          9.31%        $3,206      IP Generation Pty Ltd        Vicinity Centres
Mt Ommaney Shopping Centre                         Mt Ommaney              QLD         56,469       $94,500,000            Nov-19         25%         6.05%         $6,694      YFG Shopping Centres         Vicinity Centres
Neeta City                                         Fairfield               NSW         24,752       $85,300,000            Mar-19        100%         7.80%         $3,446      Elanor Investors Group       Arcadia Managed Investments
St Marys Village Shopping Centre                   St Marys                NSW         15,904      $68,000,000             Oct-19        100%         5.04%         $4,276      Amelia Yan                   Mirvac
Pialba Place                                       Hervey Bay              QLD         15,647       $36,500,000            Feb-19        100%         8.00%         $2,333      M/Group                      Vinta Group
Total Sub Regional Transaction Volume				 $1,177,300,000
RETAIL INVESTMENT REVIEW | ANZ         Introduction Key Findings   Major Transaction Overview NZ Overview   Debt Advisory Thought Leadership Detailed Transaction List Authors / Team                                     A CAPITAL MARKETS PUBLICATION | 26

Retail Investment Transactions 2019
T R AN SAC T IO NS > $10 MILL I ON ( AUD )

Neighbourhood
Centre                                       Suburb                State    GLAR M²           Sale Price        Sale Date       Stake      Cap Rate        $SP/m²       Purchaser                                   Vendor
Norton Plaza                                 Leichhardt            NSW          11,751     $153,200,000            Aug-19        100%         5.50%        $13,037      Private Investor                            GWSCF
Stockland Cleveland                          Cleveland             QLD         15,650     $103,000,000             Jan-19        100%         6.93%         $6,581      Haben Property Fund                         Stockland
Warner Marketplace                           Warner                QLD          11,477      $78,350,000            Dec-19        100%         5.69%         $6,827      SCA Property Group                          AMP Capital Investors
HomeCo Hawthorn East                         Hawthorn East         VIC          11,310     $65,000,000              Jul-19       100% Undisclosed           $5,747      HomeCo                                      Fabcot Pty Ltd
Tooronga Village Shopping Centre             Glen Iris             VIC          8,973      $62,800,000              Jul-19       100%         7.22%         $6,999      Newmark Capital                             Stockland
Inala Plaza Shopping Centre                  Inala                 QLD         17,823       $57,350,000            Feb-19        100%         6.62%         $3,218      Chin Hong Investment Corporation            The Raptis Group
Coburg North Village                         Coburg North          VIC          6,283       $47,000,000            Apr-19        100%         4.70%         $7,481      Isaac Solomon                               Raymond Joe
Liverpool Plaza                              Liverpool             NSW          7,929      $46,000,000             Mar-19        100%         6.30%         $5,801      Private Investor                            Abacus Property Group
Coles Crows Nest                             Crows Nest            NSW          5,265       $43,000,000            May-19        100%         5.50%         $8,167      PGIM                                        PAYCE
North West Plaza                             Everton Park          QLD          9,489      $42,500,000             Jun-19        100%         7.64%         $4,479      Acure Asset Management                      EG Core Plus Fund
Cammeray Square                              Cammeray              NSW          4,756       $39,050,000            Oct-19        100%         7.63%         $8,211      Fortius Funds Management                    Stockland
Erindale Shopping Centre                     Wanniassa             ACT          4,997       $39,000,000            Dec-19        100%         6.37%         $7,805      Private investor                            Charter Hall Retail REIT
Arndale Shopping Centre                      Springwood            QLD          11,267      $35,500,000            May-19        100%         5.36%          $3,151     CVS Lane Capital Partners Pty Ltd           Trondage Pty Ltd
Willowdale Shopping Centre                   Denham Court          NSW          5,446       $34,800,000            Jun-19        100%         5.62%         $6,390      Private Investor                            Coles Group Property Developments
Trinity Village                              Alkimos               WA           6,081       $34,050,000             Jul-19       100%         5.84%         $5,599      Fagnani Group Pty Ltd                       Trinity Success Developments Pty Ltd
Mandurah Greenfields Shopping Centre         Greenfields           WA           5,918      $32,000,000             Nov-19        100%         5.69%         $5,407      Primewest                                   Fabcot Pty Ltd
Lennox Village                               Emu Plains            NSW         10,065       $31,500,000            Dec-19         50%         6.94%         $6,259      Challenger                                  Vicinity Centres
Pacific Pines Town Centre                    Pacific Pines         QLD          5,515       $30,810,000            Sep-19        100%         6.09%         $5,587      PGA Group                                   Stockland
Moonee Marketplace                           Moonee Beach          NSW         10,571      $30,500,000             Oct-19        100%          7.51%        $2,885      Primewest                                   Gowing Brothers
Amaroo Village                               Amaroo                ACT          4,594       $29,500,000            Nov-19        100%         6.25%         $6,421      Private Investor                            Coles Group Property Developments
									                                                                                                                                                               Clarence Property Group
Ormeau Shopping Centre Ormeau QLD 4,705 $29,000,000 Nov-19 100% 6.11% $6,164                                                                                            (Westlawn Property Trust)                   Canute Investments Limited
Katherine Central                            Katherine             NT            7,318      $28,900,000            Aug-19        100%         7.42%         $3,949      Private Investor                            Charter Hall Retail REIT
Stockland Kensington                         Kensington            QLD          6,002       $28,500,000            Apr-19        100%         6.73%         $4,748      Central Fair No.3 Pty Ltd (Yui Lin and Phyllis Lo) Stockland
Woolworths Banksia Grove                     Banksia Grove         WA            5,721      $27,280,000             Jul-19       100%         5.96%         $4,768      Private Investor                            Fabcot Pty Ltd
Greenacre Shopping Centre                    Greenacre             NSW          4,733       $26,535,000            Dec-19        100%         5.80%        $5,606       Harrington Property Group                   ISPT Retail Australia Property Fund
Woolworths Fairfield Heights                 Fairfield Heights     NSW          3,863       $23,800,000            Oct-19        100%         5.63%          $6,161     TAMIM                                       SCA Unlisted Fund 1
Continued next page.
RETAIL INVESTMENT REVIEW | ANZ        Introduction Key Findings   Major Transaction Overview NZ Overview   Debt Advisory Thought Leadership Detailed Transaction List Authors / Team                       A CAPITAL MARKETS PUBLICATION | 27

Retail Investment Transactions 2019
T R AN SAC T IO NS > $10 MILL I ON ( AUD )

Neighbourhood – continued
Centre                                       Suburb               State    GLAR M²           Sale Price        Sale Date       Stake      Cap Rate        $SP/m²       Purchaser                     Vendor
West Gosford Shopping Centre                 West Gosford         NSW          9,250      $23,000,000             Jun-19        100%            N/A        $2,486      Mintus                        ISPT (75%) & Coles Group (25%)
Kyneton Shopping Centre                      Kyneton              VIC          3,830       $22,850,000            Dec-19        100%         5.50%         $5,966      Lascorp                       Charter Hall Retail REIT
Woolworths Playford SC                       Munno Para           SA           6,390       $21,800,000            May-19        100%         7.40%         $3,412      Jagjit Gilhotra               Fabcot Pty Ltd
Cecil Hills Shopping Village                 Cecil Hills          NSW          3,089       $21,000,000            Jun-19        100%         5.96%         $6,798      Ngyuen                        Private Investor
Flagstone Village                            Flagstone            QLD          2,857       $20,480,000            May-19        100%         5.96%         $7,168      Guay Ng & Pang Koh            Wild Mint Properties
The Village at Margs                         Margaret River       WA           5,706      $20,000,000             Apr-19        100%         7.20%         $3,505      Perdaman Capital              Sirona Capital
SUPA IGA Doonside                            Doonside             NSW          4,402        $18,150,000           Mar-19        100%         5.32%         $4,123      Private Investor              Private Investor
Yarra Junction                               Yarra Junction       VIC          3,500       $18,000,000            May-19        100%         6.84%         $5,143      Sam Herszberg                 Zagame Family
Parkinson Plaza                              Parkinson            QLD          4,708       $17,500,000             Jul-19       100%         6.79%         $3,717      Hao Peng Zhang                Property Link
Woolworths Curlewis                          Curlewis             VIC          4,434        $17,100,000           Apr-19        100%         6.49%         $3,857      Peter Brukner & Diana Leigh   Fabcot Pty Ltd
North Albury Shopping Centre                 Lavington            NSW          3,949       $16,500,000            Aug-19        100%         6.21%         $4,179      Private Investor              Private Investor
Wattle Grove Shopping Village                Wattle Grove         WA           3,103       $16,300,000            Feb-19        100%         6.25%         $5,253      Mair Property Funds           Devwest
									                                                                                                                                                              Clarence Property Group
Logan Village Shopping Centre Logan Village QLD 3,172 $16,000,000 Nov-19 100% 5.73% $5,044                                                                             (Westlawn Property Trust)     Canute Investments Limited
										                                                                                                                                                                                           Fabsky Pty Ltd
Seacrest Shopping Centre Geraldton WA 4,713 $14,800,000 Jan-19 100% 7.25% $3,140 MPG Retail Brands Property Trust                                                                                    (Subsidiary of Fabcot Pty Ltd)
Rochedale Central                            Rochedale            QLD           1,841      $13,500,000             Jul-19       100%          7.11%        $7,333      Rochedale Central Pty Ltd     Silverstone Developments
Twin Parks Shopping Centre                   Tingalpa             QLD          1,629       $12,500,000            Apr-19        100%         6.37%         $7,673      Private Syndicator            Hambros Group
Total Neighbourhood Transaction Volume				 $1,488,405,000
You can also read