HERMES INVESTMENT MANAGEMENT - ESG Business Trip - Forum for Strategisk CSR
←
→
Page content transcription
If your browser does not render page correctly, please read the page content below

HERMES INVESTMENT MANAGEMENT
         ESG Business Trip

6 June 2019
For professional investors only
HERMES INVESTMENT MANAGEMENT

         INTRODUCTION

Magnus Kristensen, Director, Business Development, Nordics

For professional investors only
Hermes Investment Management
A diversified platform
                                                        Total AUM (millions)                      USD                  GBP                   EUR

      8%
              9%
                                                            Equity

                                                            Real Estate
                                                                                                24,306

                                                                                                 8,306
                                                                                                                     18,653

                                                                                                                      6,374
                                                                                                                                          21,647

                                                                                                                                           7,397
                                                                                                                                                              498 STAFF
                                                                                                                                                              Located in:
  9%      US$44.4bn
                                                                                                                                                                                 DUBLIN                    DENMARK
                                                            Infrastructure                       4,060                3,116                3,616
              £34.1bn               55%                                                                                                                                                                    FRANKFURT
              €39.5bn                                       Fixed Income                         3,709                2,846                3,303
    19%                                                                                                                                                                                                  LONDON

                                                            Private Equity                       4,022                3,087                3,582                   NEW YORK

                                                                                                                                                                                                   SINGAPORE

US$587.1                                  bn
                                                                                                                                                                216
£450.5bn / €522.9bn                                                                                                                                             Investment and
Under stewardship                                                                                                                                               stewardship staff

Please note the total AUM figure includes US$8.1bn / £6.2bn / €7.2bn of assets managed or under an advisory agreement by Herm es GPE LLP (“HGPE”), a joint venture between Hermes Fund Managers Limited ("HFM") and GPE Partner Limited.
HGPE is an independent entity and not part of the Hermes group. US$30.4m / £23.4m / €27.1m of total group AUM figure represen ts HFM mandates under advice. Source: Hermes as at 31 March 2019.

                                                                                                                                                                                                                                       2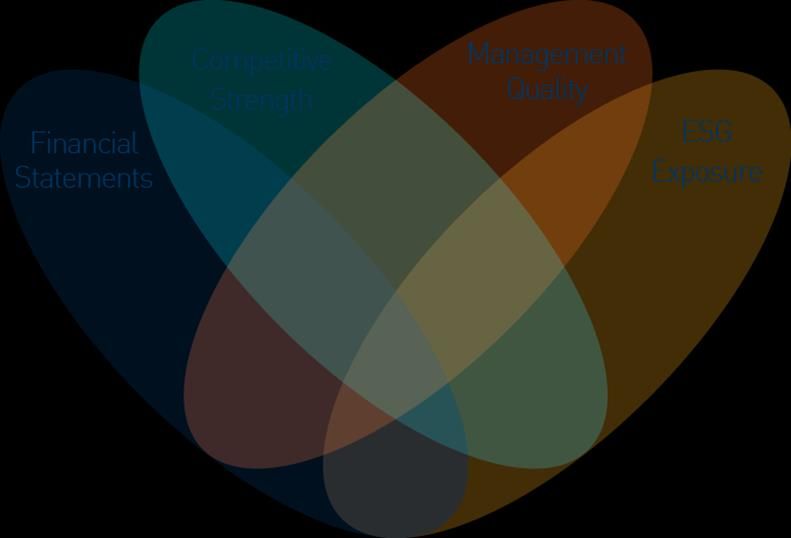
Hermes Investment Management
Award-winning

                               3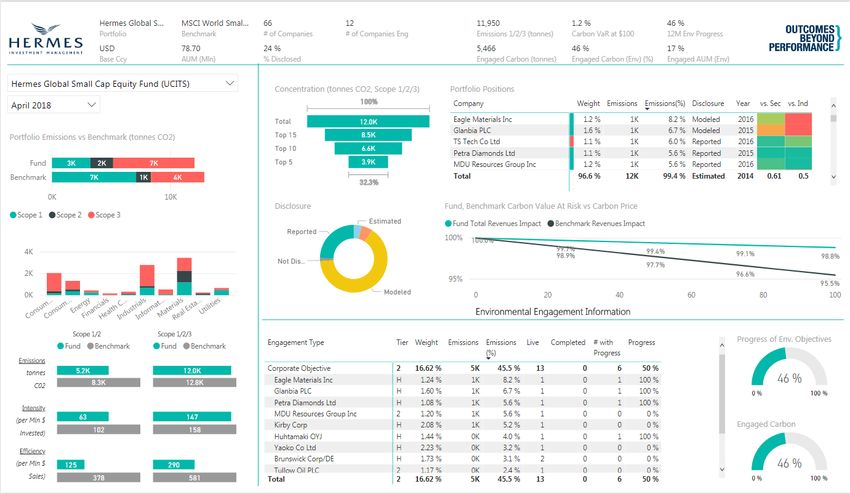
Our goal
To help people invest better, retire better and create a better society for all
    Active investment since 1983                                     Outcomes
    ► Providing investment and stewardship services to more than     ► Providing client-centric solutions in public and private
       550 clients worldwide                                            markets that aim to meet the risk/return objectives of long-
    ► Majority owned by Federated Investors, Inc., a leading
                                                                        term investors
       global investment manager, and minority owned by BTPS
       and Hermes’ Management
    ► A heritage that provides insight into the needs of long-term
       investors

    Access                                                           Stewardship
    ► Through our scale and co-investments with like-minded          ► World-leading engagement, voting and policy advocacy for
       investors, we improve access to private markets:                 global asset owners
       − Infrastructure                                              ► Integration of ESG insights into investment portfolios,
       − Private debt                                                   coupled with strong corporate engagement

       − Private equity
       − Real estate

                                                                                                                                       4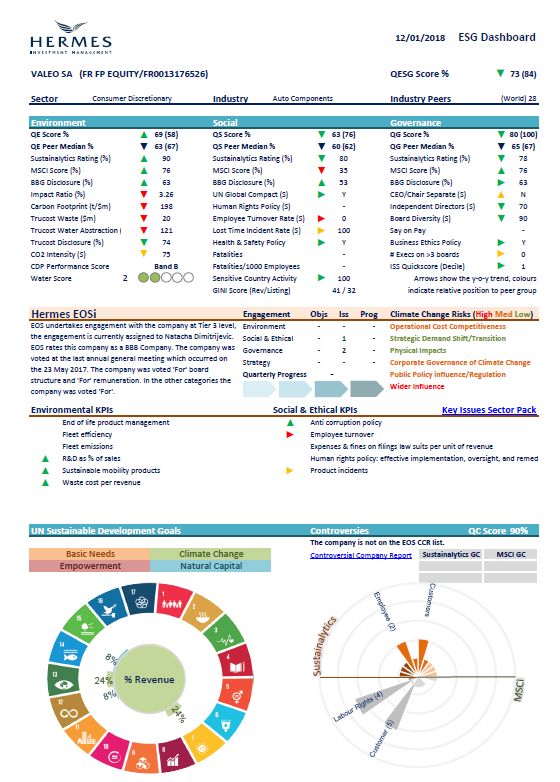
Investment strategies and stewardship services
                                                   1                                                     2                                           3                                        4

                                      LISTED EQUITIES                                 SPECIALIST FIXED INCOME                               PRIVATE MARKETS                              THEMATIC1

                                        Global Equities                                      Investment Grade                                   Real Estate                   Socially Responsible Investment
                                  Global Emerging Markets                                     Global High Yield                                Infrastructure                       ESG Driven Investing
                                         Asia ex Japan                                      Multi Strategy Credit                              Private Equity                         Impact Investing
                                      European Equities                                    Absolute Return Credit                                                               Impact through Engagement
     Strategies
                                      Smaller Companies                                        Direct Lending
                                     Impact Opportunities                                     Real Estate Debt
                                      SDG Engagement                                     Other unconstrained credit

       AUM                    US$24.3bn / £18.7bn / €21.6bn                            US$3.7bn / £2.8bn / €3.3bn                      US$16.4bn / £12.6bn / €14.6bn            US$6.4bn / £4.9bn / €5.7bn

                                                                                                                                 Responsible and sustainable investment   Tailored, specialist strategies designed to
  Approach to                     Investment process integrates ESG leveraging quantitative ESG analysis
                                                                                                                                   approach across all private markets                meet specific SRI,
  ESG Factors                                         and Hermes EOS engagement
                                                                                                                                              capabilities                   ESG and Impact-related objectives

 5                                                                       Investment insights generated by Hermes EOS through its range of active ownership services:

                                          Stewardship and stakeholder                                                  Public policy                                      Hybrid investment and
  Stewardship
                                             engagement services                                                        advocacy                                          stewardship mandates

                                                                                                             US$587.1bn / £450.5bn / €522.9bn

Source: Hermes as at 31 March 2019. 1 Thematic AUM is also included under equities, credit and private markets.

                                                                                                                                                                                                                        5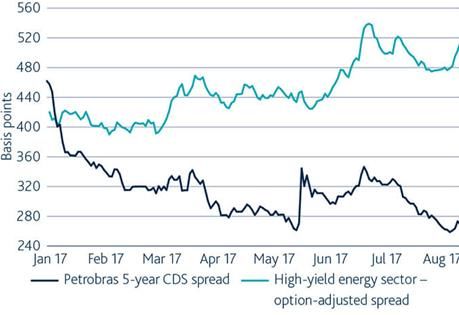
The Investment Office: Protecting clients’ interests
Independent teams supported by a robust and transparent risk framework

Specialist investment teams

Responsible for delivering    Clear and independent              Remuneration aligned with long-   Invested alongside clients
investment performance        philosophies and processes         term performance

                                 Investment Office
                                 ► Ensuring managers are always acting in clients’ interests
                                 ► Objectively challenging managers’ positions and views
                                 ► Providing independent performance and risk oversight
                                 ► Promoting a focus on risk-adjusted returns

                                                                                                                                6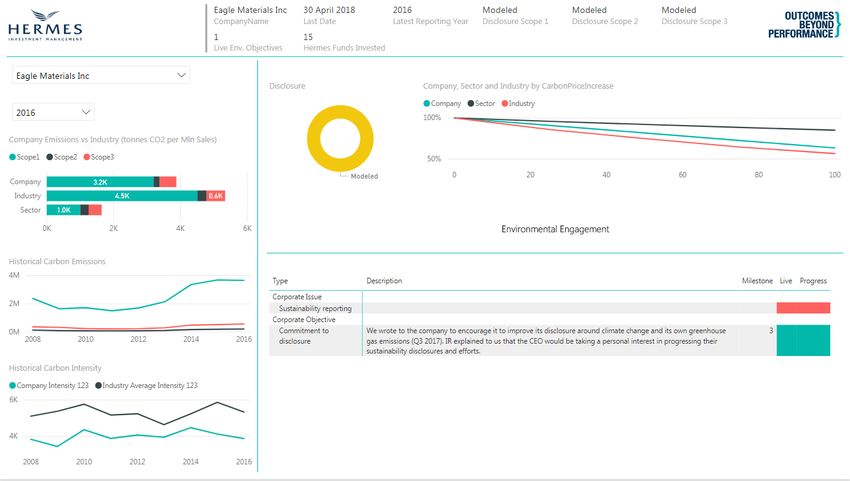
Hermes is majority owned by Federated Investors Inc.
Federated has honed its disciplined investment process over a half-century to deliver
style-consistent investment products
Federated offers broad product lines spanning domestic and       Federated key statistics
international equity, fixed income, alternative and liquidity
strategies with the goal of long-term, consistent, competitive
performance over time                                                   US$307.1m
                                                                             Q1 2019 revenue

Hermes minority ownership
► 29.5% owned by the BT Pension Scheme
► 10.5% owned by Hermes’ Management
                                                                       US$484.9bn
                                                                        Assets under management

                                                                                216
                                                                   Experienced investment professionals

Source: Federated as at 31 March 2019.

                                                                                                          7
HERMES INVESTMENT MANAGEMENT

         APPROACH TO ACTIVE OWNERSHIP AND
         ESG INTEGRATION

Dr Michael Viehs, Associate Director – ESG Integration
June 2019
For professional investors only
OUTCOMES BEYOND PERFORMANCE

                Our approach to holistic returns
                means we are committed to
                delivering excellent long-term
                investment performance and
                stewardship, while improving the
                lives of many

                                                   9
THE WHY?
10The Why of Responsible Investment
Reputation Risk Returns Wider impact
► Support beneficiaries’ beliefs and ► Management of ESG and other ► Sustainable long term financial ► Long term sustainability (including
ethics sustainable risks – when they are returns social and environment impact) of
relevant and material every investment
► Reputation management relative to − Positive stakeholder returns
beneficiaries and society more broadly ► Alignment of companies and policy leads to superior investment ► Incentivise positive externalities and
makers decisions to investors’ long returns and sustainable address negative externalities
term interests companies
► Affordability of goods and services
► Value leakage in investment chain − Value opportunities from
► Assist in creating a stable society
from beneficiaries to intermediaries investing in sustainable products
and services
Responsible investment and ownership provides the industry’s ‘social licence to operate’
Optimal approach for each investor will depend on the needs of its beneficiaries and key stakeholders and available resources
11The investment case for both ESG integration and
engagement is compelling
Extensive research shows that both drive enhanced returns
‘High Sustainability’ firms generate higher returns over the Engagement drives enhanced financial performance
long term
$25 8
7
Monthly adjusted return relative to
$20 6
5
Evolution of $1 invested
$15 4
engagement)
3
$10 2
1
$5 0
-1
$0 -2
1992
1993
1994
1995
1996
1997
1998
1999
2000
2001
2002
2003
2004
2005
2006
2007
2008
2009
2010
-1 0 1 2 3 4 5 6 7 8 9 10 11 12 13 14 15 16 17 18
Event Window (in months)
Low sustainability High sustainability
High All engagements All successful All unsuccessful
2012 study by Elroy Dimsona, Oğuzhan Karakaşb, and Xi Lic analyses an extensive
2014 study by Eccles, Ioannou, and Serafeim investigated the effect of corporate sustainability on organisational database of corporate social responsibility engagements with US public companies over
processes and performance using a matched sample of 180 US companies. 1999–2009 addressing environmental, social, and governance concerns.
High sustainability companies = those that voluntarily adopted sustainability policies by 1993. Low sustainability Engagements are followed by a one-year abnormal return that averages +1.8%, comprising
companies = those that adopted almost none of these policies. +4.4% for successful and zero for unsuccessful engagements.
Past performance is not a reliable indicator of future results.
12Delivering holistic returns
Our mission is to be the world's leading provider of long-term holistic returns and to
create value for all stakeholders in the financial system
Alongside investment performance, delivering our mission has three key elements:
Advocacy on investment industry to Our governance, colleagues and
Integration of engagement and ESG
further client interests and maintain processes putting the interest of
factors into investment strategies
market leadership clients and beneficiaries first
Why? In beneficiaries’ interests; differentiates Hermes;
profitable growth; employees benefit
13INVESTMENT INTEGRATION
14ESG and Engagement Integration
We offer a broad spectrum of ESG and engagement integration across our strategies
Engagement, stewardship and advocacy delivered by Hermes EOS
Exclusion based ESG Aware Integrated ESG ESG Momentum Impact
► SRI strategies ► Multi asset credit ► Real Estate ► Global equity ESG ► Impact Opportunities
► Low carbon ► Multi asset inflation ► Infrastructure ► SDG Engagement
► Direct lending ► Global equity ► Infrastructure
► Regional equity
► Liquid credit
► Environmental private
equity
Specific exclusions based on client Strategies take ESG and engagement Material ESG data and engagement Strategies use proprietary data to ESG data and proprietary
objectives factors into consideration, but do not insights are integral to the investment identify companies with improving engagement insights are central to
base decisions primarily on them process alongside other mainstream ESG credentials security selection
Customised mandates and
investment considerations
benchmarks created Engagement integral to generating Companies’ impact on UN SDGs
Engagement integral to generating value assessed and reported
value
Engagement integral to generating
value
15Hermes is a pioneer of ESG and engagement integration
We have been leveraging our market leading engagement capability to enhance our
investment performance for some time
Regular two-way dialogue
between engagement team &
portfolio managers sharing
respective insights – enhancing
investment decisions and
Public ESG data robustness of engagements
sources
Qualitative &
quantitative data
incorporating
Hermes EOS: Dedicated engagement insight
Portfolio Managers
stewardship team
► $38bn assets under management
► 26 engagement professionals
► 130+ investment professionals
► $400bn+ assets represented Hermes ESG analytics Proprietary ESG
► Equity, fixed income and private
► Engaging with 500+ companies tools
Extracting maximum markets
on 1,400+ objectives value from ESG data
Source: Hermes as at 31 March 2017.
16Our client-driven Engagement Plan 2019-2021
17Case study – Credit
Petrobras – integration and engagement in action
► Petrobras is among the largest integrated oil firms globally – it is 65% owned
by the Brazilian government
► Between 2008-14 it quadrupled its borrowing levels
► An official investigation, launched in 2009, uncovered a deep-seated bribery
culture and identified a lack of adequate corporate-governance mechanisms
► As far back as 2012 Hermes EOS had pressed for board changes at
Petrobras
► Since 2015, the company has begun to bolster its corporate-governance
framework
► Our engagement has expanded its subsidiaries and to cover its
commitments to environmental sustainability
► Petrobras’s new corporate strategy, which was revealed in September 2016,
emphasises debt reduction
► The enhanced governance and new strategy has resulted in Petrobras
Source: Barclays Live as at 11 August 2017.
spreads rallying despite industry weakness
The above information does not constitute a solicitation or offer to any person to buy or sell any related securities or fina ncial instruments.
18Poorly governed companies underperform
Performance by decile of governance ranking
Average monthly relative return (%)
0.2%
0.0%
Relative return
-0.2%
-0.4%
1 2 3 4 5 6 7 8 9 10
Decile
Good (or improving) governance Poor (or worsening) governance
Source: Hermes calculated using data from 31 December 2008 to 31 December 2017. Note: Calculation based on the monthly return of the Hermes proprietary ‘QG’ governance score, ranked by decile. Figures calculated using constituents of the
MSCI World index assuming monthly rebalancing.
19Global Equities – Activity
Integrating engagement and ESG into the investment process
Purchased Held Sold
Orsted (Denmark) Bank of America (United States) Tyson Foods (United States)
Danish Utility with a commitment to renewable energy Open and constructive dialogue with Hermes EOS Industry leader offering consistent growth at attractive
price
Legacy coal, oil & gas assets Management focused on responsible growth, including
low carbon financing Top contributor to performance over prior three years
Contributing to transition to low carbon economy
Review of pay and human capital management practices Despite positive ESG rhetoric and response to
show its responsible approach engagement, recurring ESG breaches prompted decision
to divest
Randgold Resources (UK) OMV (Austria) MTN Group (South Africa)
High quality gold miner Good progress on environmental policy with a specific Evasive to engagement attempts regarding data privacy
focus on greenhouse gases and disclosure in conflict regions
Industry with significant ESG risks – Randgold known as
best in class Strong risk policies in place to combat potential bribery Post divestment, received record fine for a telecoms
and corruption company
Positive engagement history around succession and
remuneration confirm commitment to responsibility ‘A’ rated in the 2015 CDP Climate Change survey
For illustrative purposes only. The above information does not constitute a solicitation or offer to any person to buy or sell any related securities or fina ncial instruments.
20Carbon scorecard examples
For illustrative purposes only.
21Carbon tool: Company analysis
22ACTING RESPONSIBLY AS A FIRM
23Responsibility Office
CEO Hermes Investment Management
Saker Nusseibeh
Head of Investment Head of Responsibility Head of Hermes EOS
(Chair of Hermes EOS)
Eoin Murray Hans-Christoph Hirt
Leon Kamhi
Investment Office Responsibility Office Hermes Equity Ownership Services
Research, Risk, Trading Advocacy and Hermes Policy (EOS)
Stewardship and Engagement Service Delivery
Investment Teams ESG and Engagement Integration Support/Tools
Voting and Engagement Operations Support
Corporate Citizenship
INVESTMENT DECISIONS POLICY AND ENGAGEMENT DELIVERY
24Behaving as a responsible firm
Walking the talk
► Behaving responsibly as a firm and as individuals is critical to our
being able to authentically and credibly deliver on our ambitions
► We are proud to have a strong culture of responsibility:
− All employees are invited to sign the Hermes Pledge
− Annual appraisals include equal weighting towards alignment
with Hermes Behaviours
− Independent oversight and robust governance
− Extensive corporate citizenship programme
25Hermes Corporate Citizenship Groups
“Creating a positive impact on our “Preserving our environment through
community” sustainable initiatives”
CHARITY
Hermes ACE offers range of community and charity initiatives OF THE YEAR Hermes EMS Group addresses environmental matters, policy and
procedural changes in order to minimise our environmental impact
providing volunteering opportunities to all staff. Employees are
entitled up to 2 CSR days to participate in these projects, subject and maintain ISO14001 accreditation.
At Hermes, a new charity is nominated and chosen
to line manager approval. by staff every year. Our charity for 2018 is:
For more info, please email Claire Munday
For more info, please email #Hermes ACE
40tude is a young, innovative and already successful charitable
organisation that is tackling colon cancer by raising funds to
“Promoting an open environment for people support pioneering research and promoting awareness via a
series of events and physical challenges throughout the year.
to be themselves” “Enriching our workplace through social
For more info, please email events”
Hermes is committed to treating everyone with whom we work fairly Marie Broad
and with dignity and respect. SPLASH offers a range of activities throughout the year, giving
Hermes Unity promotes an inclusive culture which allows everyone staff the opportunity to meet others from across the organisation in
to grow individually and also together as a strong and innovative a more informal setting.
organisation.
For more info, please email #SPLASH
For more info, please email #Hermes Unity
26Disclaimer
For professional investors only. This document does not constitute a solicitation or offer to any person to buy or sell any related securities, financial instruments or financial products. No action should be taken or omitted
to be taken based on this document. Tax treatment depends on personal circumstances and may change. This document is not advice on legal, taxation or investment matters so investors must rely on their own
examination of such matters or seek advice. Before making any investment (new or continuous), please consult a professional and/or investment adviser as to its suitability. Any opinions expressed may change. All figures,
unless otherwise indicated, are sourced from Hermes.
The value of investments and income from them may go down as well as up, and you may not get back the original amount invested. Any investments overseas may be affected by currency exchange rates.
Past performance is not a reliable indicator of future results and targets are not guaranteed.
The main entities operating under the brand ”Hermes” or “Hermes Investment Management” are: Hermes Investment Management Limited (“HIML”); Hermes Fund Managers Ireland Limited (“HFM Ireland”); Hermes
Alternative Investment Management Limited (“HAIML”); Hermes European Equities Limited (“HEEL”); Hermes Real Estate Investment Management Limited (“HREIML”); Hermes Equity Ownership Limited (“HEOS”);
Hermes GPE LLP (“Hermes GPE”); Hermes GPE (USA) Inc. (“Hermes GPE USA”) and Hermes GPE (Singapore) Pte. Limited (“HGPE Singapore”). HIML, HAIML and HEEL are each authorised and regulated by the
Financial Conduct Authority. HAIML and HIML carry out regulated activities associated with HREIML. HIML, HEEL, Hermes GPE and Hermes GPE USA are each a registered investment adviser with the United States
Securities and Exchange Commission (“SEC”). HGPE Singapore is regulated by the Monetary Authority of Singapore. HFM Ireland is authorised and regulated by the Central Bank of Ireland. HREIML and HEOS are
unregulated and do not engage in regulated activity.
Issued and approved by Hermes Investment Management Limited which is authorised and regulated by the Financial Conduct Authority. Registered address: Sixth Floor, 150 Cheapside, London EC2V 6ET. Telephone
calls will be recorded for training and monitoring purposes. Potential investors in the United Kingdom are advised that compensation may not be available under the United Kingdom Financial Services Compensation
Scheme.
BD03653
27LUNCH BREAK For professional investors only
HERMES GLOBAL EQUITIES
         ESG Business Trip

Louise Dudley, Portfolio Manager
6 June 2019
For professional investors only
The Why of Responsible Investment
Reputation Risk Returns Wider impact
► Support beneficiaries’ beliefs and ► Management of ESG and other ► Sustainable long term financial ► Long term sustainability (including
ethics sustainable risks – when they are returns social and environment impact) of
relevant and material every investment
► Reputation management relative to − Positive stakeholder returns
beneficiaries and society more broadly ► Alignment of companies and policy leads to superior investment ► Incentivise positive externalities and
makers decisions to investors’ long returns and sustainable address negative externalities
term interests companies
► Affordability of goods and services
► Value leakage in investment chain − Value opportunities from
► Assist in creating a stable society
from beneficiaries to intermediaries investing in sustainable products
and services
Responsible investment and ownership provides the industry’s ‘social licence to operate’
Optimal approach for each investor will depend on the needs of its beneficiaries and key stakeholders and available resources
30A compelling investment case
ESG integration and active ownership promotes positive change and enhances returns
‘High Sustainability’ firms generate higher returns over the Engagement drives enhanced financial performance
long term
$25 8
7
Monthly adjusted return relative to
$20 6
5
engagement)
Evolution of $1 invested
$15 4
3
$10 2
1
$5 0
-1
$0 -2
1992
1993
1994
1995
1996
1997
1998
1999
2000
2001
2002
2003
2004
2005
2006
2007
2008
2009
2010
-1 0 1 2 3 4 5 6 7 8 9 10 11 12 13 14 15 16 17 18
Event Window (in months)
Low sustainability High sustainability
High All engagements All successful All unsuccessful
2012 study by Elroy Dimsona, Oğuzhan Karakaşb, and Xi Lic analyses an extensive
2014 study by Eccles, Ioannou, and Serafeim investigated the effect of corporate sustainability on organisational database of corporate social responsibility engagements with US public companies over
processes and performance using a matched sample of 180 US companies. 1999–2009 addressing environmental, social, and governance concerns.
High sustainability companies = those that voluntarily adopted sustainability policies by 1993. Low sustainability Engagements are followed by a one-year abnormal return that averages +1.8%, comprising
companies = those that adopted almost none of these policies. +4.4% for successful and zero for unsuccessful engagements.
31ESG Integration
Approach depends on underlying drivers and philosophy
3. Application
1. Management 2. Research
(How is integration taking place?)
(Who is integrating ESG?) (What is being integrated?)
Source: Sustainalytics, IRRCi.
32Management
Who is integrating ESG?
► Whole company approach
► Having a vision on the benefits of integration
► Setting the tone from the top with a clear strategy to integrate ESG factors
► Integrated teams
► Responsibility with every individual
“To be the world's leading provider of long-term holistic returns for savers,
thus creating value for all stakeholders in the financial system”.
33Research
What is being integrated?
Quantitative Qualitative
► Proprietary rating integrating internal and external ► Fundamental company research on ESG using research
databases providers and primary sources
► Scorecard for all companies in investable universe ► Ongoing research on material ESG issues
► Portfolio analysis of all strategies
► Ongoing research on ESG factors’ performance
Looking at ESG in detail beyond external ratings to identify
concerns and potential for positive change
34Performance from ESG factors
Validating the philosophy
0.25 0.24 ► Proprietary ‘QESG score’ assesses a
company’s current ESG profile and how
it is changing
0.20
► Positive alpha from Environmental,
0.15 Social and Governance factors
0.15
%
► Result is supported by academic and
industry studies
0.09
0.10
0.05
-
Environmental Social Governance
The value of investments and income from them may go down as well as up, and you may not get back the original amount invested. Any investments overseas may be
affected by currency exchange rates. Past performance is not a reliable indicator of future results and targets are not guaranteed.
Source: Hermes Global Equities, 30 June 2018. Note: Monthly decile spread is the average difference in monthly return between companies ranked in the top 10% and companies ranked in the worst 10%. Figures calculated using constituents of
the MSCI World index assuming monthly rebalancing.
35Poorly governed companies underperform
Performance by decile of governance ranking
Average monthly relative return (%)
0.15
0.10
0.05
0.00
-0.05
%
-0.10
-0.15
-0.20
-0.25
1 2 3 4 5 6 7 8 9 10
Decile
Good (or improving) governance Poor (or worsening) governance
Source: Hermes calculated using data from 31 December 2008 to 30 June 2018. Note: Calculation based on the monthly return of the Hermes proprietary ‘QG’ governance score, ranked by decile. Figures calculated using constituents of the MSCI
World index assuming monthly rebalancing.
36Fusing fundamentals leads to consistency
Information ratio Effectiveness over time ► Historical back-test shows efficacy of
1.40 80.0% fundamentals with a proven economic
effect
1.20 70.0%
► Blend of factors leads to consistency
60.0%
1.00
− Increased Overall Information ratio
50.0%
0.80 − Increased Overall Effectiveness
40.0%
0.60
30.0%
0.40
20.0%
0.20 10.0%
0.00 0.0%
Overall Valuation Overall Valuation
Sentiment Growth Sentiment Growth
Profitability Capital Structure Profitability Capital Structure
Corporate Behaviour Corporate Behaviour
Source: Hermes. For the period September 2003 – February 2019.
37Application
How is integration taking place?
Relevant peer group
► Capture each company’s ESG characteristics and rank based on
sector KPIs
Analysing the level and change
► Analyse each company’s ESG exposures, and whether risks are
increasing or decreasing
► Using engagement to identify and create change
Portfolio assessment
► Aggregate ESG risks within portfolio, in absolute and relative terms
For illustrative purposes only.
38Keeping in mind the big picture
Being at the forefront of innovation
Challenges
► Be consistent with philosophy Who What How
► Level and change
► Data quality in addition to missing data
Setting the tone from
► Ongoing evolution of issues and data
the top with a clear Having clarity on Application through
► Progress and embedded culture strategy to integrate materiality use of tools
ESG factors
Active ownership
Long term thinking
39LATEST RESULTS
Companies with poor social practices underperform
Performance by decile of social ranking
Average monthly relative return (%)
        0.15

        0.10

        0.05

        0.00
 %

       -0.05

       -0.10

       -0.15

       -0.20

       -0.25
                            1                     2                     3                      4                     5                     6                     7                      8                     9                    10
                                                                                                                 Decile
                                Good (or improving) social factors                                                                                         Poor (or worsening) social factors

Source: Hermes calculated using data from 31 December 2008 to 30 June 2018. Note: Calculation based on the monthly return of the Hermes proprietary ‘QS’ social score, ranked by decile. Figures calculated using constituents of the MSCI World
index assuming monthly rebalancing.

                                                                                                                                                                                                                                              41
Consistent across sectors
Performance of companies with lowest governance and social rankings
Governance Social
Consumer Discretionary Consumer Discretionary
Consumer Staples Consumer Staples
Energy Energy
Financials Financials
Health Care Health Care
Industrials
Industrials
Information Technology
Information Technology
Materials
Materials
Real Estate
Real Estate
Telecommunication Services
Telecommunication Services
Utilities
Utilities
-0.60 -0.40 -0.20 0.00 0.20 0.40
-0.60 -0.40 -0.20 0.00 0.20 %
%
Source: Hermes Global Equities, 31 December 2008 – 30 June 2018. Average monthly relative return of companies ranked in decile 10 (%). Note: Calculation based on the monthly return of stocks with a Hermes proprietary ‘QG’ governance score
and ‘QS’ social score ranked in the bottom decile. Figures calculated using constituents of the MSCI World index assuming mon thly rebalancing.
42Consistent over time
Annual return of companies with lowest governance and social rankings
Governance Social
0.30 0.30
0.20 0.20
0.10 0.10
0.00 0.00
-0.10 -0.10
%
%
-0.20 -0.20
-0.30 -0.30
-0.40 -0.40
-0.50 -0.50
-0.60 -0.60
-0.70 -0.70
2009 2010 2011 2012 2013 2014 2015 2016 2017 2018 2009 2010 2011 2012 2013 2014 2015 2016 2017 2018
Source: Hermes calculated using data from 31 December 2008 to 30 June 2018. Note: Calculation based on the monthly return of the Hermes proprietary ‘QG’ governance score and ‘QS’ score. Figures calculated using constituents of the MSCI
World index assuming monthly rebalancing.
43Governance less important for hyper-growth
Relative return of companies ranked in decile 10 (%)
0.00
-0.05
%
-0.10
-0.15
-0.20
-0.25
Non Hyper-growth Hyper-growth
Environmental Social Governance
Source: Hermes calculated using data from 31 December 2008 to 30 June 2018. Note: Calculation based on the monthly return of the Hermes proprietary ‘QG’ governance score and ‘QS’ score. Figures calculated using constituents of the MSCI
World index assuming monthly rebalancing.
44Finding attractive companies
Pragmatism over perfection
Ideal
We look for attractively-valued companies with the following
characteristics:
► Impressive financial statements
► Competitive strength
► High-quality management
► Good or improving ESG exposure
Reality
► Because very few stocks provide this, we identify those with
the most attractive combinations of these characteristics and
the most compelling valuations
45Combining fundamentals aids consistency
Cumulative performance of Alpha Score and underlying factors
120
100
80
60
%
40
20
0
-20
2003 2004 2005 2005 2006 2007 2007 2008 2009 2009 2010 2011 2011 2012 2013 2013 2014 2015 2015 2016 2017 2017 2018
Capital Structure Growth Profitability Sentiment Valuation Corporate Behaviour Alpha
Past performance is not a reliable indicator of future results and targets are not guaranteed. Source: Hermes Global Equities.
46Leads to impressive long-term results
Hermes Global Equity Strategy performance Morningstar Peer Group1
120.00 Percentile rank
100.00 1 year 36
91.32 3 years 12
80.00 91.24
65.63 5 years 10
60.00
Since inception 4
%
40.00 42.32
20.00
0.00
-20.00
-40.00
-60.00
-80.00
2007 2008 2009 2010 2011 2012 2013 2014 2015 2016 2017 2018
Strategy MSCI World MSCI World - Value MSCI World - Growth
1 Morningstar peer group analysis as at 31 March 2019 using Global Large Cap Blend Equity and based on net of fees performance of the Hermes Global Equity Strategy. Past performance is not a reliable indicator of future results and targets are
not guaranteed. Chart source: Hermes and Bloomberg as at 31 March 2019. Returns quoted in USD, gross of fees. The information on this slide is based on a representative portfolio of the composite and is supplemental to the GIPS ® compliant
presentation that follows.
47Hermes Global Equity ESG Strategy
Monthly returns
Hermes Global Equity ESG Strategy gross returns
% 3 months 1 year 3 years2 5 years2 Since inception2
Hermes Global Equity ESG Strategy1 13.37 1.47 10.37 6.95 9.62
MSCI AC World (net WHT) 12.18 2.60 10.67 6.45 7.68
Relative return 1.19 -1.13 -0.30 0.50 1.94
1 Strategyinception 1 May 2013. 2 Annualised.
Past performance is not a reliable indicator of future results. Source: StatPro SC7 as at 31 March 2019. Performance shown is the Global Equity ESG Strategy USD gross of all costs and management fees. Rela tive calculated arithmetically.
The information shown is supplemental to the GIPS ® compliant composite presentation in the Appendix.
48Thermo Fisher
Market leader across a diverse array of products
Combination of attractive fundamentals Share price
300
Capital Structure
250
Corporate 200
Valuation
Behaviour
USD
150
100
50
Sentiment Growth
0
Jul 12
Jun 17
Aug 10
Nov 11
May 14
Mar 16
Dec 14
Aug 15
Nov 16
Sep 18
Apr 11
Feb 13
Feb 18
Apr 19
Oct 13
Profitability
► Competitive advantage from scale ► Positive social & environmental impact
► Meeting rising health care needs globally − Food & water safety
− Disease diagnostics
► 24% FY17 Revenue from EM or Frontier Markets (Source: Factset)
► Strong governance structures
Source: Hermes as at 30 April 2019. Thermo Fisher is currently held in the portfolio. This is not an offer or solicitation to buy or sell this security.
49Salesforce
Attractive growth & history of strong capital allocation
Combination of attractive fundamentals Share price
Capital Structure 180
170
160
USD
Valuation Corporate Behaviour 150
140
130
120
110
Sentiment Growth
100
Nov 18
Dec 18
Aug 18
Sep 18
Mar 19
Feb 19
Jun 18
Jul 18
Jan 19
Apr 19
May 18
Profitability
► Dominant market position ► At the forefront of ESG integration and
► Premium valuation
sustainability
► Strong management team
► Delivered growth >24% YOY for the last 5 years (Source: Factset)
Source: Hermes as at 30th April 2019. Salesforce is currently held in the portfolio. This is not an offer or solicitation to buy or sell this security.
Hermes Global Equities | June 2019 | 50Case study
Key issue identified: human rights
Performance
Supply
Controversies chain
Regulation
Policies & Programmes
Industry collaboration
Appropriate
Robust
Case studies board
processes
oversight
Governance
51APPENDIX
52Offering sustainable solutions
How far to push the needle on different degrees of sustainable investing?
3
Integrated
2 4
Aware Sustainable
1 5
Unaware Impact
3 = Integrated 4 = Sustainable 5 = Impact
► Conviction in the belief that ESG factors can have a ► Increasing priority on seeking “returns to society” ► Direct alignment between the purpose of product or
material impact on financial performance ► Tilt toward ESG leaders service of a company/project and a societal benefit
► Integrate ESG factors in the investment ► Bias toward companies that are “impactful” or have ► Positive change is clear, measurable, reportable
process/decisions ex-ante potential for change ► The principal purpose of engagement is to effect
► Engage on ESG factors that, in particular, could ► UN SDGs emerge as a reference for identifying, positive change on society
impact financial performance measuring, tracking and reporting change ► Not exclusively, but more commonly financed with
private capital
► Financial benefits are longer-term
53Embedded ESG
Sustainability focus is shared and connected across the organisation
Corporate Level Responsible investment ESG Integration
Founding signatory of UNPRI;
Sector & public policy engagement Strategy & policy targets
policy & strategy Promote best practice & influence the market provide guidance & structure
Driving responsibility A clear vision to unlock hidden value by all assets under management integrate to implement responsible investment
investing responsibly. ESG considerations. principles.
Portfolio Level Risk management
Managing aggregate exposures to ESG
Tracking ESG Risks
Portfolio ESG Monitor highlights the best &
Independent assessment
Regular meetings with Hermes EOS & the
Sustainability & responsible
investment tools integrated
Managing responsibly risks worst companies across our holdings Hermes Responsibility team to discuss throughout the investment
ESG risks process
Stock Level Stock Selection Systematic assessment Active ownership Combining insights from Hermes
Avoiding companies with unnecessary ESG ESG embedded in fundamental analysis Voting & engagement insights from Hermes EOS with specialist external
Investing responsibly risks & identifying companies undergoing via the QESG score & ESG Dashboard EOS along with controversial company research
positive change reports
54Identifying ESG strategies
We offer a broad spectrum of ESG and engagement integration across our strategies
Exclusionary screening Positive screening ESG integration Impact investing Active ownership
► Excluding entire sectors, ► Investing in companies ► The inclusion of ESG factors ► Investing in companies, ► Engaging with companies on
companies or countries from a demonstrating positive ESG alongside financial analysis of organisations and funds which ESG concerns that affect their
fund or portfolio based on performance relative to peers assets by investment have the commercial purpose long-term growth, and using
Definition ESG criteria, moral or ethical managers of solving social or shareholder power to
views, or religious beliefs environmental problems positively influence corporate
behaviour
► Align investors’ money with ► Achieve superior capital ► Improve long-term risk- ► Generate strong investment ► Promote positive change
their perception of ESG risk or appreciation by mitigating adjusted returns, mitigate returns by allocating to within companies that
broader beliefs ESG risks and acting on ESG risks companies creating tangible strengthens their financial
Objectives opportunities provided by benefits for society and the performance
► Mitigate ESG risks as investors ► Identify investment
exit ‘sin’ stocks, such as companies demonstrating opportunities created or environment that will endure ► Provide a forward-looking
tobacco or gambling good ESG behaviours supported by positive ESG over time view of ESG performance
companies change
► Hermes Global Equity ► Hermes Global Equity ESG ► All Hermes strategies integrate ► Hermes Impact Opportunities ► Hermes EOS
Hermes Screened ESG ESG, notably Global Emerging
product Markets
Source: Hermes as at February 2018.
55Biography
Louise Dudley, CFA
Portfolio Manager
10 years’ industry experience
Louise joined Hermes in March 2009 and leads the ESG and responsible investment research strategy within Global Equities for Hermes. Building on her experience developing factor
testing platforms and enhancing the factor modelling capabilities of the team’s systems, Louise has applied this comprehensive analysis to ESG applications. Having delivered research
supporting the returns from ESG integration, this has led to the creation of innovative customised product solutions and tools fulfilling client needs. Louise originally joined Hermes as a
member of the stewardship advisory business, Hermes EOS. Prior to Hermes she worked for Coca Cola in a financial accounting role, having graduated with a Master’s degree in
Engineering from the University of Durham. Louise holds the IMC and is a CFA charterholder. In 2017, she was named one of Financial News' Rising Stars of Asset Management.
Source: Hermes as at 31 March 2019
56Hermes Global Equity ESG
Composite: Hermes Global Equity ESG
Creation date: 13 August 2013 Inception date: 01 May 2013 All information is quoted in USD
Benchmark Composite Benchmark USD Total Composite
Year Gross of Fees Return Net of Fees Return Return 3-Yr St Dev (%) 3-Yr St Dev (%) No of Portfolios Composite Dispersion Assets (Million) % Total Firm Assets
2017 24.0 23.3 24.0 10.7 10.4Disclaimer
For professional investors only. This document does not constitute a solicitation or offer to any person to buy or sell any related securities, financial instruments or financial products. No action should be taken or omitted to be taken based on this
document. Tax treatment depends on personal circumstances and may change. This document is not advice on legal, taxation or i nvestment matters so investors must rely on their own examination of such matters or seek advice. Before making
any investment (new or continuous), please consult a professional and/or investment adviser as to its suitability. Any opinio ns expressed may change. All figures, unless otherwise indicated, are sourced from Hermes.
The value of investments and income from them may go down as well as up, and you may not get back the original amount invested. Any investments overseas may be affected by currency exchange rates. Past performance is
not a reliable indicator of future results and targets are not guaranteed.
The main entities operating under the brand ”Hermes” or “Hermes Investment Management” are: Hermes Investment Management Limi ted (“HIML”); Hermes Fund Managers Ireland Limited (“HFM Ireland”); Hermes Alternative Investment
Management Limited (“HAIML”); Hermes European Equities Limited (“HEEL”); Hermes Real Estate Investment Management Limited (“HREIML”); Hermes Equity Ownership Limited (“HEOS”); Hermes GPE LLP (“Hermes GPE”); Hermes GPE
(USA) Inc. (“Hermes GPE USA”) and Hermes GPE (Singapore) Pte. Limited (“HGPE Singapore”). HIML, HAIML and HEEL are each autho rised and regulated by the Financial Conduct Authority. HAIML and HIML carry out regulated activities
associated with HREIML. HIML, HEEL, Hermes GPE and Hermes GPE USA are each a registered investment adviser with the United States Securities and Exchange Commission (“SEC”). HGPE Singapore is regulated by the Monetary Authority
of Singapore. HFM Ireland is authorised and regulated by the Central Bank of Ireland. HREIML and HEOS are unregulated and do not engage in regulated activity.
Issued and approved by Hermes Investment Management Limited which is authorised and regulated by the Financial Conduct Author ity. Registered address: Sixth Floor, 150 Cheapside, London EC2V 6ET. Telephone calls will be recorded for
training and monitoring purposes. Potential investors in the United Kingdom are advised that compensation may not be availabl e under the United Kingdom Financial Services Compensation Scheme.
58THREE FOUNDATIONS FOR AN IMPACT
PROCESS: TAXONOMY, ASSESSMENT,
MEASUREMENT
Maxime Le Floch, Hermes Impact Opportunities
June 2019
For professional investors onlyThe Challenge: UN Sustainable Development Goals
6017 SDG’s, 169 targets and 244 indicators
Ambitious, complex and detailed
Targets Indicators
1.1. By 2030, eradicate extreme poverty for all people everywhere, currently 1.1.1. Proportion of population below the international poverty line, by sex, age, employment status and
measured as people living on less than US$1.25 a day geographical location (urban/rural)
1.2. By 2030, reduce at least by half the proportion of men, women and children of 1.2.1. Proportion of population living below the national poverty line, by sex and age
all ages living in poverty in all its dimensions according to national definitions
1.2.2. Proportion of men, women and children of all ages living in poverty in all its dimensions according to
national definitions
SDG 1.3. Implement nationally appropriate social protection systems and measures for
all, including floors, and by 2030 achieve substantial coverage of the poor and the 1.3.1. Proportion of population covered by social protection floors/systems, by sex, distinguishing children,
vulnerable unemployed persons, older persons, persons with disabilities, pregnant women, newborns, work-injury victims
and the poor and the vulnerable
1.4. By 2030, ensure that all men and women, in particular the poor and the
vulnerable, have equal rights to economic resources, as well as access to basic 1.4.1. Proportion of population living in households with access to basic services
services, ownership and control over land and other forms of property, inheritance,
natural resources, appropriate new technology and financial services, including 1.4.2. Proportion of total adult population with secure tenure rights to land, with legally recognized
microfinance documentation and who perceive their rights to land as secure, by sex and by type of tenure
1.5. By 2030, build the resilience of the poor and those in vulnerable situations and 1.5.1. Number of deaths, missing persons and persons affected by disaster per 100,000 people
reduce their exposure and vulnerability to climate-related extreme events and other
economic, social and environmental shocks and disasters 1.5.2. Direct disaster economic loss in relation to global gross domestic product (GDP)
1.5.3. Number of countries with national and local disaster risk reduction strategies
1.A. Ensure significant mobilization of resources from a variety of sources, including
through enhanced development cooperation, in order to provide adequate and
1.A.1. Proportion of resources allocated by the government directly to poverty reduction programmes
predictable means for developing countries, in particular least developed countries,
to implement programmes and policies to end poverty in all its dimensions
1.A.2. Proportion of total government spending on essential services (education, health and social protection)
1.B. Create sound policy frameworks at the national, regional and international
levels, based on pro-poor and gender-sensitive development strategies, to support 1.B.1. Proportion of government recurrent and capital spending to sectors that disproportionately benefit
accelerated investment in poverty eradication actions women, the poor and vulnerable groups
61The taxonomy process: an example
Directly Investable Theory of Change
SDG Goal SDG Target Impact risks
investable areas Issue Contribution
14: Conserve and 14.1 By 2025, Yes Waste collection As much as 40 per cent of the Recycling allows for a Working conditions
sustainably use the prevent and and recycling world oceans are heavily closed-loop system where of staff and
oceans, seas and significantly reduce affected by human activities, less resources are required contractors.
marine resources for marine pollution of all including pollution, depleted from the environment, thus Environmental
sustainable kinds, in particular fisheries, and loss of coastal limiting environmental impact of the
development from land-based habitats, while over three degradation. If managed recycling process.
activities, including billion people depend on sustainably scarce natural Disposal of non-
marine debris and marine and coastal biodiversity resources can benefit recyclable materials.
nutrient pollution for their livelihoods. Marine current and future
pollution such as plastic generations. While the
packaging in oceans, fertiliser OECD recycling average is
leaching into rivers etc. has a only 25%, countries such as
negative impact on marine Germany or Taiwan are
ecosystems, potentially able to achieve the highest
reducing biodiversity. recycling rates of above
55%.
62Translating SDGs into investment opportunities
Impact themes: the example of circular economy
3.9. Reduce deaths and illnesses from Materials re-use
air, water and soil pollution
Environmental services
8.4. Improve resource efficiency in
consumption and production
Waste collection and management
9.1. Develop sustainable and resilient
infrastructure Supply chain efficiency
9.4. Retrofit industries to make them
increase resource-use efficiency Recycling equipment
11.6. Reduce the adverse
Emissions control solutions
environmental impact of cities z
Pooled systems
12.2. Efficient use of natural resources
12.3. Halve food waste
Green chemicals
12.4. Achieve environmentally sound
management of chemicals
Plastics alternatives
12.5. Reduction of waste generation
14.1. Reduce marine pollution Sustainable forestry
15.2. Sustainable management of forests
Circular economy theme
63Translating SDGs into investment opportunities
Impact themes Improving access to quality
water supply and
preservation of the resource
Enhancing resource efficiency
and waste reduction
WATER
Ensuring a sustainable
CIRCULAR FOOD food supply and
productive farmlands for
ECONOMY SECURITY
future generations
Transforming the energy system
to power a low-carbon economy
ENERGY HEALTH & Improving life
TRANSITION WELLBEING expectancy and quality
PORTFOLIO
Providing opportunities
Providing crucial solutions and services IMPACT
EDUCATION for all – irrespective of
to impactful companies directly involved ENABLERS wealth, geographical
in the various themes
location or ability
FUTURE FINANCIAL
Improving vehicle efficiency to MOBILITY INCLUSION
increase low-carbon transportation
Providing financial services to
underserved populations
64Impact assessment
Identification and analysis of the impacts of potential portfolio holdings
Nature How is the company contributing meaningfully to the SDGs?
Is the delivery of positive impact core to the business model
Intentionality
now and/or in the future?
How is the company generating an impact that would not
Additionality
happen otherwise?
Is there a favourable balance between the company’s
Balance
positive and negative impacts?
Improvement What is the company doing to improve its net impact?
65Impact measurement
Robust measurement and monitoring of company impacts
► Theme metrics provide consistency
Widely accepted, standardised IRIS metrics applied to all companies within an impact theme enable aggregation at theme level
► Company-specific metrics allow for flexibility
Metrics vary on a company-by-company basis and allow idiosyncratic impacts to be captured
► Theory of change links corporate outputs to systemic impacts
Detailed evidence of positive change achieved by portfolio companies for people and the planet
Example: Kroton Educacional
Theme metrics Theory of change Impact
Access to high-quality education is the driving force behind sustainable
Total school Teachers economic growth and poverty reduction.
enrolments employed
Kroton's higher education services, both on-campus and via its distance
learning segment, primarily cater to students who otherwise would not be
able to study at all. Through the provision of higher education services,
Kroton targets two broad outcomes: to increase their students' employability
Company-specific metrics and income growth after graduation and expand access to higher education
for low-income students as well as rural Brazilians. An indirect outcome is its
employment of teaching staff. These three outcomes strongly address SDG 4
Higher
Indicator of – quality education – which calls for an 'increase in the supply of qualified
education:
Differences teachers' to 'ensure that all learners acquire the knowledge and skills
income
effect needed to promote sustainable development’, and to 'raise the number
of youth and adults with the relevant skills for decent employment'.
Source: Hermes. The above information does not constitute a solicitation or offer to any person to buy or sell any related se curities or financial instruments.
66Long-term sustainability validation
Fundamental drivers of corporate performance with a focus on sustainability
Investment for future growth
Sustainably run companies should invest in their people, their assets and
research to grow organically
Real economic returns
Over the long term, strongly positive returns and free cash flows are required
Distribution of value Long-term
A healthy balance between the repartition of value created between sustainability
shareholders, management and employees validation
Long-term vision
Management and board should commit to a long-term strategic vision
Earnings quality
Earnings that reflect cash flows without being excessively distorted by
accounting choices
67Important information
For professional investors only. This document does not constitute a solicitation or offer to any person to buy or sell any related securities, financial instruments or financial products. No action should be taken
or omitted to be taken based on this document. Tax treatment depends on personal circumstances and may change. This document is not advice on legal, taxation or investment matters so investors must rely on
their own examination of such matters or seek advice. Before making any investment (new or continuous), please consult a professional and/or investment adviser as to its suitability. Any opinions expressed may
change. All figures, unless otherwise indicated, are sourced from Hermes.
The value of investments and income from them may go down as well as up, and you may not get back the original amount invested. Any investments overseas may be affected by currency
exchange rates. Past performance is not a reliable indicator of future results and targets are not guaranteed.
The main entities operating under the brand ”Hermes” or “Hermes Investment Management” are: Hermes Investment Management Limited (“HIML”); Hermes Fund Managers Ireland Limited (“HFM Ireland”);
Hermes Alternative Investment Management Limited (“HAIML”); Hermes European Equities Limited (“HEEL”); Hermes Real Estate Investment Management Limited (“HREIML”); Hermes Equity Ownership
Limited (“HEOS”); Hermes GPE LLP (“Hermes GPE”); Hermes GPE (USA) Inc. (“Hermes GPE USA”) and Hermes GPE (Singapore) Pte. Limited (“HGPE Singapore”). HIML, HAIML and HEEL are each
authorised and regulated by the Financial Conduct Authority. HAIML and HIML carry out regulated activities associated with HREIML. HIML, HEEL, Hermes GPE and Hermes GPE USA are each a registered
investment adviser with the United States Securities and Exchange Commission (“SEC”). HGPE Singapore is regulated by the Monetary Authority of Singapore. HFM Ireland is authorised and regulated by the
Central Bank of Ireland. HREIML and HEOS are unregulated and do not engage in regulated activity.
Issued and approved by Hermes Investment Management Limited which is authorised and regulated by the Financial Conduct Authority. Registered address: Sixth Floor, 150 Cheapside, London EC2V 6ET.
Telephone calls will be recorded for training and monitoring purposes. Potential investors in the United Kingdom are advised that compensation may not be available under the United Kingdom Financial Services
Compensation Scheme
BD03653
68Hermes Investment Management We are an asset manager with a difference. We believe that, while our primary purpose is to help savers and beneficiaries by providing world class active investment management and stewardship services, our role goes further. We believe we have a duty to deliver holistic returns – outcomes for our clients that go far beyond the financial – and consider the impact our decisions have on society, the environment and the wider world. Our goal is to help people invest better, retire better and create a better society for all. Our investment solutions include: Private markets Infrastructure, private debt, private equity, commercial and residential real estate High active share equities Asia, global emerging markets, Europe, US, global, small and mid-cap and impact Credit Absolute return, global high yield, multi strategy, global investment grade, unconstrained, real estate debt and direct lending Stewardship Active engagement, advocacy, intelligent voting and sustainable development Offices London | Denmark | Dublin | Frankfurt | New York | Singapore For more information, visit www.hermes-investment.com or connect with us on social media:
You can also read