Financing and investment trends - The European wind industry in 2020 - POLITICO Europe
←
→
Page content transcription
If your browser does not render page correctly, please read the page content below
1
                                              02
                                           il 2
                                             r
                                          Ap
                                    13
                          til
                        un
     Subtittle if needed. If not MONTH 2018
                Published in Month 2018
                O
             RG
          BA
     EM

                   Financing and
 R
DE

               investment trends
UN

                        The European wind industry in 2020
UN
  DE
     R
         EM
           BA
              RG
                 O
                     un
                       til
                             13
                                  Ap
                                     ril 2
                                          02
                                             1
1
                                          02
                                        il 2
                                          r
                                       Ap
   Financing and
                                  13
 investment trends       til
                       un
     The European wind industry in 2020
                Published April 2021
               O
            RG
         BA
     EM
 R
DE
UN

               windeurope.org
1
02
il 2
This report summarises financing activity across the European wind energy sector from 1 January to 31
r
December 2020. Unless stated otherwise the data and analysis covers the 27 EU Member States and
Ap
the following countries: Belarus, Georgia, Kosovo, Montenegro, Norway, Russia, Serbia, Switzerland,
Turkey, the UK and Ukraine.
The report includes investment figures for the construction of new wind farms, refinancing transactions
for wind farms under construction or operation, project acquisition activity, company acquisitions and
capital market financing. Rounding of figures is at the discretion of the author.
13
New asset figures pre-2020 have been restated from previous publications.
DISCLAIMER
This publication contains information from external data providers. Neither WindEurope, nor its
til
members, nor their related entities are, by means of this publication, rendering professional advice or
services. Neither WindEurope nor its members shall be responsible for any loss whatsoever sustained
by any person who relies on this publication.
un
O
RG
BA
EM
TEXT AND ANALYSIS:
WindEurope Business Intelligence
Guy Brindley, WindEurope
R
Daniel Fraile, WindEurope
DE
EDITORS:
Rory O’Sullivan, WindEurope
DESIGN:
Laia Miró, WindEurope
UN
INVESTMENT DATA:
Clean Energy Pipeline
IJ Global
All currency conversions made at EURGBP 0.88970 and EURUSD 1.1422.
Figures include estimates for undisclosed values
PHOTO COVER:
© Joerg Steber / Shutterstock
MORE INFORMATION:
policy@windeurope.org
+32 2 213 18 681
02
il 2
CONTENTS
r
EXECUTIVE SUMMARY.................................................................................................... 7
Ap
WIND ENERGY FINANCE BASICS................................................................................ 10
1. INVESTMENT NUMBERS IN 2020......................................................................... 14
13
1.1 Wind energy investments.................................................................................. 14
1.2 New asset financing............................................................................................ 15
til
1.3 New asset finance per country........................................................................ 20
un
2. SOURCES OF FINANCE IN 2020........................................................................... 23
2.1 Corporate and project finance........................................................................ 23
O
2.2 Non-recourse debt.............................................................................................. 25
RG
2.3 Green bonds.......................................................................................................... 28
2.4 Project acquisitions............................................................................................. 29
2.5 Corporate renewable PPAs.............................................................................. 30
BA
3. WIND ENERGY FINANCE POLICY ........................................................................ 35
EM
3.1 Fit for 55................................................................................................................. 35
3.2 Revenue stability................................................................................................. 36
3.3 Permitting.............................................................................................................. 38
R
3.4 Recovery and resilience plans.......................................................................... 38
DE
3.5 National and international development banks......................................... 40
3.6 Sustainable finance............................................................................................ 41
UN
GLOSSARY........................................................................................................................... 421
02
r il 2
Ap
13
til
un
O
RG
BA
EM
R
DE
UN
6 Financing and investment trends – The European wind industry in 2020
WindEurope1
02
EXECUTIVE
il 2
SUMMARY
r
Ap
13
Despite the challenging circumstances brought about by wind investments was the lowest amount since 2017. This
COVID, Europe invested €42.8bn in new wind farms in is mainly due to delays in the permitting of new onshore
2020, the second highest annual amount on record. wind farms in many countries in Europe.
Investments in offshore wind farms were a record
til Wind energy remains an attractive investment, and there
un
€26.3bn, which financed 7.1 GW of new offshore capacity. is plenty of capital available to finance it. But it is critical
Investments in new onshore wind farms were €16.5bn, that both EU and national economic recovery plans are
which financed 12.5 GW of new onshore capacity. aligned with the European Green Deal and help to accel-
erate the transition to a low-carbon energy system.
O
The figure of €26.3bn in offshore wind investments was
a new record. However, the figure of €16.5bn in onshore
RG
FIGURE 1
New asset finance in wind energy 2011 – 2020 (GW and €bn)
20.2 19.6
BA
50
20
45
16.4
40 15.8 Capacity Financed (GW)
14.7
14.1 22.1 13.6
35 13.2 15
Investment (€bn)
EM
30 11.5 11.4 26.3
12.5
25 12.9 10
10.7
7.2 9.7 6.6
20 2.8 6.1
15
R
5
10
DE
5 18 18 17.9 18 23.2 24.7 15.2 16.9 17.9 16.5
0 0
2011 2012 2013 2014 2015 2016 2017 2018 2019 2020
UN
Onshore wind (€bn) Offshore wind (€bn) Total new capacity financed (GW)
Source: WindEurope
Financing and investment trends – The European wind industry in 2020 7
WindEuropeExecutive Summary
2020 highlights • Germany (€2.2bn) and France (€1.8bn) invested the
most in onshore wind, although these amounts were
• Europe invested €42.8bn in the construction of new lower than in previous years.
1
wind farms. This was 75% more than 2019 and the
02
second highest amount on record (after 2016). • Northwest Europe accounted for €36.3bn of the
investments in new wind farms, approximately 85%
• The €42.8bn covered 19.6 GW of new capacity: of the total.
il 2
12.5 GW of onshore wind capacity and a record
7.1 GW of offshore wind capacity.
Investment trends
r
• Investments in new offshore wind projects were
Ap
worth a record €26.3bn. • With interest rates likely to stay low in the medium
term and a large number of lenders looking to invest
• The €16.5bn invested in new onshore wind farms was in wind, the conditions for financing wind farms
less than in previous years. It was the lowest figure should remain favourable.
13
for investment in new onshore projects since 2017.
• 66% of the capital raised for new wind farms was on
• Banks extended a record €27.8bn in non-recourse a project finance basis. The other 34% was corporate
debt for the construction and refinancing of wind financed.
farms. This continues the general trend of increased
activity in this area since 2013.
til • Debt remains instrumental in wind energy financing
un
with non-recourse debt providing 50% of all capital
• Non-recourse debt accounted for 36% of all raised for new wind energy projects.
investment in new onshore and 58% of all investment
in new offshore wind farms, highlighting the • Despite short-term market uncertainties, Interest
O
importance of banks in wind energy financing. rate premiums are continuing to fall for offshore wind
financing.
RG
• The debt ratio for new wind farms financed on a
project finance basis remains at 70-90%. • 2020 was a record year for corporate renewable
PPAs. The cumulative renewable capacity in Europe
• Project acquisitions, where investors purchase a now under a corporate PPA rose by 50% to 12 GW.
BA
share of a wind farm (in development or operating), There were 18 new PPAs signed with onshore wind
were worth €15.1bn. This was slightly lower than in farms and 6 with offshore wind farms.
2018 and 2019.
• Permitting continues to be the main bottleneck for
EM
the financing and construction of onshore wind in
Country highlights Europe. Wind energy will not be able to deliver its
share of the 2030 climate targets if this problem is
• The UK invested the most in new wind farms in 2020, not addressed.
€13.5bn, followed by the Netherlands which invested
R
€7.9bn.
DE
• The record amount invested in the UK was largely the
result of the financing of Dogger Bank phases A&B
for €9.4bn. This will allow for the construction of
UN
2.4 GW out of the 3.6 GW wind farm, the largest
wind farm in Europe to date.
8 Financing and investment trends – The European wind industry in 2020
WindEuropeExecutive Summary
Policy highlights
• The EU is committed to climate neutrality by 2050
1
and 55% reductions on greenhouse gas (GHG)
02
emissions from 1991 levels by 2030.
• To achieve the 2030 GHG target the EU needs to
il 2
install 27 GW of new wind farms a year between
2021 and 2030. As things stand, we expect to install
only 15 GW a year over each of the next 5 years.
r
Ap
• The problem is not finance, provided government
design their wind energy auctions in the right way.
The problem is the number of new projects coming
through. Solving permitting delays is the top priority.
13
• Governments need urgently to simplify permitting
rules and procedures for new wind farms. They also
need to improve staffing levels at the permitting
authorities - and should consider using their
Recovery and Resilience Plans (RRPs) to support this.
til
un
O
RG
BA
EM
R
DE
UN
Financing and investment trends – The European wind industry in 2020 9
WindEuropeWIND ENERGY
FINANCE BASICS
1
02
r il 2
Ap
13
Debt and equity Corporate finance and project finance
The two main sources of capital in European wind energy The proportion of debt and equity in a project, as well
finance have been sponsor equity and debt. Sponsor equity as the way they are used, will determine the capital or
refers to a traditional equity investor, typically the owner(s)
of the project and/or the developer. Equity capital faces
tilfinancial structure of the project. There are two types of
financial structures: corporate finance and project finance.
un
the highest risk in the project, because the owners are In a corporate finance structure, investments are carried
the party responsible for bringing the initial concept idea out on the balance sheet of the owners and project spon-
through development, construction and commercial oper- sors. Debt is raised at corporate level, with the lenders
ation. In addition, the owners are also the last investors to having recourse to all the assets of the company to liqui-
O
be liquidated in case of a project default. Because of the date a non-performing project. The project management
tough requirements that equity capital faces, the returns and many of the contractual obligations are internalised
RG
are also higher. with the owners and project sponsors. Corporate finance
is therefore quicker and usually less expensive than project
Debt refers to a contractually-arranged loan that must finance.
be repaid by the borrower. The lender has no ownership
BA
shares in the company or project. However, it has some In a project finance structure, typically called non-recourse
collateral coverage as a financial protection in case the finance, the investment is carried off the balance sheet
project is unable to meet the debt repayment schedule. of the original owners and project sponsors. The invest-
In the case of project default, the lenders are the first ment or the project is turned into a separate business
EM
party to be liquidated, before equity-type investors. As entity called a Special Purpose Vehicle (SPV) with its own
such, debt is generally considered a lower-risk investment management team and financial reporting, capable of
and therefore comes with lower-cost financing compared raising debt on its own. Because debt is raised at project
with equity. level, the lenders do not have recourse to the company
assets of the owners and project sponsors in cases of
R
There are two major types of debt in wind energy finance project default. Due to increased contractual obligations
- construction debt and refinancing debt. Construction and a more sophisticated risk management structure,
DE
debt is raised for the purpose of financing new assets. project finance can be more expensive and can take longer
Refinancing debt is raised for the purpose of financing to finalise than corporate finance.
construction debt at a longer maturity and/or lower
UN
interest rate. Debt-to-equity ratios in a project finance transaction may
vary considerably depending on the project specifics,
10 Financing and investment trends – The European wind industry in 2020
WindEuropeWind Energy Finance Basics
availability of capital and risk profile of the project owners. Unlike utilities, independent power producers with smaller
For wind projects, they range between 70-80% debt and balance sheets and companies whose primary business is
20-30% equity. not wind energy have better project finance capabilities.
1
In a project finance structure, partnerships are key from
02
A company’s capital structure will be determined by its a very early stage. Fundraising will occur at project level,
particular risk profile, size and industry sector. Power through debt and equity vehicles alike. Project owners
producers and utilities with a large balance sheet will typi- will need to form consortia to provide the required equity
il 2
cally opt for a corporate finance structure and bring the whereas lenders will come together to provide syndicated
project through construction as a single player. Fundraising project loans on the debt side.
will occur at corporate level through debt and equity vehi-
r
cles alike.
Ap
FIGURE 2
Corporate Finance vs. Project Finance
13
CORPORATE PROJECT
FINANCING FINANCING
EQUITY
INVESTOR
DEBT
PROVIDERS
til PROJECT
SPONSOR(S)
EQUITY
INVESTOR
DEBT
PROVIDERS
un
SPECIAL
O
PROJECT PURPOSE
SPONSOR VEHICLE (SPV)
INVESTMENT
RG
CASH FLOWS
WIND ENERGY WIND ENERGY
PROJECT PROJECT
FINANCING
BA
ANALYSIS
EM
CORPORATE CORPORATE PROJECT PROJECT
FINANCE: FINANCE: FINANCE: FINANCE:
EQUITY DEBT EQUITY DEBT
R
CORPORATE PROJECT
FINANCE FINANCE
DE
NEW ASSET INVESTMENTS
UN
Source: WindEurope
Financing and investment trends – The European wind industry in 2020 11
WindEuropeWind Energy Finance Basics
Raising debt and equity Capital availability for wind power projects
The project owners and sponsors can raise capital for The financial markets have supported the growth of the
1
project development from different sources. These may wind sector with a strong liquidity on both debt and
02
include own-balance sheet financing, external private equity. The financing conditions of low interest rates, cost
investors, funding from commercial banks and public improvements and increased trust in the technology all
capital markets. The latter in particular has become more contribute to a healthy deal flow of projects.
il 2
prominent for raising both debt and equity in wind energy
financing. Debt liquidity has been available from construction
phase with new financing and refinancing transactions
r
Debt is usually raised through the issuance of bonds either in major markets. Lenders include a variety of bank and
Ap
at corporate or project level. Where a bond is issued at non-bank institutions such as Export Credit Agencies
corporate level, the proceedings go towards financing (ECAs). Multilateral Development Banks (MDBs) and
a portfolio of projects. The bond can carry the ‘green’ other International Financial Institutions (IFIs) have also
label when the portfolio of projects it is financing is made provided debt liquidity where commercial bank financing
13
exclusively of renewable energy investments. Where the has not been available. International banks have also
bond is issued at project level, the proceedings are used strengthened their presence in the European wind sector
for the specific renewable energy project and are there- and introduced more competition to the sector. Japanese
fore ‘green’. Project bonds are issued on behalf of the SPV banks, driven by a prolonged low –interest rate environ-
and are usually part of a non-recourse, project finance
structure.
til ment in their domestic market, feature prominently in the
top lending institutions for European wind power projects.
un
A bond is considered investment grade if its credit rating is On the equity side, institutional investors are also bidding
a minimum of BBB by Standard & Poor’s or a minimum of more aggressively for wind assets. Interest in the technology
Baa3 by Moody’s. Investment grade bonds are considered has picked up significantly both from institutional and stra-
O
by rating agencies as likely to meet payment obligations tegic investors who are now looking at wind projects for
for investors. steady, predictable returns to meet long-dated liabilities.
RG
Much like the banks, investor appetite for the technology
applies to both greenfield and existing assets. However, as
confidence in wind grows the positive track record of the
industry continues, investors are also targeting more green-
BA
field projects earlier in the construction phase.
SUMMARY
EM
• Projects can be financed on the balance sheet of a company – corporate finance
• Capital can be raised with equity (issuing company shares) or debt (bonds issued by the company), the
proceeds of which can be used to develop a wind farm
R
• Projects can also be made into a “company” in their own right with a Special Purpose Vehicle (SPV) structure –
DE
project finance
• Capital can be raised with equity (issuing shares in the project) or debt (banks lend to the project on a
UN
non-recourse basis), the proceeds of which can be used to develop the wind farm
• Debt is repaid from project revenues. If the project fails to repay the debt, banks do not have recourse to the
project sponsors’ assets for compensation, only the assets of the project itself
12 Financing and investment trends – The European wind industry in 2020
WindEuropeWind Energy Finance Basics
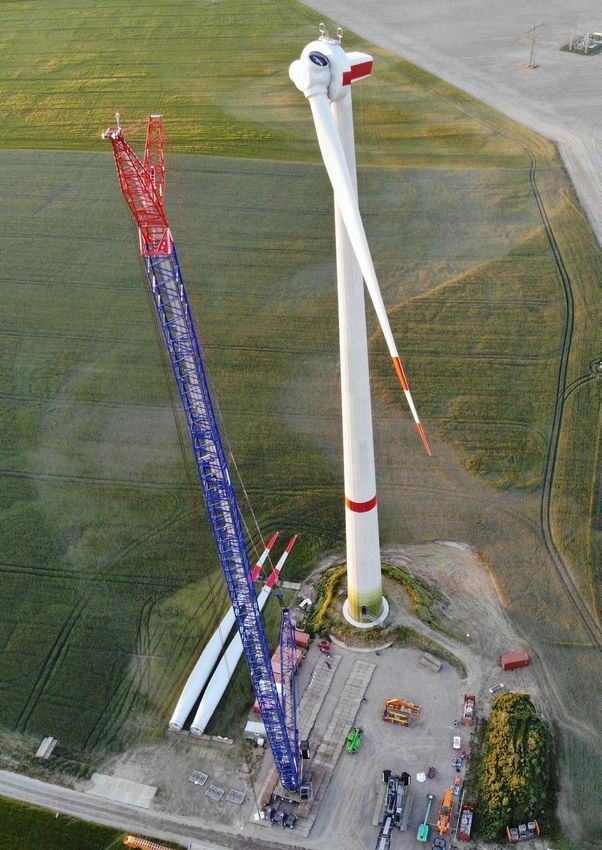
FIGURE 3
Example of financing structure for typical offshore wind farm
EXAMPLE OF FINANCING STRUCTURE
1
FOR TYPICAL OFFSHORE WIND PROJECT
02
il 2
252 MW 31 Turbines €1.3bn
r
Ap
ADVISORS
Financial, legal
13
& technical
LENDERS EQUITY INVESTOR
10 at financial close Northland Power
75% of project cost ~€988m 25% of project cost ~€310m
til
un
debt
repayment equity
debt finance dividends
O
Loan agreements Shareholders’ agreement
RG
Construction contract Wind Energy PPA contract
Company
payment for payment for
construction electricity
BA
Turbines and O&M services
Grid connection contract
payment for
contractors
EM
CONSTRUCTION OFFTAKER
Van Oord Vattenfall
R
O&M CONTRACTORS GRID CONNECTION
Vestas Wind Systems TenneT
DE
ADVISORS
UN
Financial, legal
& technical
Source: Green Giraffe
Financing and investment trends – The European wind industry in 2020 13
WindEurope1.
1
02
INVESTMENT
il 2
NUMBERS
r
Ap
IN 2020
13
til
un
1.1 WIND ENERGY INVESTMENTS
O
FIGURE 4
European wind energy investments in 2020 per asset class (€bn)
RG
45 42.8
Investment Amount (€bn)
40
35
BA
30
25
20
EM
15.1
15
9.9
10 6.5 6.3
5
0
R
New asset financing Refinancing Project acquisitions Company Capital markets
acquisitions
DE
Source: WindEurope
With €42.8bn in investments, new asset financing New wind farms investments were up 75% compared with
UN
accounted for more than half of all wind energy invest- the €24.5bn raised in 2019. The main driver for growth
ments. In total, there was more than €80bn of financing was the record year for offshore financing. The €26.3bn
activity in the wind energy sector in 2020. invested in new offshore wind farms should lead to a new
14 Financing and investment trends – The European wind industry in 2020
WindEuropeInvestment numbers in 2020
capacity build out of 7.1 GW over the next few years. record highs with significant investments including
With 12.5 GW of onshore capacity financed, there was a Iberdola’s acquisition of an 8.1% share in Siemens Gamesa
total of 19.6 GW of new wind projects financed in 2020, Renewable Energy (SGRE), Vesta’s acquisition of Mitsubishi
1
the second highest figure in a single year after a record Heavy Industries’ share of MHI Vestas, and SGRE’s acqui-
02
20.2 GW in 2016. sition of some of the stricken wind turbine manufacturer
Senvion’s assets, including a large part of its European
Project acquisitions, where investors purchase (a share of) onshore service business.
il 2
a wind energy project, were down from €17.5bn in 2019 to
€15.1bn in 2020, a 15% decrease. However, the last three An additional figure of €6.3bn was raised by the wind
years have seen far more wind project acquisitions (by energy sector in capital markets in 2020. This includes
r
value) than all previous years on record. green bond issuances, initial and follow-on public offer-
Ap
ings, extensions of credit facilities and corporate debt
With a total of €9.9bn, company acquisition deals reached refinancing activity.
13
1.2 NEW ASSET FINANCING
Investments in new assets were worth €42.8bn, the This low figure had been anticipated in the wake of the
second highest amount on record, financing 19.6 GW of
new capacity.
til COVID-19 pandemic. However, it is vital that European
onshore wind recovers quickly to meet the targets
un
needed to deliver on the 2030 climate and energy goals,
Onshore wind financing totalled just €16.5bn, one of the an outcome which will require significant further invest-
lowest amounts and lower than pre-2017 when Feed-in- ment. To attract investment, governments will have an
tariffs were still common across Europe. This is important important role to play going forward. This is discussed in
O
as onshore wind is expected to play a major role in decar- further detail in Part 3.
bonising the economy; the European Commission’s
RG
long-term decarbonisation scenario expects onshore
wind to be the largest source of electricity by 2030 and to
remain so until at least 2050.
BA
FIGURE 5
New asset finance in wind energy 2011 – 2020 (GW and €bn)
EM
50 20.2 19.6
20
45
16.4
15.8
Capacity Financed (GW)
40 14.7
14.1 22.1 13.6
35 13.2 15
Investment (€bn)
R
30 11.5 11.4 26.3
12.5
25 12.9 10
DE
10.7
7.2 9.7 6.6
20 2.8 6.1
15
5
10
UN
5 18 18 17.9 18 23.2 24.7 15.2 16.9 17.9 16.5
0 0
2011 2012 2013 2014 2015 2016 2017 2018 2019 2020
Onshore wind (€bn) Offshore wind (€bn) Total new capacity financed (GW)
Source: WindEurope
Financing and investment trends – The European wind industry in 2020 15
WindEuropeInvestment numbers in 2020
The low investments in onshore were to some extent pattern of capacity financed is emerging, driven by patterns
compensated for by huge investment in offshore wind. in auction schedules, particularly the UK’s CfD auction that
With €26.3bn in investment for the build out of 7.1 GW, has covered most offshore projects.
1
2020 was a record year. The €26.3bn figure also includes
02
investment in offshore transmission infrastructure. In €16.8bn (39% of the total investments in new assets)
the UK, developers are responsible for building the were in non-EU countries, including the UK which was
transmission grid to the shore, and thus UK project invest- the leading country in terms of capital raised and capacity
il 2
ment figures cover the grid costs. In other countries the financed.
Transmission System Operator (TSO) is responsible for
building the grid. In 2020 TSOs in Belgium, the Netherlands Less than 330 MW of capacity was financed in the South
r
and Germany raised €2bn to finance the construction and East Europe (SEE) region, continuing a trend of decreasing
Ap
upgrade of offshore grid infrastructure. annual amounts of capacity financed since 2016.
New capacity financed in 2020 totalled 19.6 GW, the
second highest capacity financed in a year. A 2-year cyclical
13
FIGURE 6
New asset finance in onshore wind energy 2011 - 2020 (€bn and GW)
25 23.2
til 24.7
25
un
Capacity Financed (GW)
20 18 18 17.9 18 17.9 20
16.9
Investment (€bn)
16.5
13.9 15.2
15 15
12.3
O
12.1 12.5
11.8 11.7 11.9
10 11 10.9 10
RG
9.4
5 5
0 0
BA
2011 2012 2013 2014 2015 2016 2017 2018 2019 2020
Total investments (€bn) New capacity financed (GW)
EM
Source: WindEurope
Onshore wind raised approximately €16.5bn to finance 2020’s lower figure is in part due to COVID. Onshore wind
12.5 GW of new assets. While the investment figure is one typically has a much higher proportion of transactions
of the lowest in the last 10 years, the capacity financed is financed on the balance sheet of companies (corporate
R
similar to amount over the last two years, showing that the finance) than offshore wind. In 2020, 60% of the capital
cost per MW is falling steadily. raised for onshore wind development was on a corpo-
DE
rate finance basis compared with just 18% for offshore
Financing data gives us an indication of what is likely to be transactions.
built over the next few years. We estimate the time from
UN
FID to a wind farm’s Commissioning Date to be up to one Balance sheet transactions are more likely to suffer delays
year for onshore wind and 2-3 years for offshore wind. than project finance transactions since project finance
depends on the characteristics and risks of a project.
16 Financing and investment trends – The European wind industry in 2020
WindEuropeInvestment numbers in 2020
Over a medium to long-term horizon, these risks should Onshore wind capacity financed over the past few years
be largely unaffected by the pandemic. In contrast, corpo- has been lower than the annual 15 GW needed in EU
rate financing has an impact on companies’ balance sheets Member States to meet current 2030 targets, as we
1
and the uncertainty caused over the last year may have discuss in section 3.3.
02
reduced risk appetite in the short-term and caused delays
in financing decisions.
il 2
FIGURE 7
New asset finance in offshore wind energy (€bn and GW)
r
30 30
26.3
Ap
Capacity Financed (GW)
25 25
22.1
Investment (€bn)
20 20
15 15
13
12.9 12.5
10.7
9.7
10 10
7.2 6.6 7.1
6.3 6.1
5 3 3.9 5
0
2.8
0.5
1.5 2.4 2.5
til 2 1.4
0
un
2011 2012 2013 2014 2015 2016 2017 2018 2019 2020
Total investments (€bn) New capacity financed (GW)
O
Source: WindEurope
RG
In terms of offshore wind, investments totalled a record In France, the 2nd and 3rd offshore projects reached final
€26.3bn for the financing of wind farms and offshore trans- investment decision (Fécamp and Saint Brieuc) and raised
mission assets. Offshore investment patterns are driven by €4.7bn, 18% of the total.
auction schedules, in particular by the UK’s CfD rounds. In
BA
2016 almost €10.5bn was raised for three offshore wind In the Netherlands Hollandse Kust Zuid (1.5 GW) and
farms which were awarded CfDs in UK auction rounds in Hollandse Kust Noord (759 MW), both zero bid projects,
2014 and 2015 (Beatrice, Hornsea 1 and East Anglia One). reached financial close. In Germany the 342 MW Kaskasi
offshore wind farm also reached FID.
EM
In 2020, almost half of the investments (€12.8bn)
concerned 2 wind farms which had been awarded CfDs in These strong offshore investments illustrate confidence in
the 2019 UK auction round (Dogger Bank phases A&B and the technology and the resilience of the industry. Despite
Seagreen Alpha & Bravo). The 2.4 GW Dogger Bank A&B all the issues faced last year, developers, investors and
raised a record €9.4bn, 36% of the total financing amount consumers have shown that the technology provides an
R
in Europe. attractive investment.
DE
UN
Financing and investment trends – The European wind industry in 2020 17
WindEuropeInvestment numbers in 2020
CAPITAL COST TRENDS
1
FIGURE 8
02
Average CAPEX per MW in new wind farm investments (€m/MW)
5
il 2
4.5
4
CAPEX per MW (€m/MW)
r
3.5
Ap
3
2.5
2
13
1.5
1
0.5
0
2015 2016 2017
til 2018 2019 2020
un
Onshore wind Offshore wind
Source: WindEurope
O
Capital expenditure per MW for new onshore assets Over the last couple of years, three French offshore
RG
have decreased on average since 2015, from €1.9m per wind projects have reached FID. Saint Nazaire was the
MW down to around €1.3m per MW of capacity financed first commercial offshore wind farm in France and was
today. financed at €5m per MW in 2019. In 2020 Saint Brieuc and
Fécamp offshore wind farms also took final investment
BA
Spain and Sweden had the cheapest onshore wind farms decisions with capital expenditures of €4.6m and €4.9m
in 2020 with farms being financed on average with €1m per MW respectively. The design of the tender which was
per MW. launched in 2011 specified that wind turbine factories for
the project had to be built on French territory resulting in
EM
Other notable countries with lower-than-average capital higher capital expenditure for these projects.
expenditures per MW include Norway (€1.1m), Poland
(€1.2m) and Russia (€1.2m). In 2019, the UK’s Neart na Gaoithe was also financed at a
higher than average €5.1m/MW due in part to the depth of
These countries have fewer land constraints and can the water and challenging seabed conditions. This and the
R
build larger wind farms, benefiting from economies of French Saint Nazaire project alone accounted for 2/3rds of
scale. Countries facing greater permitting issues and land the financed capacity that year which contributed to the
DE
constraints see higher capital costs: Germany (€1.7m/ high cost for 2019.
MW), the Netherlands (€1.5m/MW), France (€1.5m/MW).
The gargantuan 3.6 GW Dogger Bank wind farm reached
UN
Capital expenditure per MW for new offshore wind FID for the first two phases A&B in 2020, raising €9.4bn
farms also decreased between 2016 and 2018. However, to finance 2.4 GW at €3.9m/MW. Phase 3 of the project
2019 and 2020 saw a reversal of this for several reasons. is expected to reach FID in 2021. Offshore wind farm
18 Financing and investment trends – The European wind industry in 2020
WindEuropeInvestment numbers in 2020
transactions in the UK include grid transmission costs. In bottom-fixed turbines), and potential increases in effi-
this case the wind farm is located 130 km off the coast of ciency (Hywind in Scotland is achieving capacity factors
Yorkshire in northern England, the farthest from shore to over 50%1), the technology is expected to play a significant
1
date globally. It will therefore use a High Voltage Direct role in Europe’s transition to carbon neutrality,
02
Current (HVDC) connection to reduce otherwise signifi-
cant energy losses, but this comes at a higher capital cost. Understanding the risks involved is essential for lenders
Nevertheless, the CAPEX per MW is significantly lower to price risk correctly and as experience grows, financing
il 2
than the UK average (€4.7m) owing to the economies of costs are likely to fall which will attract more investment.
scale achieved with such an enormous project, As the technology matures, more investors should allow
for further build-out and established supply chains and
r
On the other side, reducing the average European CAPEX economies of scale should provide the CAPEX reductions
Ap
per MW, two wind farms in the Netherlands reached FID witnessed with bottom-fixed offshore. On top of this, the
with an average of just €2.2m per MW, Hollandse Kust sector is leveraging the relevant experience and estab-
Noord (759 MW) and Holllandse Kust Zuid (1.5 GW). The lished supply chains with bottom-fixed turbines, as well as
wind farms are in favourable locations, relatively close to those from the oil and gas sector with years of experience
13
shore with shallow water. In addition, the government pays managing floating structures. We therefore expect floating
for the grid connection and supports all pre-development wind costs (financing and capital expenditure) to reduce
work such as wind resources assessment, seabed condi- at a faster rate.
tion analysis and permitting (which includes environmental
impact assessments). This contributes significantly to the
lower-than-average capital costs for offshore projects.
til The reasons for a higher or lower capital expenditure
are specific to project sites, but overall we expect to see
un
further CAPEX reductions in future years as the technology
Included in the 2020 figures is the financing of the 50 MW continues to mature.
Kincardine floating offshore wind farm. Floating offshore
technology is currently in the pre-commercial phase with
O
higher CAPEX than the more mature bottom-fixed tech-
nology. However, with the ability to open up new offshore
RG
sea areas to wind energy, (either because seabeds are
unsuitable or water depths are too great for traditional
BA
EM
R
DE
UN
1. https://energynumbers.info/uk-offshore-wind-capacity-factors, extracted on March 2021
Financing and investment trends – The European wind industry in 2020 19
WindEuropeInvestment numbers in 2020
1.3 NEW ASSET FINANCE PER COUNTRY
In 2020, 22 countries saw investments in new wind energy maturing at different rates and there are still a significant
1
assets. The top three investor countries - the UK, the number of countries in Europe which are not attracting
02
Netherlands and France - were responsible for 65% of all investment and have no new installations.
capital raised. Different European wind energy markets are
il 2
FIGURE 9
New asset finance in wind energy per country in 2020 (€bn)
r
14
Ap
12
Investment (€bn)
10
8
13.2
13
6
6.3
4 4.7
2.1
2
0.8 0.8 0.5 0.5 0.5 0.5
0.3 1.6 1.8 2.2 1.6 1.6 1.5 1.2 1.2
0
til
s
y
ay
en
m
d
nd
nd
ce
ey
s
e
nd
a
n
K
an
er
an
ec
ai
si
iu
U
w
an
ed
rk
la
la
un
rla
us
th
Sp
m
lg
re
nl
or
Tu
Ire
Po
Sw
Fr
O
er
R
Be
he
Fi
G
N
G
et
N
Onshore wind Offshore wind
O
Source: WindEurope
RG
The UK was the biggest investor in 2020 with €13.5bn of have affected both the level of investment and financial
total investments (albeit €9.4bn for a single wind farm, commitments in half of EU Member States. This is the case
Dogger Bank A&B) representing 32% of all financing in South East Europe (SEE)3, where less than 330 MW of
activity for the construction of new onshore and offshore capacity was financed in 2020.
BA
wind farms in Europe.
Investor confidence has been slow to recover mainly due
Northwest Europe2 still sees the bulk of new investments to macroeconomic and political factors. With less than
with 85% of the capital raised for new wind farms in €0.7bn, the SEE region represents less than 2% of all new
EM
Europe (€36.3bn). assets financed in Europe.
The UK, the Netherlands and France all saw investments Of the €42.8bn worth of investments in new projects,
in new wind farms worth over €5bn whilst Germany had €16.8bn (39%) were in non-EU countries: the UK, Turkey,
over €4bn and Turkey, Poland, Spain, and Norway all saw Norway, Russia, and Montenegro. Excluding the UK, the
R
investments in excess of €1bn. figure is €3.4bn, just 8% of the total and down from €6.4bn
in 2019. After the UK, Turkey had the most investment out
DE
In many EU markets there are currently no wind invest- of the non-EU countries with €1.6bn, followed by Norway
ments, despite these countries having significant potential with €1.2bn and Russia with €0.5bn.
for further expansion of wind power. National energy
UN
policies and the lack of a stable regulatory environment
2. Belgium; Denmark; Finland; France; Germany; Iceland; Luxembourg; Netherlands; Norway; Sweden; UK
3. Albania; Bosnia & Herzegovina; Bulgaria; Greece; Kosovo; North Macedonia; Montenegro; Romania; Serbia
20 Financing and investment trends – The European wind industry in 2020
WindEuropeInvestment numbers in 2020
FIGURE 10
New onshore asset finance in wind energy per country in 2020 (€bn and GW)
1
2.5 2.5
02
Capacity financed (GW)
2 2
Investment (€bn)
il 2
1.5 1.5
1 1
r
0.5 0.5
Ap
0 0
s
k
y
ay
en
m
d
nd
nd
ce
ey
s
e
nd
a
n
ar
an
er
an
ec
ai
si
iu
w
an
ed
rk
la
la
la
m
us
th
Sp
m
lg
re
nl
or
Tu
Ire
Po
er
en
Sw
Fr
O
er
R
Be
Fi
G
N
h
D
G
13
et
N
Investment (€bn) New capacity financed (GW)
Source: WindEurope
Although Germany and France have seen the highest
investment numbers for onshore wind these numbers are
til FIGURE 11
New offshore asset finance per country in 2020
un
lower than what they have experienced in previous years.
(€bn and GW)
The Netherlands saw a record amount raised (€1.6bn), 14 14
Capacity financed (GW)
financing over 1 GW of new onshore wind projects. 12 12
O
Poland saw an impressive amount of new asset financing,
Investment (€bn)
10 10
raising €1.6bn for a total capacity of 1.2 GW for many of
8 8
RG
the successful projects from the 2019 2.2 GW auction.
Another auction was held in 2020 for 900 MW. 6 6
4 4
Spain raised €1.5bn to finance 1.5 GW, the largest amount
2 2
BA
of onshore capacity. Some of these projects reached FID
0 0
through long-term corporate PPAs. UK Netherlands France Germany
Ireland, Belgium, Turkey and Greece all saw higher invest- Investment (€bn)
EM
ments than previous years. New capacity financed (GW)
Along with Germany and France, we expect Spain to be Source: WindEurope
a strong onshore market in coming years4. The Spanish
National Energy and Climate Plan (detailing Member State In 2019 the largest offshore investment amount for a
R
plans for decarbonising their economies) is aiming for single country was France with €2.4bn. This year both the
50 GW of onshore capacity by 2050 with auctions of 1.5 GW Netherlands and France doubled this amount, raising a
DE
taking place annually between 2021 and 2025. In early very significant €5bn and €4.7bn for the financing of new
2021, as part of this new auctions plan, 1 GW of capacity offshore wind farms respectively. Since the CAPEX per MW
has already been awarded. for French offshore wind is higher than the Netherlands
UN
(for reasons indicated above), the capital raised financed
less capacity (shown by the yellow marker). The UK raised
the most capital (€13.2bn) and financed the most capacity
(3.6 GW) in 2020.
4. For more information, see WindEurope’s Market Outlook:
https://windeurope.org/intelligence-platform/product/wind-energy-in-europe-in-2020-trends-and-statistics/
Financing and investment trends – The European wind industry in 2020 21
WindEuropePhoto: Sahara Frost / Shutterstock
2.

                                                                                                            1
                                                                                                      02
SOURCES

                                                                                            il 2
OF FINANCE

                                                                                    r
                                                                                 Ap
IN 2020
                                                                          13
                                                           til
                                                         un
2.1 CORPORATE AND PROJECT FINANCE
Corporate finance transactions (where a company raises            investments that further impact their balance sheets.
                                       O

the capital to build a wind farm on its own balance               Additionally, if a company’s credit rating deteriorates, it
sheet) typically account for 50-70% of the capital raised         could increase financing costs and result in projects being
                                    RG

for onshore wind. In 2020 60% of the capital raised for           delayed further or cancelled altogether. The data suggests,
onshore wind was financed on the balance sheet.                   however, that there may have been delays to project
                                                                  financed onshore transactions as well, with the lowest
Economic uncertainty created by COVID has likely                  amount raised on a project finance basis since 2015.
                                 BA

delayed wind farm investments as companies postpone

FIGURE 12
                        EM

Onshore wind corporate and project financing 2011 - 2020 (€bn)
        30

                                                                        0.9
        25                                                  0.7
                    R

        20                                                              6.5
             0.9         1.1       0.4        1.5           5.9                                           1.2
                                                                                               0.9                   0.6
                                                                                    0.7
             DE

                                    3
(€bn)

        15   4.3        5.5
                                              6.4                                                         6.6        5.9
                                                                                               6.8
                                                                                   6.6
        10
                                                          16.6          17.3
                                   14.5
        UN

             12.8       11.5
         5                                    10.1                                             9.1       10.2        10
                                                                                    8

        0
             2011      2012       2013       2014        2015          2016        2017       2018       2019       2020

                      Corporate finance              Project finance debt             Project finance equity
                                                                                                       Source: WindEurope

                                                         Financing and investment trends – The European wind industry in 2020   23
                                                                                                                 WindEurope
Sources of finance in 2020
After the high financing figures in 2015 and 2016 before sponsor’s point of view this means that raising debt is
the Feed-in-Tariff support schemes were phased-out in a cheaper method of financing than equity financing
many countries, recent years have seen lower investments (particularly in the low interest rate environment). More
1
in onshore wind generally. The lower figures following the mature technologies can raise more debt capital because
02
change in support have also been exacerbated by permit- banks understand and can price the risks, and a proven
ting issues in many countries in Europe. This is discussed track record of successful projects increases confidence.
in more detail in section 3.
il 2
Onshore project financed investments have a high debt
Debt typically provides lower returns than equity since ratio reflecting technology maturity, and in 2020, debt
in the event of bankruptcy it is repaid before equity accounted for over 90% of the capital raised on a project
r
and is therefore a lower risk investment. From a project finance basis.
Ap
FIGURE 13
Offshore wind corporate and project financing 2011 - 2020 (€bn)
13
30
25
6.3
20 til 3.6
(€bn)
un
15
10.9 15.4
0.8 2.5 2.2 0.8
10
4.9 1 0.2 1.4
7.7 7.2
0.6
O
5 7.8
0.8 3 5
5 2 1.9 2.7 3.1 7.6 5.3 1 0.5 4.7
0
RG
2011 2012 2013 2014 2015 2016 2017 2018 2019 2020
Corporate finance Project finance debt Project finance equity
BA
Source: WindEurope
Offshore wind projects tend to be much larger than Of the project finance transactions, debt accounted for
onshore projects and often lend themselves to project 71% of the capital raised. This is lower than previous
EM
finance structures (very few developers are able to raise years but as with many statistics this year, the Dogger
the required funds for such large projects on their own Bank transaction had a disproportionate impact here.
balance sheets). In 2020 €21.6bn worth of capital was The project raised €9.4bn and although this was financed
raised on a project finance basis, representing 82% of the with a record amount of debt (€6.5bn), the debt ratio was
total. 69%, i.e. the sponsors also put forward €2.9bn in equity
R
financing.
DE
UN
24 Financing and investment trends – The European wind industry in 2020
WindEuropeSources of finance in 2020
2.2 NON-RECOURSE DEBT
Non-recourse debt (debt raised on a project finance basis) sources of finance from banks, institutional lenders and
1
has become more important in financing wind energy Export Credit Agencies (ECAs). This has led to a large
02
projects over recent years. New business and ownership amount of affordable debt, particularly in the form of
models have diversified the pool of investors in wind non-recourse financing.
energy and are unlocking the potential for long-term
il 2
FIGURE 14
r
Non-recourse debt: new assets and refinancing 2011 - 2020 (€bn)
Ap
30
25 6.5
13
20 6.9 11.1
9.3
(€bn)
15 1.8 2.5
10 1.3
3
3.4
til 6.9
un
5
9.1 7.4 6.0 14.1 13.1 17.4 7.1 14.6 11.6 21.3
0
2011 2012 2013 2014 2015 2016 2017 2018 2019 2020
O
New asset non-recourse debt Refinance non-recourse debt
RG
Source: WindEurope
2020 saw a record €27.8bn raised in non-recourse debt - wind projects. During this period the wind project is not
€21.3bn for the construction of new projects and €6.5bn producing any revenue. Additionally, there are risks such
BA
for the refinancing activities of wind farms. as losses from accidents or delays in construction (due to
bad weather, for example). Once the wind farm has been
When a wind energy project is commissioned, its risk commissioned, the risks of construction are transferred to
profile changes significantly. The risks present during operation.
EM
construction are replaced by operational risks. This affects
the probability of repaying lenders. In addition, lenders Since there are fewer potential losses and risks for opera-
specialise in pricing risks at various stages of the develop- tional wind farms, they can attract better interest rates. The
ment of a project. It is therefore common for a project to restructuring of debt in this way is known as refinancing.
restructure its debts upon completion.
R
For example, banks might provide debt to cover the
DE
construction of the wind farm, which typically takes 1-2
years for onshore projects and 2-3 years for offshore
UN
Financing and investment trends – The European wind industry in 2020 25
WindEuropeSources of finance in 2020
FIGURE 15
Interest rates for offshore: basis points above LIBOR per MW financed 2010-2020
400
1
02
350
il 2
300
Basis points over Libor
250
r
200
Ap
150
100
13
50
0
2010 2012 2014
til 2016 2018 2020
un
United Kingdom Germany Belgium Netherlands Interest rate premium trendline
Size of bubble represents project capacity
O
Source: WindEurope
RG
The debt markets have supported construction activity on market matures, the technology’s positive track record
attractive terms, even in 2020, illustrating that the main continues and lenders become more comfortable with
drivers for interest rate premiums are technology maturity the risks.
and long-term project risks and characteristics.
BA
Over 67 lenders were active in 2020, slightly less than in
Transactions in 2020 continued to reflect the general trend 2019 (76). Lenders include multilateral financial institu-
of easing loan terms when it comes to pricing, maturity tions, export credit agencies and commercial banks.
and tranche. The low interest rate environment continues
EM
to provide wind energy projects with competitive financing
and low financing costs. The risk premium charged by
lenders has been consistently falling as the offshore wind
R
DE
UN
26 Financing and investment trends – The European wind industry in 2020
WindEuropeSources of finance in 2020
FIGURE 16
Market share of banks in wind energy financing in 2020
Others Rabobank
1
46.7% 8.6%
02
Santander
7.3%
il 2
Société Générale
7%
r
67
Ap
Credit Agricole Group
BANKS ACTIVE 6.7%
IN WIND ENERGY FINANCING
IN 2020 BNP Paribas
13
6.3%
Sumitomo Mitsui
Financial Group
til 3.4%
Barclays
3.4%
un
ABN AMRO Bank
2.6% Allied Irish Bank
2.8%
Banco Sabadell CaixaBank
2.7% 2.7%
O
Source: WindEurope
RG
BA
EM
R
DE
UN
Financing and investment trends – The European wind industry in 2020 27
WindEuropeSources of finance in 2020
2.3 GREEN BONDS
Green bonds issued for the financing of wind energy Allied Irish Banks, Commerzbank and Danske Bank, to
1
projects and renewable portfolios (including wind energy finance and refinance their renewable energy portfolios.
02
projects) have seen steady growth overall since 2013, and
2020 was a record year with €20.5bn worth of capital Some of the top individual issuers include ING (€2.6bn),
raised. EDF (€2.5bn), TenneT (€2.4bn) and E.ON (€2.2bn).
il 2
The majority of the issuances came from corporate bonds,
including over €5.3bn issued by banks, including ING,
r
Ap
FIGURE 17
Green bond issuances 2013 - 2020 (€bn)
25
13
19.9 20.5
20
17.5
15 til
(€bn)
12.2
un
10
7.1
5.4
5 4.2
O
1.9
RG
0
2013 2014 2015 2016 2017 2018 2019 2020
Source: WindEurope
BA
FIGURE 18
Green bond issuances by technology in 2020
EM
Corporate RES portfolio Renewables grid infrastructure
75% (excluding offshore grids)
17%
Offshore grid infrastructure
R
5%
€20.5bn Wind energy corporates
DE
2%
GREEN BOND ISSUANCES
Wind energy projects
1%
UN
Source: WindEurope
28 Financing and investment trends – The European wind industry in 2020
WindEuropeSources of finance in 2020
Out of €20.5bn raised in green bonds, only €1.6bn (8%) of The remaining €15.5bn (76%) of green bonds were issued
new issuances in 2020 came from companies exclusively to finance corporate renewable energy portfolios which
operating in the wind industry, either through project include wind energy but are not exclusively wind-based.
1
or corporate bonds. Another 17% (€3.5bn) was raised
02
to finance expansion and improvements in general grid
infrastructure.
il 2
2.4 PROJECT ACQUISITIONS
r
Ap
FIGURE 19
Project acquisitions by country in 2020 (€bn)
4
13
3.5
3
2.5
til
(€bn)
2 2.7
1.5 2.5 0.1
2.5
un
1
1.4 1.2 1.2
0.5 0.2
0.7 0.1 0.1
0.2 0.4 0.4 0.3 0.3 0.3 0.5
0
O ia
y
en
ia
ay
d
nd
nd
ce
s
e
s
n
ly
K
an
er
ru
an
ec
ai
an
tr
U
Ita
an
ed
w
la
la
th
yp
Sp
us
m
re
nl
om
or
Ire
Po
Sw
Fr
O
er
Fi
A
G
C
N
R
RG
G
Onshore wind Offshore wind
Source: WindEurope
BA
In a project acquisition, an investor purchases (a share uncertainties, however equity investments were quick to
of) a wind farm. Wind energy projects can be acquired at recover after the initial shock brought on by COVID.
any stage, from pre-development, through development
and construction, to operational wind farms. The differing The UK market saw the most acquisition activity in mone-
EM
risks and characteristics of the various stages attract a wide tary terms (€3.5bn) and capacity acquired (3.3 GW).
range of investors. Germany saw €2.8bn of project acquisition activity but less
than 1 GW of capacity changed ownership. Spain was the
Project acquisition activity in 2020 totalled €15.1bn, less market with most onshore wind acquisition activity, with
than the previous two years (€17.5bn and €19.6bn in 2019 €2.5bn of wind project equity investment.
R
and 2018 respectively). It is possible that the lower figure in
2020 is to some extent a result of delays caused by market
DE
UN
Financing and investment trends – The European wind industry in 2020 29
WindEuropeSources of finance in 2020
FIGURE 20
Project acquisitions by country in 2020 (GW)
1
02
In terms of the capacity, 15.5 GW of projects were acquired.
The relative value of a wind farm depends on its stage of
development. Wind farms gain value through the devel-
il 2
UK opment stages and then there is a large increase in value
Others 3.3 GW during construction as tangible assets are installed. A wind
4.6 GW farm is at its most valuable upon commissioning (there is
r
some slow depreciation after that). Since Germany saw
Ap
some of the highest acquisition activity in monetary terms
Spain but only 0.9 GW of capacity changed hands, we can infer
2.4 GW that most of these acquisitions were for operational (or
Germany late construction) projects. Indeed, (shares of) a number
0.9 GW
13
large operational offshore wind farms changed hands,
Finland including Merkur (396 MW) and Borkum Riffgrund 2 (450
Sweden
1.3 GW MW). In contrast, acquisitions of UK wind farms are more
France 1.6 GW
likely on average to have happened at an earlier stage of
1.4 GW
til development.
un
Source: WindEurope
2.5 CORPORATE RENEWABLE PPAs
O
RG
The corporate sourcing of renewable electricity via Power Until 2018, wind accounted for 90% of the contracted
Purchase Agreements (PPAs) has been growing steadily capacity in Europe but the last couple of years has seen a
since 2015. Corporates have a variety of different motives rapid expansion in solar PPAs which has really helped drive
to source power from renewables, but the possibility to the market growth. In 2020, wind accounted for just over
BA
lower and fix electricity costs is a major part of the rationale half of the contracted capacity, and cumulatively, wind
for these deals. A recent survey of 1,200 companies across makes up 74% of the contracted capacity in Europe.
six countries showed that, of those sourcing renewables,
92% of them are doing so to reduce energy costs5. Wind energy is very well placed to accommodate corpo-
EM
rates’ needs for renewable electricity due to its modular
Despite the challenging conditions, 2020 was another scale, cost-competitiveness and low risk profile.
record for contracted volumes of renewable electricity
via corporate PPAs in Europe, with almost 4 GW in wind,
solar and other renewable projects. It was also a record
R
for the number of deals finalised in a year with 51 in total,
including 24 signed for wind energy (of which 6 were for
DE
offshore wind) and 24 for solar.
UN
5. BayWa r.e. Energy Report 2019, published in partnership with the RE-Source Platform.
Available here: https://www.baywa-re.de/en/energy-report-2019/
30 Financing and investment trends – The European wind industry in 2020
WindEuropeSources of finance in 2020
FIGURE 21
Renewable energy corporate sourcing through PPAs (GW)
1
02
4
3.5
il 2
3
Annual Volume (GW)
2.5
r
2
Ap
1.5
1
13
0.5
0
2013 2014 2015 2016 2017 2018 2019 2020
Onshore wind Offshore wind
tilBiomass Solar Wind+solar Hydro
un
Source: WindEurope
Corporate renewable PPAs also come with certain bene- Recent years have seen the development of offshore
O
fits for generators. Price visibility over a long period of wind PPAs from the first in 2018 for a proportion of the
time and a guaranteed off-taker are important to lower capacity of Kriegers Flak in the Netherlands, to at least
RG
the cost of debt financing. Lenders would typically need nine offshore wind farms signing corporate PPAs to date in
downside protection (a floor) in project revenues to the Netherlands, Belgium, Germany and the UK. Offshore
ensure debt repayment obligations are met. As such, they developers look to corporate PPAs for revenue stability,
tend to prefer lower revenues over a long period of time – allowing them to free up risk capital (if financing projects
BA
matching the loan term – rather than higher but uncertain on their balance sheet) or to finance a higher proportion
revenues. of the costs with cheap debt. Over 700 MW of offshore
capacity was contracted in 2020, almost 20% of the total.
EM
R
DE
UN
Financing and investment trends – The European wind industry in 2020 31
WindEuropeSources of finance in 2020
FIGURE 22
Renewable energy corporate PPAs by country (MW)
1
Sweden
02
Norway
Spain
il 2
UK
Finland
Germany
r
Netherlands
Ap
Belgium
Ireland
France
Denmark
13
Poland
Italy
0 500 1,000 1,500 2,000 2,500
2013 2014 2015
til
Contracted Capacity (MW)
2016 2017 2018 2019 2020
un
Source: WindEurope
Typically, the Nordic region, followed by the UK and the PPAs are being signed by more companies, across more
O
Netherlands, were the biggest markets for these deals. sectors and more countries and will play an increasingly
However in 2020, Spain, Germany and Belgium signed important role in meeting corporate demand for renew-
RG
significant volumes of PPAs. Spain in particular contracted able electricity as well as supporting the finance and
more than 1.3 GW with over 1 GW of solar PPAs. build-out of renewable energy in Europe.
BA
EM
R
DE
UN
32 Financing and investment trends – The European wind industry in 2020
WindEuropeYou can also read