STRATEGY OVERVIEW This strategy letter has been going for 30 years - thanks for all your support during that time! - Chahine Capital
←
→
Page content transcription
If your browser does not render page correctly, please read the page content below
2/1/2021

                                                               STRATEGY OVERVIEW
This strategy letter has been going for 30 years – thanks
          for all your support during that time!
  Summary
  For the 30 years of its existence, this monthly letter has attempted to offer original insights into the state of
  the financial markets. But all things come to an end, and the time has now come for me to hand over to the
  Chahine Capital team. The encouragement that I have received over the years has been the biggest reward
  of my career. As far as Chahine Capital’s own career is concerned, it continues under the wing of Iris Finance
  with assets now totalling a billion euros. Its performance has been even more impressive, at an annualised
  11.2% and 11.7% over ten years for its two flagship funds.

  2020 was an “annus horribilis”, as Queen Elizabeth remarked of an earlier time. Covid has spared nobody,
  but despite the economic damage it inflicted it was a stellar year for equities overall. The MSCI World index
  gained 14.1% in local currency terms and 16.5% in dollars, but performance was far from even and confirmed
  the pre-eminence of the digital economy led by the USA and now China, the new kid on the block. Wall
  Street progressed 21.4%; emerging markets were up 19.5%, almost entirely because of stocks listed in
  mainland China (up 69%) and Hong Kong (up 22.4%). The digital economy was the major beneficiary of the
  crisis, hence these performance numbers. The top ten contributors to world performance account for 10% of
  that 16.5% MSCI World gain, and all are Gafam-type stocks. Some of China’s equivalents appreciated by five
  to ten times over. The Chinese stock market is unchallenged as the second largest in the world, but it is a
  risky prospect given its lack of transparency and state interference, as Alibaba knows to its cost. China also
  lacks a Microsoft, on which it is 85% dependent, and is desperate to establish a local OS. Hacking and
  aggressive hiring of the best brains in the business are all fair game. At the other end of the scale, energy,
  finance and real estate were big losers over the year, as were a wide range of sectors directly exposed to the
  pandemic, such as air transport and leisure. Steep rate cuts and massive liquidity injections fuelled the
  market’s appreciation, with the help of a second wind in the form of good news on vaccines.

  On 28 March we switched from an underweight to an overweight recommendation on equities; that was at
  2,600 points for the S&P 500 and our position has not changed since even though the index closed the year at
  a record 3,756 points. Our other recommendations during the year were to buy gold at $1,780 per ounce via
  futures and to reduce dollar exposure at 1.18 to the euro. We are keeping those recommendations in place
  for 2021. The dollar is a casualty of negative real interest rates, a widening US trade deficit and the prospect
  of yet more liquidity injections this year. Gold is a good response to this situation.

  China’s burgeoning imperialism will be the major theme of 2021. Hong Kong has ben muzzled, Germany is
  threatened with a boycott of its cars if it does not opt for Huawei, and the Chinese government is not good
  at respecting agreements that it has made. Joe Biden’s arrival in the White House could create a united
  front with the EU against China, but China is proving adept at divide-and-rule and knows that the EU is not
  itself entirely united. Unexpectedly quick progress on vaccines should tame the pandemic, and although
  vaccination programmes have sometimes proved chaotic, governments and the pharmaceutical majors will
  get their act together and we ought to be looking at normal holidays this summer. The decline in world GDP
  was limited to 3.77% last year and we are set for a 5.1% rebound in 2021. Asian economies are set to perform
  best of all, and especially China at 8.3%. The US economy is also rebounding strongly, and we note a jump in
  the house price inflation rate to 7%. Brexit is done at last and the EU will be less affected by it than the UK.

  We expect US profits to jump 22.5% this year after a drop of ‘only’ 16% in 2020 concentrated in energy and
  finance. The S&P 500’s 2021 PER is 22.5 and its dividend yield is 1.6%. Our model suggests that the market is
  fully valued; we have an objective of 3,753 points for year-end, in line with its 2020 close. It implies a 30-
  year yield of 1.66% and an 8-year CAGR of 6%; as that is higher than nominal GDP growth, it means another
  jump in margins via digital transformation. We are maintaining our recommendation to overweight equities.

  Jacques Chahine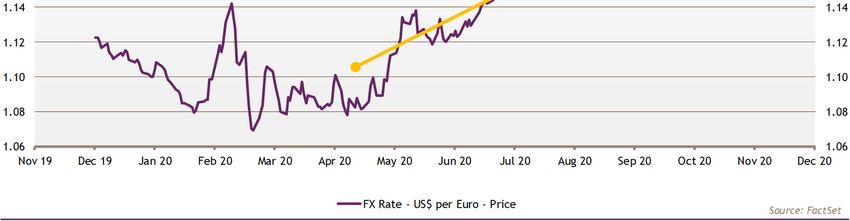
2/1/2021

        STRATEGY OVERVIEW

An emotional goodbye
Your encouragement as readers of this strategy letter over all these years has been the greatest reward of
my career. We started with the letter in France in 1990, two years after the creation of Jacques Chahine
Finance and its market consensus analysis. In those far-off days I was calculating the CAC 40 PER using
consensus estimates and sending out my findings on our Market Fax; emails were still in their infancy. In
2004 I sold JCF Group to FactSet in order to concentrate on modelling-led management, and out of that
came Jacques Chahine Capital, the Digital Funds SICAV and the strategy letter in its current form. I
continued to write the letter after Chahine Capital was sold to Iris Finance, and in the meantime Digital
Funds went from strength to strength under their management team. Assets under management have risen
from €500 million to €1 billion. Innovations in our modelling and the recent integration of an artificial
intelligence module have boosted performance further. Annual average performance over ten years is
running at 11.2% for Digital Stars Europe and 11.7% for Stars Europe ex-UK, and these funds are regularly
placed top of their respective categories. The editorial policy for this letter is strictly independent, and it
has been forthright in recommending reduced exposure to equities when market levels appear excessive.
My favourite comment about this letter is from a reader that told me “Your letter is always at the top of
my reading pile.”

It is now time to pass the baton to Chahine Capital and their market analysis, with the assistance of the
toolbox that I have developed over my time at the helm. Thanks to our deep understanding of the drivers
behind consensus figures, we offer one of the best platforms available for analysing company profits. It is
with no little emotion that I lay down my pen in order to dedicate myself to my family office. But you can
always contact me via jacques.chahine@jajinvestmentgroup.com.

A novelty: a market-friendly recession
2020 was an “annus horribilis”, as Queen Elizabeth remarked of an earlier time. It was the year of the
coronavirus; nobody has been spared the consequences, and many of us have spent months confined to our
own homes and fearful of catching this wretched disease. But despite a brutal halt to economic activity
and a deep recession that left huge numbers of people destitute or close to it, a tiny minority has become
considerably wealthier. Central banks pumped the equivalent of trillions of dollars into their economies,
but much of it went to inflating financial asset values, especially equity values. Working households rarely
own shares, and when they do the quantity tends to be very modest. The wealthiest 1% of households own
over 50% of American shares, and that figure is rising continually. Even bondholders – irrespective of rating
– have enjoyed capital gains as a result to lower interest rates. The Fed has even bought junk bonds to
boost the economy and avoid corporate bankruptcies.

Including gross dividends, the MSCI World progressed 14.1% in local currency terms in 2020, or 16.5% in
dollars given the greenback’s depreciation against most other currencies. Bur performance varied greatly
between markets, depending on how much they were affected by the pandemic. The digital economy was
its major beneficiary and this was reflected in market performance in the USA and China, the new kid on
the block. Wall Street progressed 21.4%; emerging markets were up 19.5%, almost entirely because of
stocks listed in mainland China (up 69%) and Hong Kong (up 22.4%).

The year’s leading sector was IT at up 42.8%, following its 48.1% gain in 2019. Note that many of the major
gains in other sectors were from stocks with a substantial IT component, such as Amazon and Tesla among
durable goods and Google, Facebook and Netflix in communication services. The top ten contributors to
world performance account for 10% of that 16.5% MSCI World gain, and all are American. Chinese stocks do
not appear because they are covered in emerging rather than developed market indices. European large
                                                                                                           -2-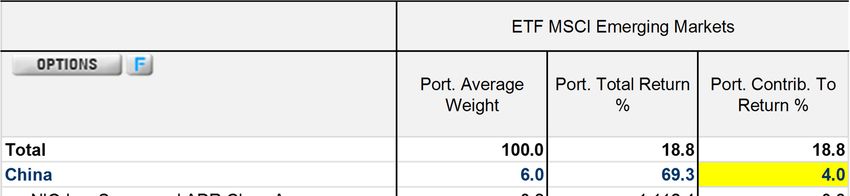
2/1/2021
STRATEGY OVERVIEW
caps were at the bottom of the performance league as they have practically no digital economy
representatives.
IT stocks lead the charge
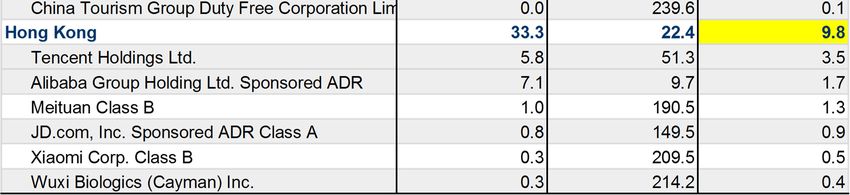
China and Hong Kong explain emerging market gains
Strong performance by the emerging markets index reflected conditions in China, South Korea and Taiwan.
Its Chinese component accounts for 6% of the index and appreciated 69%; Hong Kong, where the major
Chinese groups are listed, accounts for 33% and progressed 22.4%. The Hong Kong segment would have
rallied by considerably more were it not for the Chinese communist party’s interference with the Alibaba
Ant IPO. Taken together, the two market segments are capitalised at $2,700 billion, a fraction of total
Chinese capitalisation. We have long tried to put a figure on total Chinese capitalisation but have never
-3-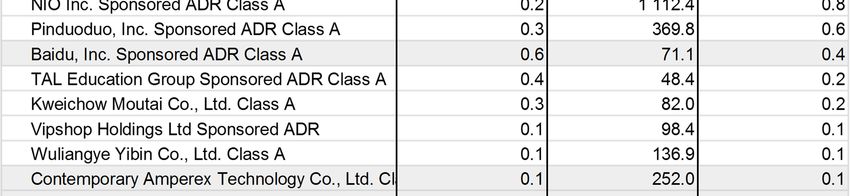
2/1/2021

       STRATEGY OVERVIEW

succeeded. There are a great many types of share, for one thing, and they are listed in Hong Kong,
Shenzhen, Shanghai, on Nasdaq, as ADRs, on NYSE etc. Moreover, MSCI only recognises free float and many
Chinese firms are under the strict control of their founders. Our best guesstimate is $18.8 trillion,
compared with $31 trillion for the S&P 500. The Chinese market is opaque and accounts are often
manipulated. That is why it should be approached via companies listed as ADRs, which are legally obliged
to publish GAAP accounts.

An examination of the surge in Chinese share prices in 2020 is instructive. The leading performers include
NIO (China’s Tesla), Pinduoduo (a cross between Amazon and Groupon), Baidu (a kind of Google) and Tal
Education, a specialist in home schooling for groups or individuals whose parents are desperate for their
academic success. The pandemic boosted online teaching in any case. The very biggest names – China’s
Gafam – are listed in Hong Kong.

                                     China and Hong Kong

China still lacks its own Microsoft, however. 85% of its computers depend on Windows and local efforts to
develop an independent OS over several years do not appear to have got very far. Deprived of Android, the
Huawei group is working flat out on its Harmony OS to drive its smartphones. The project is unlikely to
make a splash internationally, but a combination of a vast domestic market and outright nationalism will
enable China to do without Android and Windows in the end, just as it has bypassed Google. With very
deep pockets, the Chinese are out to hire the best brains in the OS world. On top of this legal version of
intellectual property theft, Microsoft has recently reported hacking into its source codes.

                                                                                                      -4-
2/1/2021

        STRATEGY OVERVIEW

A trail of Covid destruction
2020 may have been great for the digital economy but it was sometimes catastrophic for companies
directly affected by the pandemic. Several chain stores went bankrupt or disappeared from the major
indices, such as Macy’s. The sector was already under immense pressure from Amazon and Covid finished
them off. Cruise operators and airlines are still at a standstill or close to it. The loss-making energy sector
was the worst hit of all. It now accounts for just 2.2% of the S&P 500, however, which has limited its
overall impact. Finance also returned negative performance, where large trading profits helped offset
huge provisions. Real estate was another casualty, mainly through shopping malls, hotels and offices. The
ten largest caps in the S&P 500 account for 27.5% of the index, meaning that any sense of overvaluation
among them would depress the whole market. Index PERs are 22.5x 2021 and 19.2x 2022. The market’s
2021 dividend amounts to 1.6% at current prices, far better than the 1% on offer from 10-year Treasuries.

Last year may have seen the steepest recession in history but a combination of tumbling interest rates and
abundant liquidity ensured a strong rally in equity markets. A wave of money without any other home (or
at least without any home with an acceptable risk-return profile) ended up in the shares of companies that
could still show growth. Performance then picked up in the autumn, when the imminent arrival of
effective vaccines boosted hopes of a return to normality.

On 28 March we switched from an underweight to an overweight recommendation on equities; that was at
2,600 points for the S&P 500 and our position has not changed since even though the index closed the year
at a record 3,756 points.

How our recommendations fared in 2020
Against a backdrop of tame inflation, interest rates fell to zero in the USA and turned increasingly negative
in Europe. Central bank efforts to print trillions of dollars and euros undermined confidence in these
currencies and gold resumed its safe haven role. In our letter of 27 June, we argued that as central banks
could print as much paper currency as they wished but could not do the same for gold, readers should
consider buying the latter at $1,780 per ounce. Our call did not come as early as it could have done but
gold closed the year at $1,895/oz. The dollar’s depreciation did not unravel our recommendation as we
opted for futures on Comex. All in all, gold appreciated 22% on the year, outperforming the S&P 500. We
are maintaining a gold allocation of 3-4% in our own portfolio, as we expect interest rates to stay low (and
negative in real terms, given US inflation). We continue to favour a position in Comex futures, avoiding
dollar exposure (only gains and losses are converted into dollars).

On 23 August, we recommended reducing exposure to dollars at 1.18 to the euro. The dollar closed the
year at 1.2235. Dollar depreciation against most other currencies was one of the major shocks of the year:
it declined 8.7% against the euro overall and 12.6% from its high. Given a wide interest-rate differential
between the euro (negative rates) and the dollar (positive rates), the dollar-euro carry trade was a sure
winner for a very long time. The Fed has since cut short rates to zero, but with an inflation rate of around
1.5% real rates are now very negative. Eurozone inflation is still negative.

                                                                                                           -5-
2/1/2021

       STRATEGY OVERVIEW

          Despite the recent correction, we are still positive on gold

                                Stay underweight the dollar

The dollar depreciated against the Chinese yuan and the Japanese yen as well, which could generate
imported inflation. China is now America’s biggest trading partner. At the same time, a yawning US trade
deficit during the crisis has left a great many dollars in the hands of non-residents, amounting to $780

                                                                                                    -6-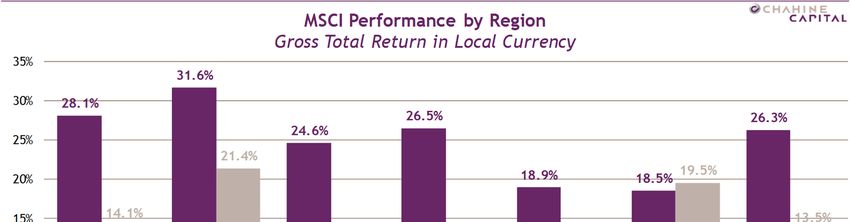
2/1/2021

       STRATEGY OVERVIEW

billion per year. If that were not enough, the markets are also nervous of a new $900 billion stimulus
package and the possibility of additional support once Joe Biden becomes president.

         The US trade deficit to stay high until the economy recovers

Steep rate cuts and massive liquidity injections
All the major central banks slashed their interest rates and injected vast amounts of liquidity into their
economies in 2020. The US yield curve has gapped down from where it was a year ago, with short rates
dropping from 1.5% to virtually zero. But it has also got steeper, reflecting market expectations of a
rebound in economic growth and the likelihood of Fed tightening towards the end of this year once the
recovery is established and in response to higher inflation. The economists’ consensus estimate of the
inflation rate at end-2021 has risen from 1.7% to 1.9%. There is every possibility of a rush to consumption
after lockdowns and forced savings. Note that US real estate prices have rebounded already and continue
to climb at a rate of 8% per year.

Together with rate cuts, central banks are still printing money. This is mainly via purchases of the
government debt issued to keep households and businesses afloat during the crisis. Helicopter money came
to every American household in April and that operation is about to be repeated. Donald Trump took a
socialist turn in proposing a payment of $2,000 to every American rather than the $600 voted; Democrats
agreed with him but a Republican Senate rejected it. The Biden presidency will undoubtedly see other
initiatives of this sort. In Europe, the ECB is still an active buyer of government bonds and its liquidity
injections so far are reflected in its €7 trillion balance sheet. It is not about to stop, as the ECB will
finance the entirety of the EU’s €750 billion stimulus package as well as member States’ budget deficits
this year. Even the hyper-prudent Germany expects to post a budget deficit amounting to 7% of its GDP.

                                                                                                       -7-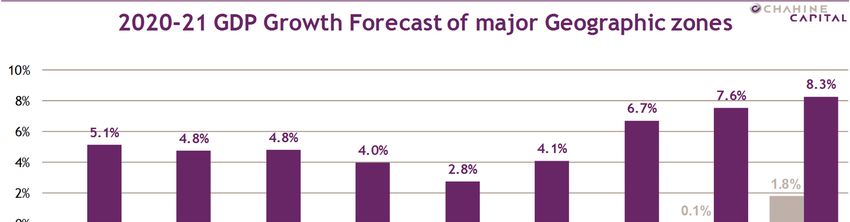
2/1/2021

STRATEGY OVERVIEW

     Sharply lower interest rates but a steeper curve

  Central bank balance sheets to increase further in 2021

                                                                 -8-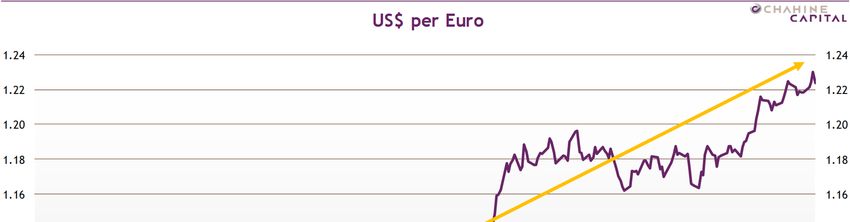
2/1/2021

        STRATEGY OVERVIEW

Chinese imperialism to dominate the year
2021 will see worsening trade disputes with China. Buoyed by its success in containing the coronavirus, its
continuing economic growth in 2020 and abundant foreign exchange reserves on the back of record trade
surpluses, China is not shy about its ambitions. A heavy-handed security law in Hong Kong is aimed at
silencing criticism from that quarter and any country seeking to develop ties with Taiwan faces reprisals.
More and more countries are directly affected by an imperialist policy that uses the weight of an enormous
domestic market of 1.4 billion people to profit from divisions in the free world. For the past 20 years,
China has brazenly robbed developed economies of their industrial and technological knowhow through the
firms permitted to operate in its market. Plenty of major groups have sold their souls in return for short-
term gain. A recent international survey revealed sharply increased distrust of China and its intentions.
India has turned to the USA for support against Chinese expansion. There has been support for the US
boycott of Huawei, but Germany has broken it rather than risk its existing interests in China. Too bad that
Europe failed to promote its very own Ericsson and Nokia to create a world leader. Mr Trump’s efforts to
counter China on trade suffered from his desire to fight Europe at the same time rather than forge an
obvious alliance. Mr Biden will also want to defy the Chinese; the question is whether he will work with
Europe to enforce fair play. The EU has reached an agreement with China on investment that mirrors the
US deal, meaning that it is supposed to open the Chinese market, protect intellectual property and
eliminate forced technology transfer. This hasty agreement seems designed to keep Europe from standing
together with the USA. Personally, I wouldn’t trust China an inch.

The pandemic vs. vaccines
The New Year kicked off with another wave of the pandemic that is even more virulent than the first one.
331,000 people were killed by the virus worldwide in December, a figure higher than that for April and
after an already bad November. Given the number of new cases reported in December, particularly during
the holiday period, January will be a very bad month too. Economic activity has been disrupted again and
growth has been revised down; lockdowns mean a later recovery. Attention is focused on vaccination
programmes and the speed with which whole populations can injected. Disappointingly, many people
appear reluctant to show up for vaccination once the possibility arises. The French government messed up
an advertising campaign that was supposed to show thousands of people ready to be vaccinated, apart
from in care homes that is. Israel is leading the way with its own citizens: by 3 January 1.1 million Israelis
had been vaccinated, or 11.5% of the population. Israel is the only country in the world where all
inhabitants have a centralised medical file containing their full history (analyses, X-rays, prescriptions,
hospitalisation, etc.); this has made it easy to identify priorities. A close relationship between Pfizer CEO
Albert Bourla and Benjamin Netanyahu ensured the country received a disproportionate share of early
vaccine production. But the choice may pay off if it shows the world how widespread vaccination can
result in an early return to normality, and the data available on this population could be used to improve
the vaccination process.

Despite some initial hiccups, we expect all the pharmaceutical majors to work flat out on producing
vaccines. Several are on the market already. Mr Biden has set a target of 100 million vaccinations over his
first 100 days, which is realistic given 325,000 reported in a single day. As success breeds success,
vaccination rates should accelerate worldwide and we can hope for relatively normal holidays this summer.

                                                                                                          -9-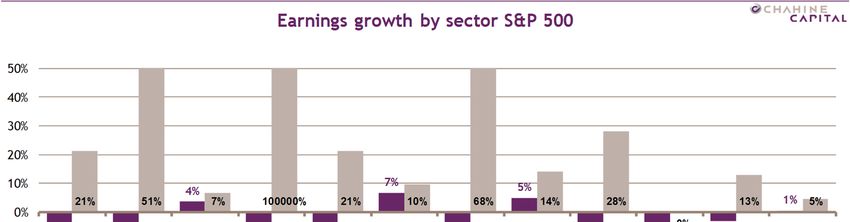
2/1/2021

        STRATEGY OVERVIEW

           A calamitous winter has delayed the end of the pandemic

Our so-called Confucian countries have suffered a jump in cases too, but we are still talking about 1,800
deaths in December in a combined population of 1.9 billion.

Less of a recession than feared in 2020, but a more moderate
recovery in 2021
The world economy is technically in recession, but it was natural rather than economic in origin and
activity will resume as soon as the pandemic permits. Forced savings during the crisis will have made
households keen to live again afterwards, meaning resuming a social life, going to the cinema, eating out
and travelling. We saw already during last year’s interlude how quickly activity can rebound. Once it is
fully understood that vaccinated people are no longer at risk, there is every chance of a sharp upturn in
consumption this summer.

The decline in world GDP in 2020 is estimated at just 3.77%, with stronger than expected activity in the
USA and Asia limiting the downswing. Last month the estimate was -3.85%. The latest wave of the
pandemic has dampened forecasts for 2021, but the current projection of 5.1% growth would make up for
GDP lost last year. Asia will remain the main engine of world growth, contributing half of it; Chinese and
Hong Kong GDP is expected up 8.3% after an overall gain last year. Europe was the biggest casualty, as it is
set to report a 7% drop in GDP last year and a relatively meagre 4.8% bounce this year. This would of
course fall far short of making up for the contraction. France, Italy, Spain and the UK were notably hard
hit, with declines in GDP likely to top 10% in some cases. For the UK, Brexit has not come at a helpful time
but its advance in vaccination could pay off handsomely.

The US economy is expected to grow by 4.8% this year, neatly compensating for the downturn. Japan will
not manage to make good all of its recession, however. At current growth rates, China will overtake the
USA as the world’s biggest economy in 2030, or even earlier if the yuan appreciates against the dollar.

                                                                                                       - 10 -
2/1/2021
STRATEGY OVERVIEW
A strong rebound if the pandemic is tamed this year
A generally positive tone to US macro indicators
The main macroeconomic indicators have not changed much over the past month. Both the manufacturing
and services PMIs in the USA are buoyant; in the euro zone, the manufacturing index is above the 50 level
that suggests stronger activity but the services score is depressed. US existing and new home sales are
rebounding strongly, and the stock of existing homes for sale is historically low. This is especially true of
houses. The Case Shiller house price index is up 7% over the past year. The numbers of building permits
and housing starts are at their highest point since the financial crisis, largely because of low interest rates.
The US labour market is still weak, however, and new unemployment benefit claims are back up to 800,000
per week. Some 10 million jobs have been lost overall since the pandemic broke. Whole swathes of the
services sector, such as leisure services, are virtually at a standstill but should start employing people
again once the situation reverts to normal. The car market is struggling badly, especially in Europe,
although in China – the world’s biggest market – sales are almost back to pre-crisis highs at 25-30 million
per year. This also explains Germany’s vulnerability to Chinese pressure, as the country is the biggest
outlet for firms like Volkswagen and Mercedes. Chinese growth is a factor driving metals prices higher, and
the CRB index was up over the year.
31 December saw a major development in the form of the UK’s decoupling – at last – from the EU. The
trade agreement means no tariffs or quotas for goods, although there are bureaucratic frictional costs. As
the UK depends heavily on services, where exports to the EU may suffer, and has a trade deficit in goods
with the EU, the deal looks better from Brussels than it does from London. And too bad if low-wage
workers from Eastern Europe are no longer able to cross the border. The City has already been drained of
some of its brains to the Continent. But the country has always proved resilient and will remain an
attractive option for investors.
- 11 -2/1/2021
STRATEGY OVERVIEW
The US economy remains buoyant
US corporate earnings to rebound sharply
Although the recession in America was far worse in 2020 than that of 2008, profits were hit less last year
than they were during the financial crisis. S&P 500 earnings fell 28% in 2008, remained subdued through
2009 and rebounded only in 2010. In 2020 they declined 16.6%, and that figure may be corrected to the
better with Q4 figures that typically come in better than consensus estimates. The difference between
then and now is that 2008 was a financial crisis; at the time, the financial sector accounted for 17.5% of
the index and 25% of its profits. Those profits evaporated with the subprime crash. Similarly, energy
accounted for 13.3% of index capitalisation in 2008 and far more in terms of profits. Its weighting in the
index was down to 4.3% by the end of 2019 and its impact on index profits was correspondingly limited.
This time around the strong performance of stocks linked to the digital economy made all the difference.
Expectations of a rebound in profits this year seem solid enough and consensus estimates are generally
subject to upward revision. The overall figure for index EPS growth is 22.5%, which if fulfilled would leave
profits short of 2019 levels. Most of the gain will come from firms that posted sharply lower profits in 2020
but are set to rebound. In banking, for example, Wells Fargo reported profits of $16.7 billion in 2019, $1.58
billion in 2020 and expects $7.9 billion this year, amounting to a $6.3 billion increase. Other big reversals
include Exxon Mobil ($6.074 billion), American Airlines ($5.5 billion), JP Morgan ($4.901 billion), Delta
Airlines ($4.534 billion), United Airlines ($4.225 billion), Ford Motor Company ($4.112 billion), Boeing
($3.812 billion), Chevron ($3.463 billion) and Microsoft ($3.036 billion). Note that Microsoft is the only
name in this list looking at a genuine increase in earnings rather than a rebound, and the improvements
from airlines tend to mean smaller losses.
- 12 -2/1/2021
STRATEGY OVERVIEW
An upswing in profits in 2021…
… especially in cyclical sectors and finance
This overview highlights the scale of the recovery in cyclicals hit by the crisis as well as financials. Growth
sectors will live up to their name, notably IT expected up 14% and Communication Services (Google,
Facebook, Netflix etc.,) up 13%. Healthcare earnings are expected up 10%. The cyclical goods sector is a
bit of a mishmash, extending as it does from aviation to internet heavyweights like Amazon. The real
estate sector will remain depressed this year. The industrial sector’s turnaround reflects its aircraft
component as well as its representation among more traditional firms such as General Electric, FedEx,
- 13 -2/1/2021
STRATEGY OVERVIEW
Deere and Caterpillar. Higher metals prices on the back of Chinese demand are benefiting the basic
materials sector. Consumer staples will continue with modest growth.
The consensus estimate for 2022 is another 13.5% in EPS growth. Given the scale of the rebound this year,
we find that rather optimistic and would pencil in 9%.
PERs have surged with the rally, to 22.5x 2021 and 19.2x 2022. The market’s earnings yield is 4.4% and its
gross dividend yield is 1.6%. While multiples at these levels are unusually high, interest rates close to zero
over an extended period are unprecedented as well. Mathematically speaking, an asset generating any
return at all in a context of zero interest rates has infinite value. Given that the US 30-year yield is 1.6%,
even the slightest increase in dividends over the long term can justify the asset’s value (although it does
not take account of a risk premium).
Market valuations
The 30-year yield we use for our S&P 500 model is 1.66%, compared with 1.62% last month. In the light of
upward revisions to earnings estimates, we have left the 2021 consensus figure as it is. We have increased
our estimate for profits in 2022 slightly, but it is still well below the consensus figure; this raises our 8-year
CAGR from 5.6% to 6%. As the US economy can be expected to grow by 2.5% with 2% inflation over the
period, this implies that margins will increase. That is a bit of a worry at first sight, as US margins are
already at their highs. But it is perhaps less worrying if we consider the digitalisation of the whole
economy, a process that is associated with very high margins indeed: 38% at Microsoft, 20% at Apple and
24% at Alphabet, for example. Then again, massive margins are also associated with monopolistic market
positions that risk falling foul of antitrust legislation.
Another factor liable to affect our valuations is the risk premium investors require to hold equities. We
have left it at 3% for the past 20 years, but the fact that central banks now appear to intervene vigorously
with every major risk – as during the pandemic – suggests that the premium should not be as high as that. It
means that our valuations are very cautious, especially if you believe that we are about to enter a decade
of renewed, balanced growth. That would imply a green economy and a successful energy transition.
Electric cars are making quicker headway than we could have imagined, and Tesla’s $582 billion
capitalisation exceeds that of all carmakers in the MSCI World index combined. Deloitte believes that EVs
will account for 32% of all car sales in 2030; all carmakers are looking to establish themselves in this
segment. At the same time, renewables already account for 30% of electricity production. New technology
is transforming the energy and transport sectors. The next generation of transport heavyweights is likely to
be American and Chinese; the IT-poor European auto sector is under serious threat.
Widening inequalities and poor purchasing power among the less wealthy among us have slowed economic
growth in recent years. There is no point in producing electric cars that only the very wealthiest can
afford. The 500 wealthiest Americans added $1,700 billion to their net worth last year, and most of that
was concentrated in a handful of the richest even in that exclusive club. This does little for the real
economy, which is why governments have to print money to keep poorer households afloat. Incoming
Treasury Secretary Janet Yellen often pointed this out when she was at the Federal Reserve. The idea of
wealth taxation is resurfacing in Washington, and the Democratic Congress may take it seriously alongside
higher corporation tax. That might give bulls on Wall Street something to think about.
Our model is struggling to keep up with the market. Last month’s objective of 3,551 points was left in
tatters with a close at 3,752 points. Our objective for 2021 is 3,753 points, to which investors should add
the 1.6% dividend yield. Given that 30-year yields are unlikely to fall from here, additional support for the
- 14 -2/1/2021
STRATEGY OVERVIEW
market will have to come from better news on profits and therefore a vigorous economic recovery that
heightens optimism. Coming announcements for Q4 will help to formulate views on this year.
Our valuation does show that there is no bubble, at least not yet. We typically grow wary when the market
exceeds our objective by 10% or more. This means that we are maintaining our overweight equities
recommendation. Like every other investor, we have cash without any other home.
Wall Street sensitive to long rates, but profits on track
S&P 500 - Valuation end 2021 except implied scenario
CAGR Compounded Annual Growth Rate from 2020 30 Years Gvt bonds
1.25% 1.50% 1.66% 1.75% 2.00%
Slow recovery: -17% in 2020, 16.4% in 2021 - CAGR 4.1% 3 628 3 392 3 255 3 182 2 994
Implied Scenario CAGR 6% over 8 years 4 170 3 893 3 732 3 646 3 425
Return to normal: -16.6% in 2020, 22.5% in 2021 - CAGR 6% 4 185 3 912 3 753 3 668 3 450
Current Index S&P 500 3 756
In the euro zone the weighted average 30-year yield is an unchanged 0.25%. Consensus estimates for 2020
are no longer heading lower and some analysts are actually moving the other way. Earnings are expected
to have dropped 36% in 2020 and to rise 29% this year, well short of making good the damage. Even so, this
outlook is better than once thought and for that reason we have raised our objective for the MSCI EMU to
146 points, compared with a close of 129 at the time of writing.
MSCI EMU - Valuation end 2021 except implied scenario
CAGR Compounded Annual Growth Rate from 2020 30 Years Gvt bonds
0.00% 0.10% 0.25% 0.40% 0.50%
Slow recovery: -36% in 2020, 16% in 2021 - CAGR -4% 126 122 116 111 108
Implied Scenario: CAGR -2.9% over 8 years 140 135 129 123 119
Return to normal: -36% in 2020, 29% in 2021 - CAGR -1.1% 158 153 146 139 135
Current Index MSCI EMU 129
- 15 -2/1/2021
STRATEGY OVERVIEW
Conclusions
For the 30 years of its existence, this monthly letter has attempted to offer original insights into the state of
the financial markets. But all things come to an end, and the time has now come for me to hand over to the
Chahine Capital team. The encouragement that I have received over the years has been the biggest reward
of my career. As far as Chahine Capital’s own career is concerned, it continues under the wing of Iris Finance
with assets now totalling a billion euros. Its performance has been even more impressive, at an annualised
11.2% and 11.7% over ten years for its two flagship funds.
2020 was an “annus horribilis”, as Queen Elizabeth remarked of an earlier time. Covid has spared nobody,
but despite the economic damage it inflicted it was a stellar year for equities overall. The MSCI World index
gained 14.1% in local currency terms and 16.5% in dollars, but performance was far from even and confirmed
the pre-eminence of the digital economy led by the USA and now China, the new kid on the block. Wall
Street progressed 21.4%; emerging markets were up 19.5%, almost entirely because of stocks listed in
mainland China (up 69%) and Hong Kong (up 22.4%). The digital economy was the major beneficiary of the
crisis, hence these performance numbers. The top ten contributors to world performance account for 10% of
that 16.5% MSCI World gain, and all are Gafam-type stocks. Some of China’s equivalents appreciated by five
to ten times over. The Chinese stock market is unchallenged as the second largest in the world, but it is a
risky prospect given its lack of transparency and state interference, as Alibaba knows to its cost. China also
lacks a Microsoft, on which it is 85% dependent, and is desperate to establish a local OS. Hacking and
aggressive hiring of the best brains in the business are all fair game. At the other end of the scale, energy,
finance and real estate were big losers over the year, as were a wide range of sectors directly exposed to the
pandemic, such as air transport and leisure. Steep rate cuts and massive liquidity injections fuelled the
market’s appreciation, with the help of a second wind in the form of good news on vaccines.
On 28 March we switched from an underweight to an overweight recommendation on equities; that was at
2,600 points for the S&P 500 and our position has not changed since even though the index closed the year at
a record 3,756 points. Our other recommendations during the year were to buy gold at $1,780 per ounce via
futures and to reduce dollar exposure at 1.18 to the euro. We are keeping those recommendations in place
for 2021. The dollar is a casualty of negative real interest rates, a widening US trade deficit and the prospect
of yet more liquidity injections this year. Gold is a good response to this situation.
China’s burgeoning imperialism will be the major theme of 2021. Hong Kong has ben muzzled, Germany is
threatened with a boycott of its cars if it does not opt for Huawei, and the Chinese government is not good
at respecting agreements that it has made. Joe Biden’s arrival in the White House could create a united
front with the EU against China, but China is proving adept at divide-and-rule and knows that the EU is not
itself entirely united. Unexpectedly quick progress on vaccines should tame the pandemic, and although
vaccination programmes have sometimes proved chaotic, governments and the pharmaceutical majors will
get their act together and we ought to be looking at normal holidays this summer. The decline in world GDP
was limited to 3.77% last year and we are set for a 5.1% rebound in 2021. Asian economies are set to perform
best of all, and especially China at 8.3%. The US economy is also rebounding strongly, and we note a jump in
the house price inflation rate to 7%. Brexit is done at last and the EU will be less affected by it than the UK.
We expect US profits to jump 22.5% this year after a drop of ‘only’ 16% in 2020 concentrated in energy and
finance. The S&P 500’s 2021 PER is 22.5 and its dividend yield is 1.6%. Our model suggests that the market is
fully valued; we have an objective of 3,753 points for year-end, in line with its 2020 close. It implies a 30-
year yield of 1.66% and an 8-year CAGR of 6%; as that is higher than nominal GDP growth, it means another
jump in margins via digital transformation. We are maintaining our recommendation to overweight equities.
Jacques Chahine
- 16 -2/1/2021
STRATEGY OVERVIEW
Main ratios for markets and sectors as of 31/12/2020 (in local currency)
Data as of Weight vs Perf Weighted P/E % Wted EPS Chge Div Yield Revision vs M-2%
31/12/20 MSCI World 2020 2019 2022 2021 2022 2021 2020 2021 Fiscal 22 Fiscal 21
MSCI The World Index 100.0% 13.67% 25.29% 17.9 x 20.7 x 16.0% 23.2% -16.8% 2.00% 2.0% 1.6%
MSCI USA 64.3% 18.22% 29.00% 20.1 x 23.4 x 16.1% 19.1% -13.4% 1.52% 0.7% 0.6%
MSCI Japan 8.3% 5.56% 15.73% 14.8 x 18.0 x 21.2% 34.7% -17.7% 2.23% 1.4% 1.3%
MSCI EMU 13.0% -2.55% 21.69% 14.6 x 17.4 x 19.2% 35.2% -35.9% 2.94% 0.2% 0.4%
MSCI Europe 23.0% -4.85% 22.17% 14.6 x 16.9 x 15.9% 30.1% -32.3% 3.11% 0.3% 0.7%
MSCI Europe ex Energy 22.1% -2.53% 23.79% 14.9 x 17.0 x 14.1% 25.1% -27.5% 3.01% 0.5% 0.7%
MSCI Austria 0.1% -13.01% 13.38% 10.0 x 13.0 x 29.8% 53.1% -48.9% 3.42% -0.1% 3.1%
MSCI Belgium 0.5% -14.74% 19.37% 17.4 x 20.9 x 19.7% -3.1% -31.0% 2.59% -0.2% -0.9%
MSCI Denmark 0.9% 30.78% 28.95% 23.3 x 26.2 x 12.4% 22.3% -2.4% 1.60% 0.5% 0.4%
MSCI Finland 0.4% 9.35% 8.28% 18.1 x 20.2 x 11.3% 12.6% -16.5% 3.51% 0.5% 0.5%
MSCI France 4.7% -5.01% 26.10% 15.0 x 18.1 x 20.6% 56.5% -45.3% 2.95% -0.1% -0.2%
MSCI Germany 3.4% 0.56% 20.10% 13.4 x 15.7 x 17.3% 22.2% -20.3% 2.78% 0.4% 1.0%
MSCI Great-Britain 4.4% -14.36% 11.37% 12.3 x 14.2 x 15.6% 36.3% -36.1% 3.94% 0.2% 1.2%
MSCI Ireland 0.1% -9.11% 21.49% 26.1 x 28.3 x 8.4% 120.5% -65.4% 0.82% 0.6% 0.1%
MSCI Italy 1.0% -7.72% 25.49% 11.3 x 13.8 x 22.5% 62.6% -48.2% 4.07% 0.0% 0.3%
MSCI Netherlands 1.7% 10.87% 26.85% 18.8 x 21.9 x 16.8% 27.8% -28.0% 2.01% 0.6% 0.2%
MSCI Norway 0.3% -6.29% 8.26% 13.5 x 15.6 x 15.2% 31.1% -24.3% 3.97% -0.8% 2.0%
MSCI Spain 1.0% -14.88% 9.85% 13.4 x 16.5 x 22.9% 21.7% -46.8% 4.05% 0.0% 0.9%
MSCI Sweden 1.2% 8.92% 25.01% 16.6 x 17.3 x 4.5% -3.4% -18.2% 3.11% 0.0% 0.0%
MSCI Switzerland 3.1% 0.15% 26.97% 16.7 x 18.4 x 9.8% 16.4% -10.3% 2.88% -0.1% 0.0%
MSCI Europe Consumer Discretionary 3.4% 5.74% 30.01% 16.0 x 20.1 x 25.7% 212.2% -70.2% 1.89% 0.6% 0.3%
MSCI Europe Consumer Staples 3.2% -5.24% 22.38% 17.2 x 18.7 x 8.7% 8.8% -10.3% 3.06% 0.3% 0.1%
MSCI Europe Energy 1.0% -37.27% 3.55% 9.6 x 14.5 x 50.7% 399.2% -88.4% 5.31% -2.4% 0.7%
MSCI Europe Financials 3.4% -17.39% 17.31% 9.4 x 11.2 x 18.2% 22.5% -37.5% 4.51% 0.4% 0.4%
MSCI Europe Health Care 3.0% -3.07% 28.40% 15.1 x 16.8 x 10.7% 7.7% -3.0% 2.78% -0.5% -0.3%
MSCI Europe Industrials 3.2% 3.33% 32.02% 18.4 x 21.9 x 18.7% 59.2% -43.5% 2.25% 0.1% 0.3%
MSCI Europe Information Technology 1.6% 15.05% 36.00% 25.2 x 29.4 x 16.8% 10.9% -11.1% 1.04% 0.1% -0.4%
MSCI Europe Materials 1.7% 7.08% 21.39% 15.8 x 16.2 x 2.3% 8.8% 2.6% 3.55% 4.1% 5.9%
MSCI Europe Real Estate 0.3% -15.06% 18.93% 16.0 x 16.1 x 0.5% -5.8% -15.7% 3.75% 2.0% 5.6%
MSCI Europe Communication Services 1.0% -16.30% 0.60% 13.1 x 14.9 x 13.3% 11.5% -23.4% 4.47% -1.3% -0.2%
MSCI Europe Utilities 1.3% 8.43% 24.29% 16.0 x 17.3 x 7.7% 11.0% -10.4% 4.38% 0.4% 0.0%
Benchmarks source iShares ETF - Data as of 31/12/2020
- 17 -2/1/2021
STRATEGY OVERVIEW
Disclaimer
We do not warrant, endorse or guarantee the completeness, accuracy, integrity, or timeliness of the information provided in this publication. You must
evaluate, and bear all risks associated with, the use of any information provided here, including any reliance on the accuracy, completeness, safety or
usefulness of such information. This information is published solely for information purposes, and is not to be construed as financial or other advice or as an
offer to sell or the solicitation of an offer to buy any security in any jurisdiction where such an offer or solicitation would be illegal. Any information
expressed herein on this date is subject to change without notice. Any opinions or assertions contained in this information do not represent the opinions or
beliefs of the publisher. The publisher or one or more of its employees or writers may have a position in any of the securities discussed herein.
THE INFORMATION PROVIDED TO YOU HEREUNDER IS PROVIDED “AS IS,” AND TO THE MAXIMUM EXTENT PERMITTED BY APPLICABLE LAW, J.CHAHINE CAPITAL
AND ITS AFFILIATES, BUSINESS ASSOCIATES AND SUPPLIERS DISCLAIM ALL WARRANTIES WITH RESPECT TO THE SAME, EXPRESS, IMPLIED AND STATUTORY,
INCLUDING WITHOUT LIMITATION ANY IMPLIED WARRANTIES OF MERCHANTABILITY, FITNESS FOR A PARTICULAR PURPOSE, ACCURACY, COMPLETENESS, AND
NO INFRINGEMENT. TO THE MAXIMUM EXTENT PERMITTED BY APPLICABLE LAW, NEITHER DIGITAL ANALYTICS NOR ITS AFFILIATES, NOR THEIR RESPECTIVE
OFFICERS, MEMBERS DIRECTORS, PARTNERS, BUSINESS ASSOCIATES OR SUPPLIERS WILL BE LIABLE FOR ANY INDIRECT, INCIDENTAL, SPECIAL, CONSEQUENTIAL
OR PUNITIVE DAMAGES, INCLUDING WITHOUT LIMITATION DAMAGES FOR LOST PROFITS OR REVENUES, GOODWILL, WORK STOPPAGE, SECURITY BREACHES,
VIRUSES, COMPUTER FAILURE OR MALFUNCTION, USE, DATA OR OTHER INTANGIBLE LOSSES OR COMMERCIAL DAMAGES, EVEN IF ANY OF SUCH PERSON IS
ADVISED OF THE POSSIBILITY OF SUCH LOSSES, ARISING UNDER OR IN CONNECTION WITH THE INFORMATION PROVIDED HEREIN OR ANY OTHER SUBJECT
MATTER HEREOF.
The contents of these pages, including text and graphics, are protected by the copyright laws of the Luxemburg and other foreign jurisdictions. No portion
may be reproduced in any form, or by any means, without the prior written consent of Chahine Companies. To obtain reproduction consent, e-mail
info@chahinecapital.com.
- 18 -You can also read