Atmospheric Ray Tracing: An efficient, open-source framework for finding eigenrays in a stratified, moving medium
←
→
Page content transcription
If your browser does not render page correctly, please read the page content below
Acta Acustica 2021, 5, 26
Ó P. Schäfer & M. Vorländer, Published by EDP Sciences, 2021
https://doi.org/10.1051/aacus/2021018

                                                                                                                        Available online at:
                                                                                                         https://acta-acustica.edpsciences.org

 SCIENTIFIC ARTICLE

Atmospheric Ray Tracing: An efficient, open-source framework
for finding eigenrays in a stratified, moving medium
Philipp Schäfer* and Michael Vorländer
Institute for Hearing Technology and Acoustics, RWTH Aachen University, Kopernikusstraße 5, 52074 Aachen, Germany

            Received 18 March 2021, Accepted 12 May 2021

            Abstract – In this paper, an open-source framework for ray tracing in a stratified moving medium is intro-
            duced. This framework provides an efficient method to find eigenrays connecting a source with a receiver
            and is designed for the purpose of aircraft noise auralization. The method is tested with respect to accuracy
            and run-time in an aircraft flyover scenario and compared to a state of the art method. The investigation
            showed that this method provides eigenrays with preset accuracy for source positions most relevant for flyover
            scenarios and that it is significantly faster than the state of the art method. According to the performance
            analysis, the presented approach has great potential for integration into future real-time auralizations of
            aircraft noise.

            Keywords: Ray Tracing, Stratified, Moving medium, Aircraft noise, Auralization, Open-source

1 Introduction                                                              receiver are required. Each model provides parameters
                                                                            which are then fed into the digital signal processing
    Aircraft are one of the major sound sources with respect                (DSP) elements of the actual auralization framework. The
to noise pollution [1]. Especially residents living close to                separation between these models is not always strict.
airports can suffer from aircraft noise. Noise recommenda-                  However, if separated properly, an exchange of a single
tions are typically based on time-averaged sound level                      component is possible. The source model provides the
metrics like Lden or Lnight [1], which account for human per-               “raw” time-domain sound signal with appropriate power
ception just in a very basic manner. For example, it was                    emitted by a source which is used at the beginning of the
shown that a reduced noise level does not necessarily lead                  processing chain. Additionally, the model should provide
to a reduction of noise annoyance [2]. Thus, development                    a directivity function representing the directional sound
has been undertaken to enhance aircraft design using                        emission into the far field. The receiver model is the inter-
perception-based methods [2–4]. Through the concept of                      face to the 3D audio reproduction which is based on the
auralization, different aircraft designs can be evaluated                   incident directions of sound waves at the receiver position.
and compared, e.g. by presenting synthesized aircraft noise                 Typical reproduction methods are binaural synthesis using
in listening tests. The same approach can be used to com-                   headphones, or Ambisonics and VBAP using loudspeakers.
municate these design changes to residents [5]. In both                     Finally, the sound propagation model represents the impact
cases, real-time auralization embedded in auditory-visual                   of the environment between source and receiver. This
virtual reality technology can advantageously enable                        includes effects like spreading loss, medium attenuation
quasi-instantly changes to the sound propagation condi-                     and interaction with obstacles, e.g. specular reflections.
tions. For example, the user could flip the wind direction                       Many approaches exist for simulating the sound propa-
or change between daytime and nighttime weather condi-                      gation in the atmosphere. Wave-based approaches usually
tions. In contrast to precomputed scenarios, the respective                 provide relatively accurate results with uncertainties just
parameters can be adjusted freely within their physical                     due to uncertain input data. Typical examples are fast-field
limits. However, for this purpose, the underlying models                    program (FFP), parabolic equation (PE) and the finite-
must be very efficient with regard to the computation time.                  difference time-domain (FDTD) method [7]. Due to their
    The process of auralization can be separated into repre-                accuracy these methods are very suitable for providing
sentations for sound generation, propagation and reproduc-                  benchmarks. For example, Kirby recently released a semi
tion [6]. For this purpose, a model to characterize the                     analytic framework for atmospheric sound propagation
source, the sound transmission (or propagation) and the                     based on the finite element method [8]. However, the wave-
                                                                            based approaches are computationally slow and therefore
*Corresponding author: psc@akustik.rwth-aachen.de                           less convenient for the purpose of auralization, especially
This is an Open Access article distributed under the terms of the Creative Commons Attribution License (https://creativecommons.org/licenses/by/4.0),
              which permits unrestricted use, distribution, and reproduction in any medium, provided the original work is properly cited.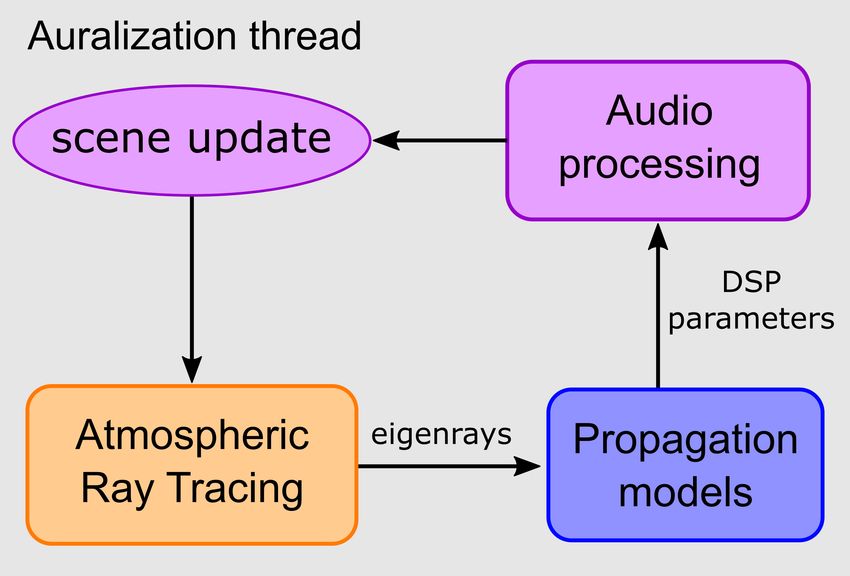
2                                 P. Schäfer and M. Vorländer: Acta Acustica 2021, 5, 26

if real-time processing is required. Additionally, these meth-    through an inhomogeneous, moving atmosphere. It is
ods typically do not provide the incident direction of the        designed for the purpose of auralizing aircraft noise, but
sound waves at the receiver as required for the 3D sound          can also be used for other applications. ART considers refrac-
reproduction, at least not without post-processing for spatial    tion caused by inhomogeneity of speed of sound and wind. In
(directional) wave decomposition. Directional information,        contrast to the effective sound speed approach, it also consid-
however, is directly available in the case of models based        ers the wind component perpendicular to the propagation
on the concept of geometrical acoustics. Using a high-            direction (advection). In the context of auralization, it is
frequency approximation by neglecting wave-based effects          desired to find the rays connecting a source with a receiver,
such as scattering and diffraction, sound waves can be            which are called eigenrays [7]. Hence, this framework pro-
reduced to sound paths or rays [7, 9]. This approach has a        vides an efficient method to determine eigenrays for the
significant advantage in terms of computational complexity.        direct sound and the ground reflection in a 3D environment.
Knowing the sound paths connecting a source and a receiver,           ART is part of the C++ library collection ITAGeomet-
the acoustic properties, such as spreading loss and medium        ricalAcoustics.1 It comes with a Matlab interface2 that
attenuation, can be determined based on appropriate               allows a fast and easy simulation of sound paths emitted
models. These, again form the basis for the actual audio          by a source and finding eigenrays connecting a source and
processing.                                                       with a receiver. A working binary of this interface can be
     Many state of the art auralization frameworks for            found in the Supplementary Data.
aircraft noise use a sound propagation model based on geo-            The following sections provide a detailed discussion of
metrical acoustics [3, 5, 10, 11]. A typical assumption is that   the models and methods used in the framework. This
the sound paths between the aircraft and receiver are             includes the model for the atmosphere, the utilized ray
straight [3, 5, 11]. Such a model is very easy to implement       equations, the ground reflection, as well as the adaptive
as the sound paths for direct sound and the ground reflec-         ray zooming method, which is used to speed up the process
tion can be found using deterministic algorithms like the         of finding eigenrays. Finally, a brief overview on how to
image source method. Most importantly, it is extremely effi-       derive acoustic parameters for the auralization from these
cient; Sahai et al. [5] actually introduced a real-time capable   eigenrays is given.
system based on this approach.
     In the atmosphere, sound propagates on curved paths          2.1 Stratified atmosphere model
due to refraction and advection caused by the inhomogene-
ity and movement of the medium [7]. As first observed in               When simulating sound propagation in the atmosphere,
studies by Reynolds [12, 13], this can have an audible impact     obviously, the speed of sound c and wind (medium move-
on the perceived sound. Using a more computationally com-         ment) v have to be considered. The latter is a vector point-
plex method like ray tracing, these effects can be considered,    ing in wind direction vdir while its length corresponds to the
while still allowing for reasonable computation times. For        wind velocity v. Generally, both parameters vary through-
this purpose, Arntzen et al. [10] introduced an efficient          out the medium. This inhomogeneity or more specifically,
method to find the eigenrays, the sound paths connecting           the gradients rc and rv, lead to sound refraction [14].
a source with a receiver, in a stratified moving medium.           Thus, in order to execute ray tracing in the atmosphere, a
However, their method is based on the effective sound speed       proper model for all of the above mentioned parameters is
approximation neglecting the effect of advection which can        required.
have a considerable influence on the sound paths [7].                  An important assumption for the ray tracing process is
Furthermore, details about the implementation are not             that all atmospheric parameters are timeindependent and
revealed and consequently, the code is not open-source.           therefore typically time-averaged values are considered [7].
     Thus, the present work introduces an open-source ray         With respect to turbulence, the corresponding time scale
tracing framework for the purpose of aircraft noise auraliza-     is assumed to be small compared to the acoustic period
tion. This approach considers both effects, refraction and        and travel time. Hence, turbulence does not affect the
advection. It provides an efficient method similar to the          resulting sound paths. It can be included during the aural-
one by Arntzen et al. to find eigenrays in a stratified moving      ization process using time-variant filters [15].
medium. The objective of this study is to determine the               Furthermore, a common simplification for the atmo-
performance of this algorithm in terms of accuracy and            sphere is the so-called stratified medium [7]. For this model,
real-time capability in the context of aircraft auralization.     it is assumed that all atmospheric parameters depend on
For this purpose, a typical flyover scenario using an aircraft     altitude z only. Additionally, the vertical component of the
take-off trajectory is simulated. The algorithm is evaluating     medium movement vz is often neglected, since it is typically
with respect to run-time and accuracy of the eigenrays and        exceeded by its horizontal component v\ by a factor of
compared to the state of the art method.                          10–100 [7]. This simplified model has multiple advantages.
                                                                      First, there are analytic models available, which allow
                                                                  an easy implementation of the atmospheric properties. This
                                                                  is especially convenient regarding temperature and medium
2 Atmospheric Ray Tracing
                                                                  1
                                                                    https://git.rwth-aachen.de/ita/ITAGeometricalAcoustics
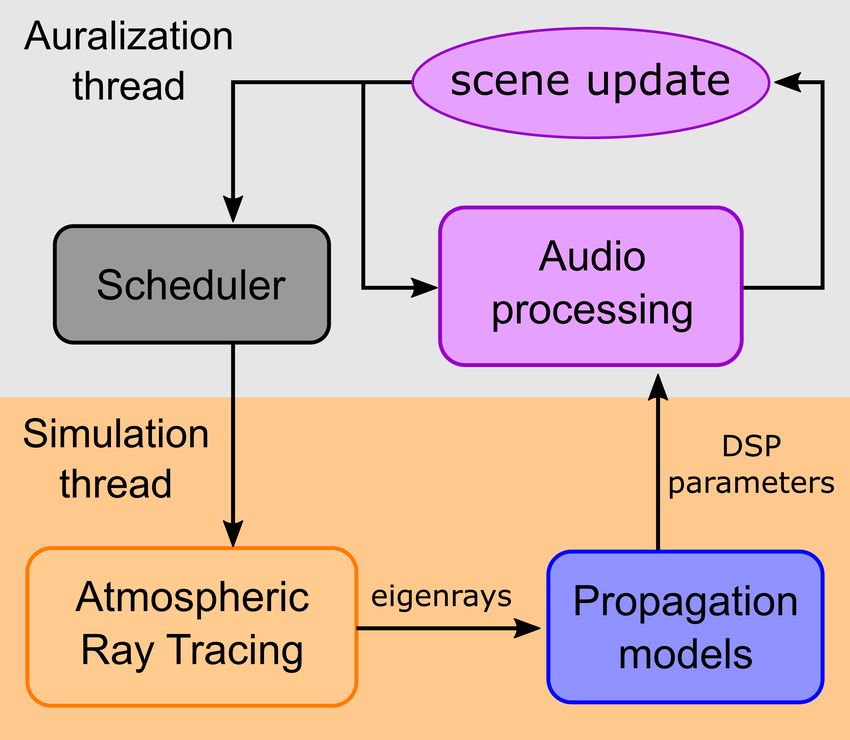
   The Atmospheric Ray Tracing (ART) framework is an              2
                                                                    https://git.rwth-aachen.de/ita/ITAGeometricalAcoustics/-/
open-source C++ tool to simulate sound propagation                tree/master/apps/ARTMatlab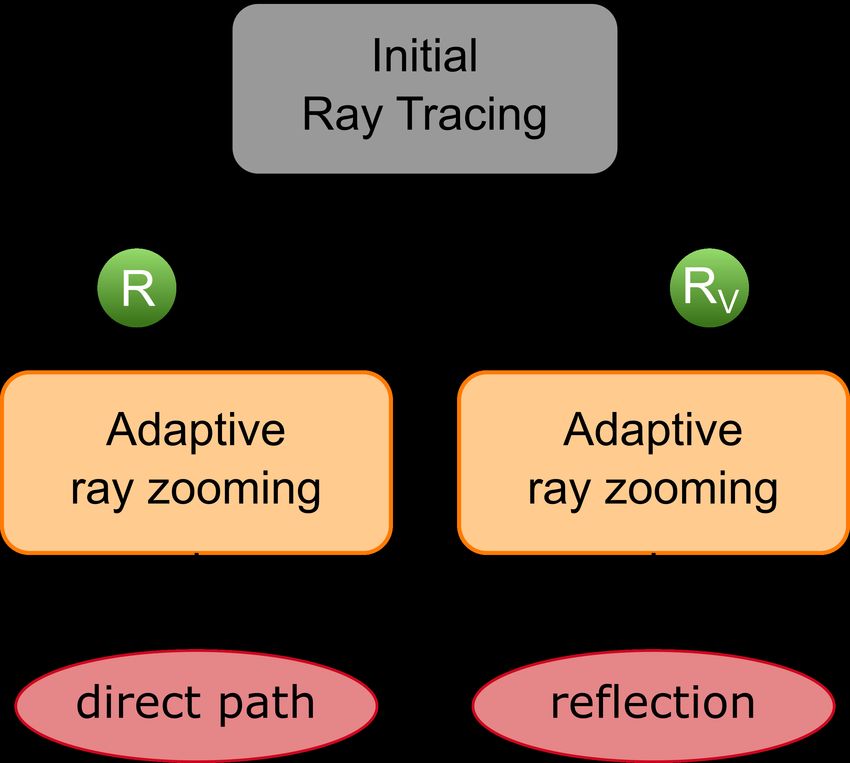
P. Schäfer and M. Vorländer: Acta Acustica 2021, 5, 26                                             3

movement, since also for their gradients an analytic formula     Nevertheless, the humidity is accounted for by calculating
can be found implicitly. It should also be noted, that based     the medium attenuation, as shown later in Section 2.5.
on the assumptions mentioned    above
                                      the horizontal gradi-        In addition to using analytic formulas, the profiles can be
ents are negligible r ! 0; 0; dzd . Another advantage            imported as altitude-dependent data sets. Internally, these
of using analytic models is that they allow an easy compar-      data are then represented by piecewise polynomials which
ison between different sound propagation tools. For the          are generated using cubic splines. This allows not only a fast
temperature, the vertical gradient depends on several            and robust interpolation between the data points, but also
factors, e.g. humidity and altitude. The International           evaluation of the gradients of temperature and wind vector
Standard Atmosphere (ISA) [16] provides a simplified              based on the derivative of the respective polynomials with
model for the troposphere (z < 11 km) assuming a constant        respect to z. The previously mentioned Matlab interface
gradient and dry air:                                            provides a routine to directly import data files based on
                                      K                          atmospherics soundings provided on [18]. However, it is also
                  T ðzÞ ¼ T 0  0:0065  z;               ð1Þ    possible to import data using Matlab vectors/matrices,
                                      m
                                                                 which allows importing from other sources.
where T0 = 288.15 K is the temperature at mean sea level.
For the medium movement, the logarithmic wind profile             2.2 Ray equations
[17] is a suitable model within the atmospheric surface
layer. According to this model, the wind velocity v = |v|            Generally, rays can be interpreted as a trajectory gener-
is zero below the so-called surface roughness z0. Above,         ated by the movement of a fixed point on a wavefront
it increases logarithmically:                                    normal [20]. Thus, rays propagating through an inhomoge-
                                                               neous, moving medium like the atmosphere can be
                            v    z                              described using two vectors: a fix point on a wavefront
                     vðzÞ ¼  ln     :               ð2Þ
                            K     z0                             r = (x, y, z) and the corresponding wavefront normal n.
                                                                 As the wavefront propagates, the wavefront normal
Here, K denotes the so-called Kármán constant, which is          changes due to refraction caused by the inhomogeneity of
approximately 0.40 [17], while v refers to the friction         the medium on the one hand. On the other hand, the wind
velocity.                                                        vector v = v(r) and the speed of sound c = c(r) change with
    Another advantage of the stratified medium, is that           the position of the wavefront. This leads to a system of ordi-
weather measurement data which is publicly available is          nary differential equations (ODEs) in respect to time, one
typically altitude-dependent, e.g. from atmospheric sound-       regarding the velocity of the fix point dtd r (also referred to
ings [18], and therefore is ready to be used. Furthermore,       as group velocity [7]) and one for the refraction dtd n.
the assumptions underlying this model also can speed up              An efficient formulation of these ray equations is given
the ray tracing algorithm as will be shown in Section 2.2.       by Pierce [9], which is also used in this approach. Pierce,
    In the ART framework, the stratified atmosphere is rep-       instead of using the wavefront normal directly, uses the
resented by a flexible class, which allows selection from a set   so-called wave slowness or slowness vector,
of predefined profiles for temperature, static pressure, wind
                                                                                                n
and relative humidity. In addition to the above mentioned                               s¼             :                    ð4Þ
ISA model, a constant profile can be used for temperature                                     cþnv
and static pressure. For the wind profile, the predefined          While this vector points into the same direction as n,
profiles use a wind velocity which is either logarithmic          its norm equals the reciprocal of the effective speed of
(Eq. (2)), constant or zero (meaning no medium move-             sound, which is the reason for its name. The main advan-
ment). For each of these profiles, the wind direction is          tage of this approach is, that for a stratified medium as
altitude-independent. Also for the relative humidity, a con-     described in Section 2.1, the x- and y-components of s are
stant value can be selected. Most of the above mentioned         constant along a ray [7].3 Thus, the ODE for the refraction
profiles, can be further parametrized by the user, e.g. by        can be reduced from three dimensions4 to one, which
setting the wind direction and friction velocity of the          reduces the computational effort. Then, the equation for
logarithmic wind profile. Note, that the class representing       the z-component of s becomes,
the atmosphere is designed in a modular way, so that an
extension of additional analytic profiles is possible.                              d         X d           d
                                                                                      sz ¼       c  s ?  v? ;                  ð5Þ
    For the speed of sound, the formula,                                           dt        c dz          dz
                             pffiffiffiffiffiffiffiffiffiffiffiffiffiffiffiffiffiffi                 with X = 1  v\s\. In the equation above, the index \
                     cðzÞ ¼ cR  T ðzÞ;                    ð3Þ
                                                                 refers to the horizontal components of the respective vec-
is used as in Ref. [19]. Here, c = 1.4 is the adiabatic index    tors. In contrast, the equation for the ray velocity [7, 9],
                      2
and R = 287.058 ms2 the molar gas constant for dry air.                            d                 c2
Generally, the speed of sound also depends on the specific                             r ¼ c  n þ v ¼ s þ v;                      ð6Þ
                                                                                   dt                X
humidity (see (1.1) in [7]). However, in order to reduce the
required input data, this is neglected in its influence on        3
                                                                   see (3.64) in [7] using s = b/c0.
the speed of sound. Additionally, this significantly reduces      4
                                                                   see (8–1.10a)/(8–1.10b) in [9] or (10.72)/(10.73) in [7] for a full
the complexity of the speed of sound gradient formula.           set of equations.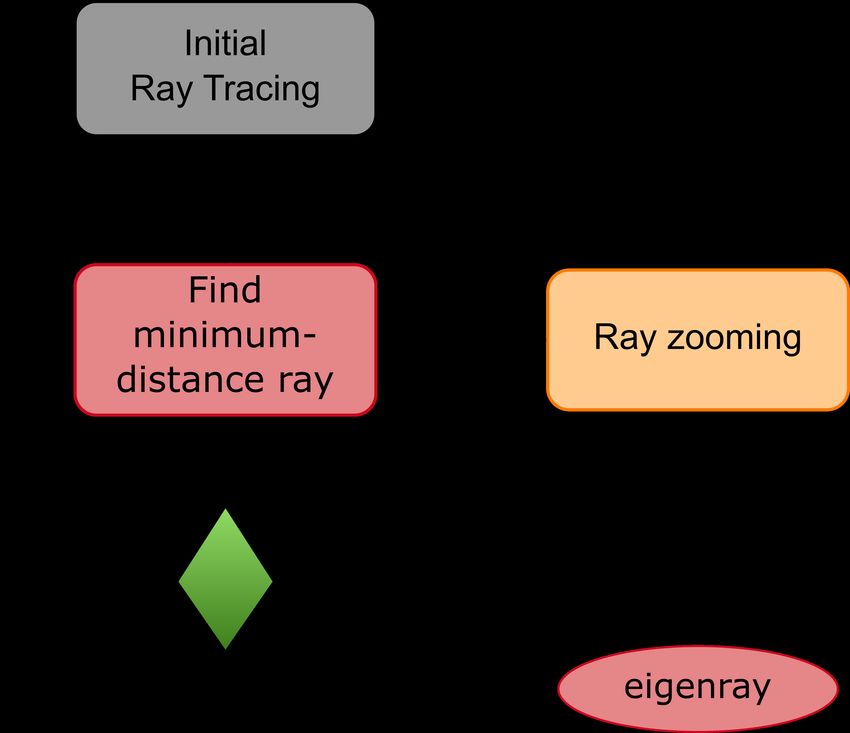
4                                 P. Schäfer and M. Vorländer: Acta Acustica 2021, 5, 26

is three-dimensional leading to a system of four equations        normal (incident direction) can be determined doing a lin-
in total.                                                         ear interpolation between those steps. This information is
    Knowing the initial values for r (e.g. source position)       stored, since it is of interest in the context of auralization,
and n or s respectively (initial ray direction), Equations        e.g. when applying a reflection factor.
(5)–(6) can be solved using numerical methods like the                When using the ray tracing results outside of the ray
Euler or Runge–Kutta (RK4) method to estimate the ray             tracing algorithm (e.g. for visualization of sound paths), it
trajectory. Although the presented framework allows to            is usually desirable to mirror parts of the rays which are
use either of the mentioned methods, using the Euler              below the ground. For this purpose, the z-components of
method is not recommended, due to its lack of accuracy            r and n can be corrected using,
and stability [21]. Hence, all results presented in this paper,
                                                                                z0 ¼ jzj and    n0 z ¼ signðzÞ  nz :        ð8Þ
are based on the RK4 method. Solving these ODEs using a
certain time step size Dt, leads to a time series of r and s.
Since outside of the Atmospheric Ray Tracing framework,           2.4 Adaptive ray zooming
we are mainly interested in the direction of propagation,
the wavefront normal n = |s| is stored instead of the slow-           As explained before, for the purpose of auralization, it is
ness vector. This direction is required, e.g. when applying       desirable to find the eigenrays connecting a source (e.g. an
directivities for the source or doing 3D sound reproduction       aircraft) with a receiver. Using the assumption of a strati-
at the receiver.                                                  fied atmosphere and a flat ground, there are typically two
    It should be noted that certain analytic wind and             eigenrays in a flyover scenario: one for the direct sound
temperature profiles permit analytic solutions for the ray         and a second one for the ground reflection.5 The aircraft
equations (Eq. (3.79) in [7]). This is a very important refer-    is located far above the receiver in a huge distance and
ence for benchmarking ray tracing results. However, using         the emission directions of both eigenrays have a significant
such an analytic solution for a general sound propagation         vertical component. Due to this distance, a high angular
tool is inflexible, since for each combination of these profiles,   resolution for the emission angle of the rays is required to
a separate solution has to be implemented. More impor-            find these eigenrays within a certain accuracy. Using a
tantly, this approach does not work when using arbitrary          brute force approach by emitting rays with a certain angu-
profiles, e.g. from measurements.                                  lar resolution, leads to a huge overhead of rays which are
                                                                  irrelevant for the auralization. To reduce this mismatch,
                                                                  Arntzen et al. [10] introduced an approach iteratively
2.3 Ground reflection                                              increasing the angular resolution by “zooming in on the
                                                                  closest ray and relaunching a new cluster of rays in a new
    When simulating sound propagation in the context of
                                                                  direction around the last closest ray”. Unfortunately, no
aircraft noise, the ground is often modeled as a horizontal
                                                                  further details on the implementation were given.
plane [3, 5, 7, 22]. Although this neglects the topography
                                                                      Based on this idea, a method called adaptive ray
of the ground which is known to have a significant influence
                                                                  zooming is presented here. A rough overview of this method
on sound propagation [14], it allows an efficient implemen-
                                                                  has already been introduced in [23]. However, it is presented
tation of the ground reflection. It is especially reasonable
                                                                  here in more detail. It should be noted that in contrast to
when the source is located relatively far above the ground,
                                                                  Arntzen et al., who use the effective sound speed approxi-
e.g. aircraft. Additionally, this model is compatible with the
                                                                  mation, the presented approach considers the effect of
assumption of a stratified medium, since using non-flat ter-
                                                                  advection. Furthermore, the code of ART framework is
rain would be contradictory to horizontal layering of the
                                                                  open source and a ready- to-use binary is provided.
atmosphere.
    In the ART framework, the ground is modeled using the
xy-plane (z = 0). Using this model together with a stratified      General approach
medium, specular reflections can be implicitly carried out             To give an introduction into the adaptive ray zooming
by tracing rays through the ground [7]. For this purpose,         method, an example of a two-dimensional scene is given in
all atmospheric parameters are evaluated using the absolute       Figure 1. In an initial step, rays are emitted using a low
altitude |z|. Since rays below the surface behave like            angular resolution (gray rays). Then, the ray of minimum
mirrored versions of rays which were actually reflected,           distance to the receiver is determined (red ray). During
the sign dzd sz has to be flipped for z < 0. This is simply done   the actual ray zooming, additional rays (orange) are
by multiplying the well-known signum function to the              launched between this ray and its direct neighbors (high-
right-hand side of Equation (5):                                  lighted area). In this way, the angular resolution is doubled
                                                                but only in a particular direction. The process of finding the
            d                   X d           d
               sz ¼ signðzÞ         c  s?  v ? :        ð7Þ   ray of minimum distance and ray zooming is repeated until
           dt                   c dz          dz
                                                                  the determined ray penetrates a receiver sphere as shown in
                                                                  Figure 2.
Although not required for the ray tracing itself, a reflection
is detected by observing the sign of z: a sign change between
two consecutive time steps indicates a reflection. Then, the       5
                                                                    Under certain conditions, the number of eigenrays might vary
position of the reflection and the corresponding wavefront         as being discussed later in the limitations section.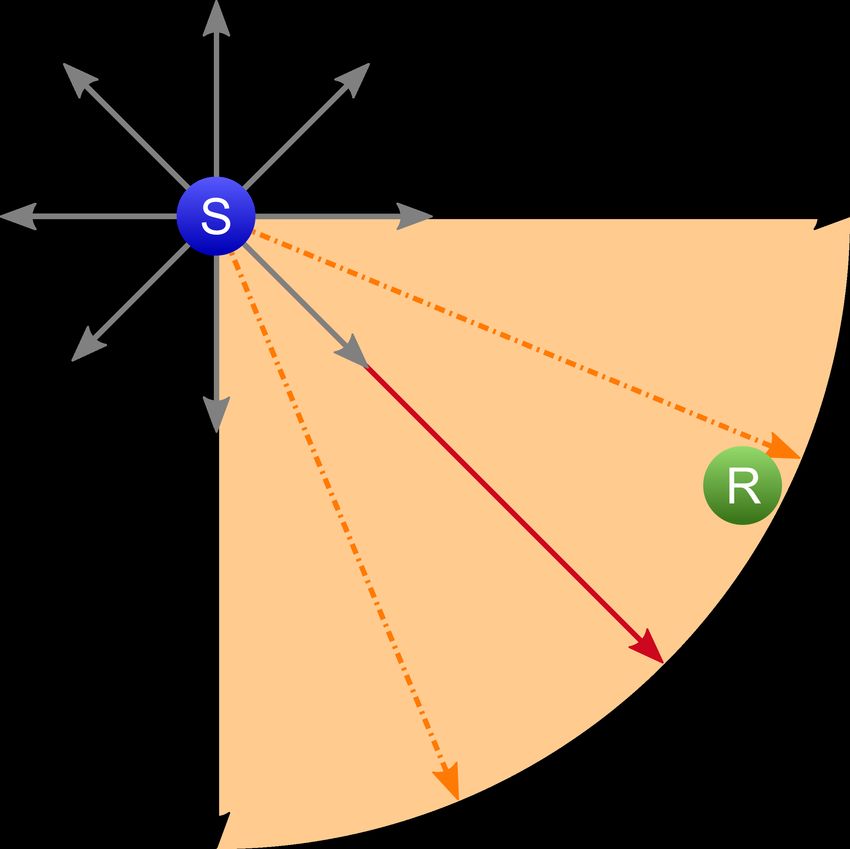
P. Schäfer and M. Vorländer: Acta Acustica 2021, 5, 26                                             5

Figure 1. 2D example of the adaptive ray zooming approach.
Initial rays are indicated in gray. The ray closest to the receiver
is marked in red. Its neighbors, which determine the limits for       Figure 3. Wavefront formed by rays considered during one
the next ray zooming iteration, are highlighted in black.             iteration of the adaptive ray zooming approach as well as
Additional rays are launched in between (orange) to double            additionally launched rays.
the resolution in a particular direction.

                                                                      distance increases.6 In a post-processing step, the time
                                                                      and position of minimum distance is refined by linear inter-
                                                                      polation between the stored time step and its neighbors.
                                                                      This is particularly important during the initial ray tracing
                                                                      where the temporal resolution is rather low. Finally, the ray
                                                                      of minimum distance is found comparing the ray-receiver
                                                                      distance between all considered rays.
                                                                          During the actual ray zooming, only the ray of minimum
                                                                      distance and its neighbors are considered. In the three-
                                                                      dimensional case, these are typically nine rays as shown in
                                                                      Figure 3. Following, 16 additional rays are launched to
                                                                      double the resolution in both, elevation and azimuth. Note,
                                                                      that in the first ray zooming iteration, also the 9 original
                                                                      rays have to be relaunched to obtain the desired temporal
                                                                      resolution which was reduced during the initial ray tracing.
                                                                          A special case occurs, if the ray of minimum distance was
                                                                      emitted towards one of the poles. Then, the number of
                                                                      neighbors actually depends on the azimuth resolution D/,

Figure 2. Block diagram of the adaptive ray zooming approach.                                              360
                                                                                           N neigh;pole ¼        ;              ð9Þ
                                                                                                            /

                                                                      instead of being fixed at 8. The number of additionally
Implementation in 3D                                                  launched rays is actually three times as high. Conse-
                                                                      quently, not only is the number of rays to be calculated
    During the initial ray tracing the angular resolution
                                                                      higher than usual, it also increases with angular resolu-
is set to Dh = 30° in elevation and D/ = 36° in azimuth
                                                                      tion. This can lead to a drastic increase of emitted rays
leading to 62 rays in total. For this step only, the time
                                                                      when the source is more or less directly above the receiver.
step size Dt for solving the ODEs is increased by a factor
                                                                      To avoid this effect, the azimuth resolution is fixed if the
of 10 reducing the computational effort.
                                                                      zooming direction is one of the poles. In this way, a drastic
    While tracing a ray, its distance to the receiver is
                                                                      increase of computation time is prevented.
tracked during each time step, while storing the ray param-
eters corresponding to the minimum distance. To further                6
                                                                         This is the default setting, however, it can be disabled so that
improve the efficiency, tracing is stopped as soon as the              each ray is traced for a user-defined propagation time.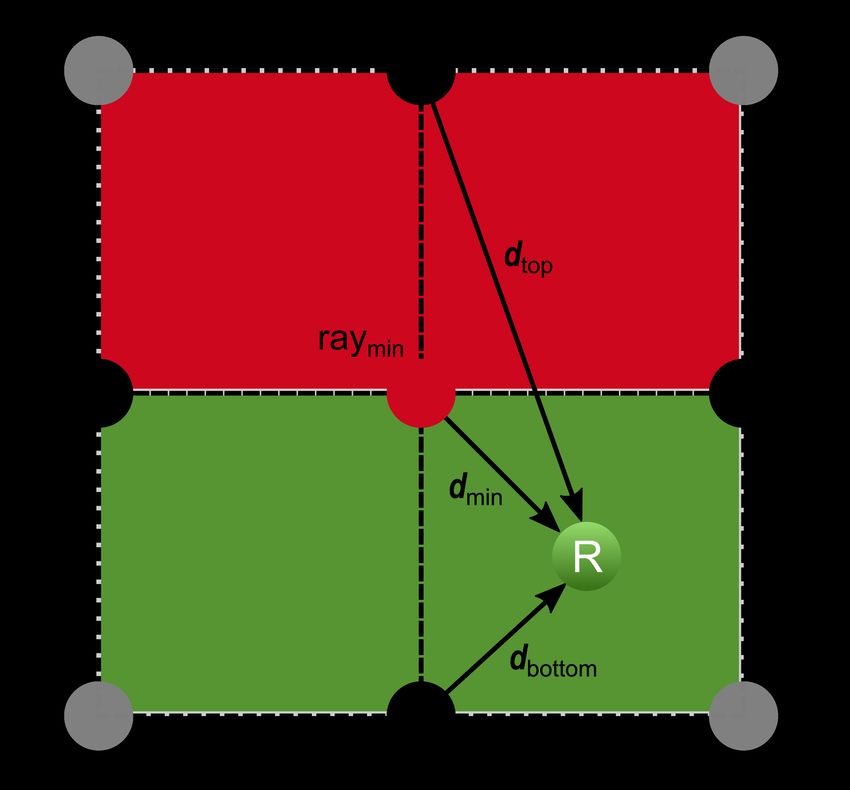
6                                P. Schäfer and M. Vorländer: Acta Acustica 2021, 5, 26

                                                                 Under certain conditions, rays which are launched at a flat
                                                                 elevation angle can be refracted upwards and downwards.
                                                                 Then, in a stratified medium, rays are trapped within a duct
                                                                 extending between a lower and upper altitude limit. In the
                                                                 atmosphere, this can be caused e.g. by temperature inversion
                                                                 [22]. Since rays within this duct cross each other although not
                                                                 being reflected, the adaptive ray zooming method could make
                                                                 a false decision and therefore fail to find the direct eigenray.
                                                                 This could happen, if source and receiver reside inside a duct
Figure 4. Virtual receiver position considered to find eigenray   or are at least close to it. However, this effect has not been
of ground reflection.                                             tested yet.
                                                                     Finally, for rays arriving at grazing incidence, the model
    In order to find an additional eigenray for the ground        for the ground reflection can lead to erroneous results, since
reflection, a second, virtual receiver position is considered.    the assumption of a specular reflection is not valid [24].
For this purpose, the receiver position is simply mirrored           All of the problematic cases described above mainly
at the ground by flipping the sign of its z-component as          occur when rays are launched at angles close to horizontal.
shown in Figure 4. The approach is analogous to the well-        For the application of aircraft noise auralization, typically
known image source method. Thus, the initial ray tracing         flyovers are considered. In such a scenario, the aircraft is
returns two rays of minimum distance, one for the direct         usually at higher altitude, while the receiver resides close
sound path and the other for the ground reflection. Then,         to the ground which is contradictory to the requirement
the adaptive ray zooming is carried out for each of these        above. Thus, it is reasonable to neglect these cases when
rays using the respective receiver position.                     searching for eigenrays. Although it might be possible to
    As discussed earlier, a receiver sphere is used as accu-     extend the adaptive ray zooming method to cover these
racy criterion. As soon as the distance between a ray and        cases, this would probably involve special model extensions
the receiver is below the user-defined receiver radius, the       with increased computation times. As this again disagrees
ray is considered as eigenray and the algorithm stops. How-      with the goal of using the ART framework for real-time
ever, there are additional abort criteria to avoid infinite       auralization of flyover cases, we postpone this to work in
loops: a maximum number of iterations and a minimum              future.
angular resolution. These are necessary, since there are
some limiting cases where the presented method is unable         Advanced ray zooming
to find eigenrays with the desired accuracy.
                                                                     As shown in Figure 3, the nine rays considered for the
Limitations                                                      ray zooming span a wavefront which can be divided into
                                                                 four quadrants. Knowing in which part receiver is located,
    A typical limitation of ray tracing in an inhomoge-          the number of rays can be further reduced. In best case,
neous medium is dealing with the so-called shadow zone           only four rays have to be considered for the ray zooming
(see Fig. 1.4 in [7]). This phenomenon happens when the          and only five new rays have to be launched. In order to limit
source is located close to the ground, where the gradient        the launch elevation and azimuth, two independent checks
of the wind vector is usually strong and therefore dominates     are carried out respectively.
the refraction. If the receiver resides upwind and the               Figure 6 indicates how a decision for the elevation can
elevation looking from the source to the receiver is almost      be done. For this purpose the vectors from the ray of
horizontal, the upward refraction can prevent rays from          minimum distance and the rays “above” and “below” to
entering the shadow zone. Although the ray tracing solu-         the receiver position, dmin, dtop and dbottom, are considered.
tion suggests that the source is not audible for the receiver,   Since the receiver resides in the lower half of the wavefront,
sound energy can still enter the shadow zone due to turbu-       the vectors dmin and dtop point in a similar direction while
lent scattering and diffraction. Thus, additional measures       dmin and dbottom point in a rather opposite direction. Com-
when auralizing scenes where a receiver resides within a         paring the scalar products of the respective normalized
shadow zone would be required. For example, Arntzen              vectors,
et al. propose an empirical correction method for the trans-
                                                                                               d min d top
mission loss inside such a zone [10].                                                vtop ¼                    ;          ð10Þ
    Under the same conditions, but if a receiver resides                                      jd min j jd top j
downwind, the downward refraction caused by the wind
                                                                 and,
gradient can lead to turning points of the rays. In other
words, rays which were already reflected are bent back                                          d min d bottom
                                                                                  vbottom ¼                       ;       ð11Þ
towards the ground and reflected again [7]. Then, also                                         jd min j jd bottom j
eigenrays of higher reflection order may exist which
currently cannot be found using adaptive ray zooming.            the first is larger than the second. In an extreme case
    Another special case of sound propagation in in-             where all vectors are collinear, vtop and vbottom become
homogeneous media is ducting (also called channeling) [7, 9].    1 and 1 respectively. Thus, the launch elevation is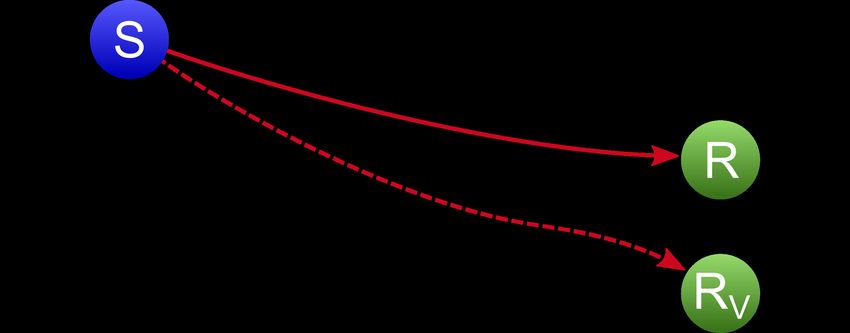
P. Schäfer and M. Vorländer: Acta Acustica 2021, 5, 26                                                   7

Figure 5. Block diagram of the overall approach to find
eigenrays of direct path and ground reflection.

                                                                 Figure 6. Vectors used to check whether receiver resides
limited to the rays corresponding to the smaller scalar          “above” or “below” the current ray of minimum distance. An
product. An analogous approach is used to make a deci-           analogous procedure can be done to check whether it is located
sion for the azimuth angle. For this purpose, the rays “left”    “left” or “right”.
and “right” of the minimum-distance ray are considered.
    It should be noted that this approach does not work if
zooming towards a pole, since the wavefront cannot be split          Finally, another important parameter is the spreading
into quadrants. Also note, that a single false decision in the   loss. Due to the presence of refraction, the well-known dis-
adaptive ray zooming approach causes the algorithm to fail       tance law for point sources does not hold here, since the
finding an eigenray. Further reducing the considered              spherical waveform is distorted. Instead, the Blokhintzev
directions using the advanced method, could lead to such         invariant [28] is used which gives a formulation for the
a wrong decision and therefore decrease the accuracy. Thus,      energy conservation along a ray path. From this, a formula
the results from both methods are compared later in              for the sound pressure p can be derived (Eq. (3.62) in [7]).
Section 3.2.                                                     Its primary statement is that the sound pressure p along
                                                                 a ray is proportional to the square root of a cross-sectional
2.5 Auralization parameters                                      area of a ray tube A. Assuming that the density p is con-
                                                                 stant along a ray, the following proportionality is derived:
    When auralizing sound propagation through the atmo-                                        c
sphere, multiple acoustic parameters have to be derived                p2                 pffiffiffiffiffiffiffiffiffiffiffiffiffiffiffiffiffiffiffiffiffiffiffiffiffiffiffiffiffiffiffiffiffiffiffiffiffiffiffiffiffi : ð12Þ
                                                                             Að1 þ n  v=cÞ 1 þ 2n  v=c þ v2 =c2
from the eigenrays. Although the presented paper focuses
on the simulation of sound paths, a brief overview is given      Now, the spreading loss factor aspread corresponds to the
in this section. To be able to consider sound source directiv-   proportion of the sound pressure at the receiver preceiver to
ities and to do 3D sound reproduction, the exit angle at the     the reference sound pressure pref 1 m away from the source:
source and the incident angle at the receiver are required.                               rffiffiffiffiffiffiffiffiffiffiffiffiffi rffiffiffiffiffiffiffiffiffiffiffiffiffiffi
Both parameters are implicitly given when solving the ray                                  preceiver         Aref
                                                                                aspread ¼                               : ð13Þ
equations, since the wavefront normals at the source and                                      pref        Areceiver
receiver are known. When dealing with moving sources
and receivers, the Doppler effect should be considered           Here, it can be seen that it is anti-proportional to the
[25]. This effect can be modeled using a variable delay-line     square root of the cross-section area at the receiver Areceiver.
(VDL) which takes the propagation delay as input in order        In the presented framework, instead of using a ray tube, this
to virtually squeeze or stretch the acoustic signal along the    area is calculated based on a set of adjacent rays as used
time-axis [25]. Also this parameter is implicitly given, since   during the adaptive ray zooming method (see Fig. 3). While
the ray equations are solved using a time integration.           the area at the receiver is calculated using an approxima-
    While propagating through the atmosphere, sound is           tion of triangles, the reference area is calculated using a
attenuated by the medium. This effect is modeled using           spherical approximation. Since the area at the receiver
the frequency-dependent attenuation coefficient of ISO            depends on the angular resolution of the rays, the user
9613-1 [26]. The overall attenuation is acquired by integrat-    can define a maximum resolution used for its calculation.
ing this parameter along the ray path using left Riemann         If this resolution is not yet reached when the eigenray is
sums. Another frequency-dependent effect to be considered        found, an additional ray tracing step is carried out using
is amplitude and phase fluctuations caused by turbulent           the specified resolution. During our tests, a resolution of
scattering [15, 27].                                             D/ = Dh = 0.01° showed reasonable results.
8 P. Schäfer and M. Vorländer: Acta Acustica 2021, 5, 26
3 Results Table 1. Settings for atmospheric profiles used throughout this
paper.
3.1 Validation of ray tracing model
Temperature
To validate the sound paths calculated by the presented
Profile ISA
ray tracing model, it is compared to the Outdoor Sound
Wind
Propagation Calculator tool by Wilson [29]. This tool uses
ray equations as stated in [7] which are equivalent to the Profile Logarithmic
v 0.6 m/s
equations used here. Since the type of refraction strongly
z0 0.1 m
depends on the wind direction, three different settings are
investigated: down wind, upwind and side wind. All other
parameters for the atmosphere are shown in Table 1.
A scenario with a source at 200 m altitude is chosen. For of the source position is always zero. The receiver is located
each wind direction, multiple rays are emitted in the positive at (6500, 0, 1.8) m. The scenario corresponds to the I.C.A.O.
x-direction using launch elevation angles between 90° and standard for aircraft flyover measurements [31]. For the
+90° and a 10° step size. The ray equations are solved using atmosphere, the same temperature and wind velocity pro-
the Runge–Kutta method and a time step size of 0.1 s. Each files as in the previous section are used (see Tab. 1). Now,
ray is traced for 10 s. the wind direction is chosen to v dir ¼ vnv ¼ ð1; 0; 0Þ, so
The same settings as for the ART framework are that the aircraft takes-off in upwind direction which is a typ-
applied to the framework by Wilson. While for the ART ical scenario [32]. The settings used for the ODE solver and
framework, the weather profiles are evaluated using the the adaptive ray zooming method are listed in Table 2. In
analytical formulas during the ray tracing process, order to investigate the influence of the advanced ray zoom-
Wilson uses discrete vectors for speed of sound and x- and ing compared to the basic method, all simulations are carried
y-component of the wind vector respectively. Thus, the out with and without this option.
weather profiles are evaluated using an altitude vector of In the context of auralization two things are of interest:
1 m resolution and fed to Wilson’s framework. the accuracy of the eigenrays and the run-time of the algo-
The resulting rays are shown in Figure 7. Generally, the rithm. If the accuracy of the eigenrays is too low, the
rays are refracted as expected: downward reflection in derived acoustic parameters used for the auralization do
downwind direction, upward refraction in upwind direction. not properly represent the sound propagation through the
For perpendicular wind, the effect of advection causes the atmosphere. More importantly, a high inaccuracy between
rays to drift in positive y-direction (see Fig. 7d). Due to two consecutive time frames can lead to audible artifacts
the inhomogeneity of the wind velocity, the xy-plane projec- during the auralization process. On the other hand, it is
tions of some rays result in curved paths as mentioned in desired to find the eigenrays with low latency. A low run-
[7]. The ART results almost coincide with the rays of the time allows a fast preparation of offline auralization where
Outdoor Sound Propagation Calculator. Nevertheless, the eigenrays are calculated beforehand. If the algorithm
there is a small difference in the paths. The maximum is fast enough, it might be possible to auralize aircraft noise
deviation found was 11 m which corresponds to just based on ray tracing in real-time.
0.32% of the ray’s path length (approx. 3.4 km). Assuming With respect to accuracy, the distance between the
a spherical spreading loss, this again corresponds to a neg- eigenrays and the receiver position, called ray-receiver
ligible deviation of just 0.03 dB. Generally, the deviation distance in the following, is calculated. For the runtime
occurs when a ray gets close to the ground. This is probably evaluation, the adaptive ray zooming method is carried
caused by the different handling of weather profiles. For the out 100 times for each source position. For this purpose,
logarithmic wind profile, the wind gradient is particular a typical work station computer with an IntelÒ Core™
strong close to the ground (in the vicinity of z0). Here, a i7-7700 CPU (3.6 GHz), 32 GB RAM and Windows 10
different sampling of the profile can easily lead to the (64 bit) operating system is used. Although the ART
mentioned deviations. Concluding, the results suggest, that framework allows calculation of multiple rays in parallel,
the ART framework solves the ray equations with accept- all calculations are done sequentially. If the algorithm was
able accuracy. to be used during a real-time auralization, it would run in
a separate thread while the main thread would handle the
3.2 Performance of adaptive ray zooming audio processing. Thus, the run-time of a parallelized
approach is not representative for real-time auralization.
Knowing that the ART framework traces rays with In addition to the ray-receiver distance and the runtime,
appropriate accuracy, the performance of the adaptive ray also visualizations of the eigenrays for three different source
zooming method for finding eigenrays can be evaluated. positions are shown in Figure 8. Note, that an animation of
For this purpose, the algorithm is executed to find eigenrays the full flyover is provided here.7 It can be seen that during
between a fixed receiver position and a source moving along the first 60–70 s, the desired accuracy of 1 m cannot be
an aircraft take-off trajectory. The trajectory is generated reached. Here, due to strong upwind refraction, the receiver
using the software MICADO [30] with the origin being the resides within the shadow zone (see Fig. 8b). While the
initial aircraft position. The aircraft then moves in positive
7
x-direction while gaining altitude. Thus, the y-component https://youtu.be/AHOG6LCeZp8P. Schäfer and M. Vorländer: Acta Acustica 2021, 5, 26 9
(a) (b)
(c) (d)
Figure 7. Comparison of ray propagation using the ART model (solid lines) and the model by Wilson [29] (dashed lines) for three
different wind directions. Note that the differences between solid and respective dashed lines are so small that they are not visible. (a)
Downwind (vdir = 1, 0, 0]). (b) Upwind (vdir = 1, 0, 0]). (c) Sidewind (vdir = 0, 1, 0]), side view. (d) Sidewind (vdir = 0, 1, 0]), bird’s-
eye view.
Table 2. Simulation settings for ART framework used through- ray-receiver distance. Once the receiver leaves the shadow
out this paper. zone, both approaches have the same accuracy.
Also the run-time of the algorithm is influenced by the
ODE solver
shadow zone as shown in Figure 8f. Since the algorithm fails
Method Runge–Kutta to find eigenrays with the defined accuracy, the maximum
Integration step size 0.1 s number of iterations for the ray zooming method is used.
Ray zooming Hence, the trend of the runtime is much smoother than
Receiver radius 1m
for the later points on the trajectory where the number of
Angle for spreading loss 0.01° required iterations fluctuates. The influence of the shadow
Maximum number of iterations 30 zone is particularly strong, while the source is still on the
Minimum ray resolution 1° ground. Here, the upward refraction caused by the wind
is most distinctive. All rays leaving the windless zone are
refracted farther away from the receiver. Thus, they have
source is on the ground, the rays can still travel through the to travel much farther until they reach the point of closest
windless channel below the surface roughness z0 (see distance. This leads to an increased run-time, since the
Fig. 8a). Once the aircraft takes off, the distance between effort to compute a ray is directly dependent on the rays’
the eigenrays and the receiver increases abruptly. As it propagation time. Once the aircraft takes off (after approx.
gains altitude, the distance decreases over time until the 22 s), the average path lengths of the considered rays drop
receiver leaves the shadow zone again (see Fig. 8e). While significantly and with it the run-time, especially for the
this transition is rather smooth for the basic method, there basic method.
are discontinuities for the advanced approach. Here, Regarding the general trend, two things can be observed.
using the advanced method can lead to a wrong decision First, the run-time of the adaptive ray zooming method
in an earlier iteration leading to a strong increase in the scales with the distance between source and receiver. Again,10 P. Schäfer and M. Vorländer: Acta Acustica 2021, 5, 26
(a) (b)
(c) (d)
(e) (f)
Figure 8. Performance of adaptive ray zooming approach during aircraft flyover. (a) Eigenray results while aircraft is grounded.
(b) Eigenray results during take-off phase. (c) Eigenray results while aircraft is above receiver. (d) Eigenray results while
aircraft resides beyond receiver. (e) Distance between eigenrays and receiver using basic and advanced ray zooming method, and
(f) C++ run-times of adaptive ray zooming method using the basic and the advanced approach.
this is due to the dependency of a ray’s computation time on directly above the receiver. Then, the zooming direction is
its path length. Secondly, there is a considerable speed-up toward the nadir of the aircraft. This increases the number
using the advanced ray zooming method. For the basic of emitted rays and therefore leads to an increase in compu-
method, the runtime ranges from 8 ms when the aircraft is tation time. For the same reason, the advanced ray zooming
close to the receiver to over 100 ms at when it is at the method does not give a benefit here. Nevertheless, the
end of the trajectory. The corresponding source-receiver advanced approach clearly outperforms the basic method
distances are 1 km and 13.5 km approximately. For the in terms of run-time.
advanced method, the respective run-times are 5 ms and When auralizing based on these eigenray results, arti-
38 ms which corresponds to speed-ups of about 1.6 and facts will occur due to the abrupt changes of ray-receiver
2.8. An exception can be seen when the aircraft is nearly distance while the receiver resides within the shadow zone.P. Schäfer and M. Vorländer: Acta Acustica 2021, 5, 26 11
These artifacts will be more prominent using the advanced
ray zooming method, as the discontinuities are more dis-
tinctive here. However, due to the general limitations of
ray tracing, neither the basic nor the advanced method
are able to properly reproduce the sound propagation while
the receiver resides within the shadow zone. Thus, it is not
advisable to use this approach in these cases. In a real
scenario, however, the path between a grounded aircraft
and the receiver are typically blocked by obstacles, such
as buildings. Thus, the considered hemi-free- field model
is not reasonable for more realistic cases anyway. In real-life
cases with airports, the shadow zone should not be a prob-
lem. The next challenge is to integrate aircraft noise models
and models of buildings and non-flat terrain. Furthermore,
during an actual auralization of a flyover scenario, the
aircraft positions closer to the receiver are of most interest,
since the sound pressure level is maximal here. Limiting the
Figure 9. Mean run-times of the adaptive ray zooming method
aircraft trajectory not only avoids the problem with the using the same aircraft trajectories as Arntzen (compare to
shadow zone but also leads to a decrease of the maximum Figure 8.10 in [22]). Solid lines show the results for the basic and
computation time for the eigenrays. For example, if only dashed lines for the advanced approach.
considering positions with a maximum distance of 4 km
to the receiver, the run-time stays below 52 ms for the basic
and 25 ms for the advanced approach. method, are significantly faster than the approach by
Arntzen. In addition to that, the CPU implementation
3.3 Run-time comparison to method by Arntzen has the advantage of working on computers without GPUs,
which is the case for many laptops.
In [22], Arntzen investigates the run-time of his method All in all, the results suggest that the presented frame-
to find eigenrays based on a sequential CPU and a parallel work outperforms the ray tracing approach by Arntzen in
GPU implementation. For this purpose, he uses three differ- terms of run-time. This is especially the case regarding
ent aircraft trajectories (see Fig. 8.9 in [22]). The same the sequential CPU implementation. However, Arntzen’s
trajectories are used in the present work, in order to com- method is able to deal with some cases not currently
pare the results. Since the receiver altitude is not specified, handled by the ART framework. For example, it is capable
the receiver position is chosen to (0, 0, 1.8) m here. Also the of finding more than two eigenrays in a downwind scenario.
weather conditions are not fully reproducible, especially Furthermore, it provides an empirical solution to estimate
since Arntzen uses the effective speed of sound. Thus, the the spreading loss for a receiver in the shadow zone.
parameters of Section 3.2 for weather and simulation Nevertheless, also this solution comes with a limitation as
settings (see Tabs. 1 and 2) are used here as well. it is formulated for a receiver directly on the ground and
Again, each eigenray search is carried out 100 times. In based on linear sound speed profiles.
Figure 9, the mean run-time is shown for the three trajecto-
ries using the basic and advanced ray zooming method, 3.4 Real-time performance and potential optimization
respectively. Also here the strong upward refraction caused
by the wind leads to the receiver residing within the shadow To estimate the real-time capability of the algorithm,
zone for negative x-positions. This is most prominent for the the run-time is compared to blockwise audio processing as
first trajectory, where the receiver leaves this zone only after done during real-time auralization. There are two ways of
the aircraft reaches x 1000 m. Here, this leads to a integrating the simulation into an auralization process. As
strong increase of the run-times for the advanced method. shown in Figure 10, the audio processing and the simulation
Now the results are compared to Figure 8.10 in [22]. can be handled sequentially or the simulation can be run in
Although Arntzen uses the effective sound speed approxi- a separate thread. In both cases, the auralization thread is
mation which simplifies the ray equations, the presented already considerably loaded by the actual audio processing,
framework is at least 10 times faster than his CPU imple- e.g. the interpolation of samples in the variable delay-line
mentation. Neglecting the influence of the shadow zone, (VDL) for the Doppler shift or the convolution with
the speed-up factor even is 20 for most source positions head-related transfer functions (HRTFs) for binaural repro-
along the trajectory using the advanced method. Consider- duction. Thus, for the sequential approach, the simulation
ing the different clock rates of the utilized CPUs (2.4 GHz run-time needs to be significantly lower than the time
vs. 3.6 GHz), the speedup is still significant. Compared to corresponding to the block length. Nevertheless, also when
Arntzen’s GPU-based parallelized approach, the ART using a separate thread for the simulation, there is a compu-
framework is at least as fast. For the advanced ray zooming tational overhead. First, the simulation requests have to be
method, the speed-up is still roughly double. When the properly scheduled. Second, after a simulation is finished,
aircraft nears the receiver, both, basic and advanced the results have to be extracted in the main thread.12 P. Schäfer and M. Vorländer: Acta Acustica 2021, 5, 26
the emission angles of direct and reflected path are very
similar for a receiver close to the ground which is typically
the case when auralizing aircraft noise. In a dynamic scenar-
io, the same holds for the emission angles of eigenrays
between consecutive time steps. This could be used to limit
the considered directions for the eigenray search and there-
fore reducing the number of calculated rays. A different but
complementary approach would be to interpolate between
the simulation results within the auralization framework
as suggested in [22]. For this purpose, the simulation has
to be carried out in a separate thread as the audio process-
(a)
ing. The results are stored in a buffer. In each processing
step, the data are then interpolated accordingly. This
approach allows higher update rates for the audio process-
ing than for the simulation. Thus, it could enable using even
smaller block sizes than 1024. Particularly for modeling of
the Doppler shift based on the propagation delay, this
approach might be advantageous. Depending on the scene,
the propagation delay can require higher update rates to
avoid artifacts caused by abrupt time-shifts in the variable
delay-line.
Note that the ART framework already has been success-
fully used to create offline auralizations of aircraft flyovers.
A video of a binaural scene is publicly available.8
4 Conclusion
(b) In this paper, an open source ART framework for fast
simulation of sound propagation in a stratified atmosphere
Figure 10. Simplified diagrams of integrating the Atmospheric
is introduced. This framework uses an efficient method,
Ray Tracing framework into an auralization process. (a) Sequen-
tial auralization approach. (b) Simulating in separate thread.
called adaptive ray zooming, for finding eigenrays connect-
ing a source and receiver. Although the algorithm is
designed for the purpose of aircraft noise auralization, it
Assuming a rather large audio block length of 1024 could be applied to other scenarios such as quick parametric
samples, this corresponds to 23 ms using a sampling rate simulation of local variations in day-to-day weather condi-
of 44.1 kHz. As discussed above, the eigenray search should tions in order to create monthly and yearly averages. The
be considerably faster than this block time. Even using the framework comes with a Matlab interface which allows an
advanced ray zooming method, however, the run-times easy setup of simulations and is available as a binary.
presented in Figures 8f and 9 are under this value only The method was tested using an aircraft take-off trajec-
for source positions close to the receiver. This has been tory for the source positions and a fixed receiver position
confirmed in a preliminary auralization attempt where both close to the ground. Although there are limitations to the
approaches, the sequential and parallel simulation, have ray zooming method, e.g. when the receiver resides within
been tested for real-time capability. Using the same setup the shadow zone, it works well for most source positions,
as for the results in Figure 8, including test system, aircraft especially those close to the receiver, which are most rele-
trajectory and receiver position, neither of the two vant for the evaluation of a flyover.
approaches allowed for auralization in real-time. However, A run-time evaluation underlined the efficiency of the
for the sequential approach, moving the receiver closer to adaptive ray zooming method. Comparison to a similar
the trajectory (position: [2000, 100, 1.8] m), a real-time method by Arntzen et al. indicated that it is even more
auralization worked at least temporarily when the aircraft efficient than this state of the art approach. Although the
was closest to the receiver. Although the corresponding present approach uses more complex ray equations incorpo-
time window was only a few seconds, this indicates that rating the effect of advection, the presented run-times are
the current run-time of the ray zooming method is close significantly lower for a sequential implementation.
to a threshold allowing for real-time auralization. The results also showed that the method is not yet fast
Thus, with further improvements of the system, a real- enough to enable real-time auralizations. In future work,
time auralization of aircraft noise based on ray tracing the process of finding eigenrays could be further accelerated
should be possible. For instance, the process of finding using additional assumptions with respect to emission
eigenrays could be further accelerated using additional
8
assumptions to achieve real-time capability. For example, https://youtu.be/Zn26naG_e24P. Schäfer and M. Vorländer: Acta Acustica 2021, 5, 26 13
angles of direct and reflected paths or between consecutive perception- based evaluation of synthetic flyovers. Science of
time frames in a dynamic scene. Furthermore, the simula- The Total Environment 692 (2019) 68–81.
tion results could be interpolated in the auralization frame- 4. C. Dreier, M. Vorländer: Psychoacoustic optimisation of
aircraft noise – challenges and limits, in INTER-NOISE
work. This would enable to use higher update rates for the and NOISE-CON Congress and Conference Proceedings,
audio processing than for the simulation. Using one or Vol. 261, Institute of Noise Control Engineering. 2020, 2379–
combining multiple of these approaches might lead to a 2386.
real-time capable system. 5. A. Sahai, F. Wefers, S. Pick, E. Stumpf, M. Vorländer, T.
A typical application for auralization of aircraft, is the Kuhlen: Interactive simulation of aircraft noise in aural and
psychoacoustic evaluation of the perceived noise using visual virtual environments. Applied Acoustics 101 (2016)
listening tests. For example, different aircraft designs can 24–38.
6. M. Vorländer: Auralization: Fundamentals of acoustics,
be compared by varying the source signal. Once a real-time modelling, simulation, algorithms and acoustic virtual real-
auralization is possible, test subjects would be able to quasi- ity. RWTH edition, 2nd ed. Springer International Publish-
instantly change source parameters or weather conditions ing, Cham, 2020.
freely within the respective physical limits. This again 7. V.E. Ostashev, D.K. Wilson: Acoustics in moving inhomo-
enables implementation of novel listening test designs. geneous media, 2nd edn. CRC Press, 2016.
Finally, due to its fast run-time, the ART framework 8. R. Kirby: Atmospheric sound propagation in a stratified
moving media: Application of the semi analytic finite element
enables simulation of a large number of scenarios which
method. The Journal of the Acoustical Society of America
can be used for statistical analysis. In this context, it would 148, 6 (2020) 3737–3750.
be interesting to investigate the influence of the weather 9. A.D. Pierce: Acoustics: An introduction to its physical
conditions on the actual auralization result. For this principles and applications. Acoustical Society of America,
purpose, measured data, e.g. from atmospheric soundings, Woodbury, NY, 1989.
could be used to provide a realistic variance of the weather 10. M. Arntzen, S.A. Rizzi, H.G. Visser, D.G. Simons:
parameters at a single location. Framework for simulating air craft flyover noise through
nonstandard atmospheres. Journal of Aircraft 51, 3 (2014)
956–966.
11. S.A. Rizzi, A.R. Aumann, L.V. Lopes, C.L. Burley: Auraliza-
Supplementary data tion of hybrid wing-body aircraft flyover noise from system
noise predictions. Journal of Aircraft 516 (2014) 1914–1926.
The supplementary material of this article is available 12. O. Reynolds: On the refraction of sound by the atmosphere.
at https://acta-acustica.edpsciences.org/10.1051/aacus/ Proceedings of the Royal Society of London 22 (1874)
2021018/olm. This paper comes with supplementary data 531–548.
which allow reproduction of the data-based plots shown 13. O. Reynolds: On the refraction of sound by the atmosphere.
Philosophical Transactions of the Royal Society of London
here. This data includes a binary of the ART framework 166 (1876) 315–324.
using the Matlab interface ARTMatlab. Additionally, a 14. J.E. Piercy, T.F.W. Embleton, L.C. Sutherland: Review of
copy of the utilized version of the ITA Toolbox [33] is pro- noise propagation in the atmosphere. The Journal of the
vided. Running the respective simulations and creating the Acoustical Society of America 61, 6 (1977) 1403–1418.
plots requires a working Matlab version. Here, all plots were 15. F. Rietdijk, J. Forssen, K. Heutschi: Generating sequences of
created using Matlab 2019b. Additionally, an animation is acoustic scintillations. Acta Acustica united with Acustica
provided to complement Figure 8. This animation shows 103, 2 (2017) 331–338.
16. International Organization for Standardization: ISO
the eigenrays for all considered aircraft positions along the 2533:1975, Standard Atmosphere, 1975.
trajectory. 17. R.O. Weber: Remarks on the definition and estimation of
friction velocity. Boundary-Layer Meteorology 93, 2 (1999)
197–209.
Acknowledgments 18. University of Wyoming, College of Engineering, Department
of Atmospheric Science. Atmospheric Soundings, 2021.
The authors would like to thank Vladimir Ostashev for http://weather.uwyo.edu/upperair/sounding.html.
the fruitful discussions about sound propagation and ray 19. M.A. Garces, R.A. Hansen, K.G. Lindquist: Traveltimes for
tracing in the atmosphere which helped to improve the infrasonic waves propagating in a stratified atmosphere.
content of this article substantially. Geophysical Journal International 135, 1 (1998) 255–263.
20. R.B. Lindsay: Mechanical Radiation. International Series in
Pure and Applied Physics, Mc-Graw Hill, 1960.
21. W.H. Press, B.P. Flannery, S.A. Teukolsky, W.T. Vetterling:
References Numerical Recipes in C: The art of scientific computing, 2nd
ed. Cambridge University Press, 1992.
1. World Health Organization (WHO): Environmental noise 22. M. Arntzen: Aircraft noise calculation and synthesis in a non-
guidelines for the European Region, 2018. standard atmosphere, PhD thesis. Delft University of Tech-
2. S.A. Rizzi, A. Christian: A psychoacoustic evaluation of noise nology, 2014.
signatures from advanced civil transport aircraft, in 22nd 23. J. Mecking, J. Stienen, P. Schafer, M. Vorländer: Efficient
AIAA/CEAS Aeroacoustics Conference, Lyon, France, simulation of sound paths in the atmosphere, in INTER-
American Institute of Aeronautics and Astronautics, 2016. NOISE and NOISE-CON Congress and Conference Proceed-
3. R. Pieren, L. Bertsch, D. Lauper, B. Schaffer: Improving ings, Vol. 255. Institute of Noise Control Engineering,
future low-noise aircraft technologies using experimental Hongkong, 2017, 3464–3469.You can also read


