The Research Monitor December Quarter 2017 - Shaw and Partners
←
→
Page content transcription
If your browser does not render page correctly, please read the page content below

The Research Monitor
December Quarter 2017

With the compliments of your adviser

 Content
 September Quarter 2017 Performance                            Page 3
 Meet the Research Team                                        Page 4
 Large Cap Model Portfolio                                     Page 6
 Hybrid Income Model Portfolio                                 Page 8
 Our Preferred Stocks 		                                       Page 10
     Audinate Group (AD8)
     Bank of Queensland (BOQ)
     Clydesdale Bank (CYB)
     Flight Centre Travel Group (FLT)
     Macquarie Group (MQG)
     Oil Search (OSH)
     OZ Minerals (OZL)
     Rio Tinto (RIO)
     Stockland (SGP)
     Woodside Petroleum (WPL)

 Shaw and Partners
 Shaw and Partners is one of Australia’s preeminent investment and wealth management firms.

 With a national presence and over $13 billion of assets under advice, Shaw and Partners offers the intimacy of a
 boutique investment firm with the resources and scale of a major financial group. We are privately owned and client
 focused, having helped our clients manage and grow their financial assets for more than 25 years. Our emphasis on
 integrity and stringent compliance standards has enabled us to achieve very high levels of client satisfaction, while
 unlocking opportunities of significant value.

 Backed by fresh thinking, robust research and some of the nation’s best investment and wealth experts, our business
 is well positioned to meet the needs of our clients. Shaw and Partners offers access to an extensive team of private
 client advisers, institutional sales and trading specialists, market leading research analysts and strategic corporate
 advisers. By working closely with our clients, we have forged long-term relationships. Whether you are a private
 investor, high net worth individual, charity, institution or corporate client, our focus is simple: listen to you then act
 according to your objectives.

 We welcome you to Shaw and Partners. Your partners in building and preserving wealth.

 2
September Quarter 2017
Performance
The Australian Share Market, as measured by the S&P/ASX 300 Index, fell by 0.6%
on a price basis but rose by 0.8% on an accumulation basis during the September
quarter, continuing a pattern of low returns.

Looking beneath the index level, however, there was                                   Cyclical stocks broadly outperformed defensive stocks as
much movement with the best performing sector –                                       investors sought to rotate their portfolios into companies
Capital Goods – outperforming the worst performing                                    expected to benefit from improving, synchronised world
sector – Telecommunications - by 28.2%. Although the                                  growth. Energy, Materials and capital Goods sectors
Capital Goods sector, led by Cimic Group (CIM) was the                                all performed well, whereas the more defensive Utilities
best percentage performer over the quarter, being up                                  and Insurance sectors performed poorly. A 9.1% fall in
9.9% on a price basis and 11.7% on an accumulation                                    CBA shares was offset by 3-6% rises in the other big
basis, it was the Materials Sector, led by BHP Billiton                               four banks to neutralise the Bank sector’s impact on the
(BHP) which moved the index the most with a $13bn                                     index.
increase in market value. The Telecommunications sector
– with a 18.8% fall in index heavy weight Telstra (TLS) took                          Global markets performed well in the September quarter,
$11.7bn of market value off the index. Another sector to                              even in spite of a 2.3% increase in the Australian dollar
perform poorly – after years of strong performance – was                              over the period. NASDAQ index was up 5.8% as
the Health Care Equipment and Services sector which fell                              technology stocks continued their recent strong gains,
8.8%. Ramsay Health Care (RHC) fell 15.4% and other                                   the broader S&P500 was up 4.0%, European stocks up
hospital related stocks fell heavily as a combination of                              4.3% and the World index was up 3.9%. Fixed income
private health insurance reform and concerns about new                                markets went backward as bond yields rose, with the
supply coming on stream kept investors wary.                                          Bloomberg AusBond Composite (0+Y) Index down 0.1%.

                                                                                                    Real Estate                                Food & Staples Retailing
                                                                                                      1.90%                                            3.90%
                                                                                                     116.75bn                                         81.97bn

                                 Banks                                                                            Pharmaceuticals, Biotech &                Insurance
                                 1.10%                                                                                 Life Sciences                         -5.90%
                                                                                Diversified Financials                    -3.40%                             58.15bn
                                425.51bn
                                                                                        0.40%                             63.45bn
                                                                                      81.52bn

                                                                                                                     Consumer Services         Commercial &
                                                                                                                                                Professional         Utilities
                                                                                                                          -1.90%                                     -5.80%
                                                                                                                         48.08bn                  Services
                                                                                                                                                   0.20%             32.83bn
                                                                                   Transportation
                                                                                      -0.90%                                                      35.60bn
                                                                                      68.08bn
                                                                                                                     Telecommunication
                                                                                                                          Services             Food Beverage       Software &
                                Materials                                                                                 -15.10%                & Tobacco          Services
                                 6.70%                                                                                    47.52bn                  4.30%             1.40%
                                260.83bn                                                                                                          27.23bn           24.72bn
                                                                                       Energy
                                                                                       7.00%                        Health Care Equipment
                                                                                                                          & Services                           Capital
                                                                                      67.77bn                                                   Retailing                 Media
                                                                                                                                                               Goods
                                                                                                                           -7.50%               -2.30%
                                                                                                                                                              11.70%
                                                                                                                                                                         -4.40%
                                                                                                                           45.15bn              14.55bn                  11.67bn
                                                                                                                                                              11.87bn

Heat map legend: Size of box: market cap of sector. Colour of box: Quarterly performance (green positive, red negative).
Source: Shaw and Partners
                                                                                                                                                                                   3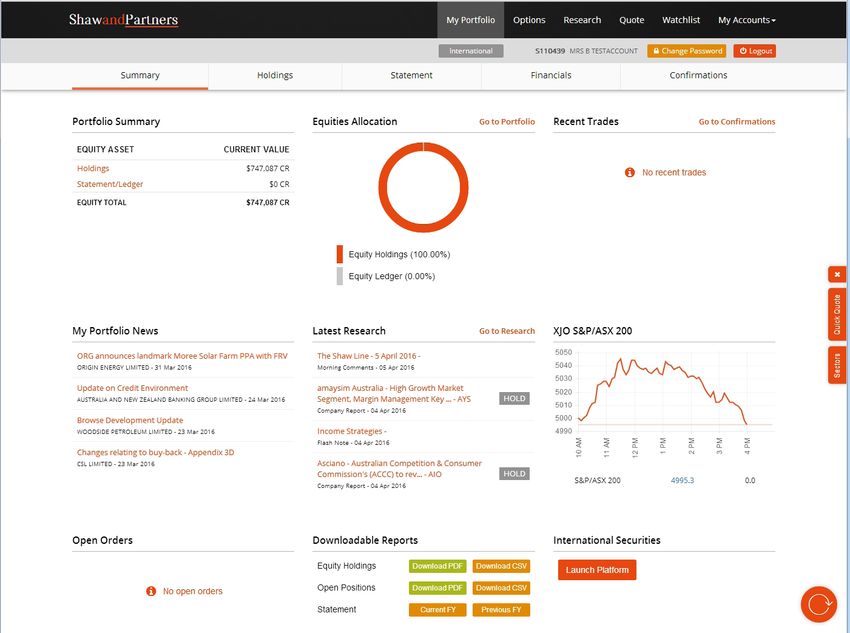
The Research Team

At Shaw and Partners, we don’t simply repackage publicly available information.
Our analysts visit key companies and spend time with management, competitors,
suppliers and customers of businesses to understand the company at a
grassroots level, from which they can generate unique insights and unearth
commercial opportunities that are otherwise missed by the broader market.

          Martin Crabb                                     Danny Younis
          Chief Investment Officer                         Senior Analyst, Technology, Developers &
                                                           Contractors, Retailers
          Martin joined Shaw and Partners in April 2011.
          Prior to joining Shaw and Partners, Martin       Danny joined Shaw and Partners in April
          was an Executive Director at Macquarie           2010 and covers the Industrials sector with
          Group where he worked for over 20 years          specific focus on Technology, Contractors,
          in roles spanning Institutional Stockbroking,    Mining Services and Retailers. Danny has
          Wealth Management, Research and Portfolio        had over 15 years of experience in financial
          Management. Martin holds a Bachelor of           markets. He commenced his career with CCZ
          Arts in Economics and Mathematics from the       Statton Equities and previously worked with
          University of Melbourne, with postgraduate       Aegis Equities, Westpac, Commonwealth
          studies in Applied Finance.                      Bank and StoneBridge Group where he was
                                                           Head of Research. Danny holds a Bachelor
                                                           of Science from the University of Sydney
                                                           and has completed FINSIA’s Graduate
                                                           Diploma of Applied Finance and Investment
                                                           (GDipAppFin).

          Darren Vincent                                   Peter Zuk
          Senior Analyst, Commercial Services, Life        Senior Analyst, Real Estate
          Sciences, Travel & Leisure
                                                           Peter joined Shaw and Partners in
          Darren joined Shaw and Partners in               October 2015 as a Senior Analyst. Peter
          September 2012 as a Small Company
                                                           has over 17 years of real estate industry
          specialist. Darren has worked in equity
                                                           experience that includes roles within
          markets for over 20 years, having previously
                                                           financial markets, direct industry and
          worked at Credit Suisse and also with BNP
          Paribas and ANZ Stockbroking. During his         advisory. Previously, Peter worked as an
          career Darren has covered a wide variety         equities analyst at Goldman Sachs where
          of small industrial companies and has been       he covered the Real Estate sector. Prior
          recognised by his clients for his work,          to this, he held roles at Goodman Group
          winning the 2010 East Coles Small Company        and KPMG where he focused on REITs,
          Analyst of the Year. Darren holds a Bachelor     developers and contractors. Peter has a
          of Economics from the Australian National        Masters of Commerce Degree from the
          University.                                      University of New South Wales and is
                                                           also a Chartered Accountant.

4
Peter O’Connor                                   David Spotswood
Senior Analyst, Metals and Mining                Senior Analyst, Financial Services,
                                                 Telecommunications
Peter joined Shaw and Partners in January
2015 as a Senior Analyst. Peter is an            David joined Shaw and Partners in February
experienced equities analyst specialising in     2012 as a Senior Analyst covering the
Metals and Mining sectors. Peter was most        Banks, Diversified Financials, Insurance,
recently Managing Director, Head of Asian        Media and Telecommunications companies.
Metals & Mining Team, Co-Head of Global          David has over 20 years’ experience and
team / Equities Research at Merrill Lynch/       previously worked as Research Officer and
Bank of America. Prior to this, Peter held       Economist with the Commonwealth Treasury
positions as Head of Australian Metals and       & Department of Finance, Senior Investment
Mining at Deutsche Bank, Head of Global          Manager with HSBC Asset Management,
Metals and Mining at Credit Suisse and           Investment Manager at Credit Suisse
Equities Research, Metals and Mining at          Asset Management, Australian Equities
Macquarie Bank. Peter also held operational      Manager with Warakirri Asset Management
roles with Rio Tinto and BHP Billiton for        and Institutional Research Adviser with
over 10 years. Peter has a Bachelor of           Select Equities. David holds a Bachelor
Engineering (Mining) from the University of      of Economics from Flinders University and
New South Wales (First Class Honours and         Master of Commerce with 1st Class Honours
the University Medal).                           from the University of Melbourne.

Stuart Baker                                     Matthew Johnston
Senior Analyst, Oil and Gas                      Analyst

Stuart joined Shaw and Partners in February      Matthew joined Shaw in August 2015 as
2017 and brings 38 years of experience in        an Associate Analyst in the Research team.
the oil industry and financial markets. Stuart   Prior to Shaw, Matthew spent over 4 years’ at
worked as a Petroleum Engineer for oil-field     State Street Australia Limited. Most recently,
service company Schlumberger throughout          he was part of the Investment Analytics team
South East Asia for several years, followed by   carrying out performance and attribution
28 years in stockbroking as a rated analyst      analysis for Asset managers across multiple
for Bankers Trust, Macquarie Equities and        asset classes. Matthew holds a Bachelor of
most recently, Morgan Stanley. Stuart holds      Commerce from the University of Sydney
a Bachelor of Engineering (Electrical) and       with majors in Finance and Economics.
MBA (Finance) from University of Melbourne
& Graduate School of Management, is
a Member of the Society of Petroleum
Engineers and Member of the Australian
Institute of Directors.

Annabel Riggs                                    Jonathon Higgins
Analyst                                          Analyst

Annabel joined Shaw in February 2015 as          Jonathon joined Shaw and Partners in
an Associate Research Analyst and assists        July 2017 as an Analyst in the Small-Cap
with the coverage of Banks, Insurance and        team. Jonathon previously worked as an
Telecommunication companies. Prior to            equities research analyst at Bell Potter
joining Shaw she worked as an Product            Securities for 2 years in both a research and
Analyst at Bendigo and Adelaide Bank,            research dealing role, covering industrial and
where she helped manage the consumer             technology focussed companies. Jonathon
lending portfolio. Annabel holds a Bachelor      holds a Bachelor of Science (Civil Systems)
of Finance and Bachelor of Commerce              from the University of Melbourne and a
(International Business) from the University     Master of Commerce (Finance) from RMIT
of Adelaide.                                     University.

                                                                                             5
Large Cap Model Portfolio
Our Australian Large Cap Model Portfolio                     We have long held an underweight to Australian Food
outperformed the benchmark S&P/ASX 100                       Retailing, but think this less relevant now. We added
Index last month, adding 60 basis points (0.6%)              Woolworths to our portfolio earlier in 2017 and now think
performance in what was an otherwise flat month.             the case to be underweight Wesfarmers (WES) is not so
Over the past quarter and year, our portfolio has            strong. We predict a low double digit return including
added 300 and 700 basis points in outperformance             dividends from the stock over the next twelve months.
respectively. We close our underweight position to           This takes us to “market weight” the supermarkets, with
food retailing and trim our gold position.                   a slight preference for WOW over WES.

Another solid month of relative returns. The Australian       Additions                    Reductions
share market seems stuck in the doldrums. A combination
                                                              WES             2.00         NCM          (2.00)
of weak economic activity, low wages growth and poor
consumer spending has made profit growth difficult to                         2.00                      (2.00)
come by. This, along with relatively full valuation has
resulted in share prices moving sideways in September.        Model Portfolio @ 29 September 2017
Our portfolio performed better than the index in part due
                                                              WBC     Westpac Banking Corporation         11.30%
to our large overweight to the banking sector – which
rose 2% above the index, but more importantly thanks          CBA     Commonwealth Bank of Aust            9.60%
to strong price performance from Lendlease (LLC) and          NAB     National Australia Bank              8.10%
Clydesdale Bank (CYB). During the month we have               BHP     BHP Billiton                         7.60%
trimmed LLC in favour of Stockland Group (SGP), as well
                                                              ANZ     ANZ Banking Group                    5.70%
as exiting QBE Insurance (QBE) in favour of adding to our
positions in Westpac Bank (WBC) and favoured Energy           MQG     Macquarie Group                      5.30%
stocks Oil Search (OSH) and Woodside (WPL).                   OSH     Oil Search                           4.60%

Stay long the big banks heading into reporting season.        RIO     Rio Tinto                            4.40%
We maintain a large overweight position to the Banking        CYB     Clydesdale Bank                      4.30%
sector, dominated by our 4% overweight position to
                                                              SUN     Suncorp Group                        3.50%
both CYB and Westpac Bank (WBC). Recent APRA
banking statistics show credit growth continues to            MGR     Mirvac Group                         3.40%
grow at 5%-6%, bad and doubtful debts remain well             BOQ     Bank of Queensland                   3.30%
contained, house price growth remains positive albeit
                                                              SGP     Stockland                            3.20%
slowing and net interest margins have recently expanded
following mortgage rate hikes for investors and interest      MFG     Magellan Financial Group             3.10%
only borrowers. All of these factors are pointing toward a    FLT     Flight Centre Travel Group           3.00%
robust profit reporting season which kicks off with Bank
                                                              WOW     Woolworths                           3.00%
of Queensland on October 12th.
                                                              LLC     Lendlease Group                      2.70%
Keep the finger on the resources trigger but don’t pull       ILU     Iluka Resources                      2.20%
yet. We remain positive on world growth and consider
the hedge against inflation to be the most important          CGF     Challenger                           2.10%
one for portfolio managers to consider. Last month we         WPL     Woodside Petroleum                   2.00%
pulled back some of our resources overweight as we felt       OZL     OZ Minerals                          2.00%
“overbought” and were heading into a seasonally weak
                                                              WES     Wesfarmers                           2.00%
period for Chinese demand as steel mills shut down
for pollution control. We maintain a 1% overweight to         VCX     Vicinity Centres                     2.00%
resources after cutting back our position in gold as it       NCM     Newcrest Mining                      1.60%
seems a diplomatic solution is the likely outcome to the
                                                                      Total                               100.0%
North Korean situation.

6
Recommendation                                                                                                           Portfolio Attribution
After peaking on May 1st, the S&P/ASX 100 index has                                                                      The strongest contributors to relative and absolute
fallen 2.2% in price terms. Our model portfolio has risen                                                                performance last month came from two relatively long
1.25% over the same period, highlighting the importance                                                                  held positions in Clydesdale Yorkshire Banking Group
of stock selection and active management in a low                                                                        PLC (CYB) and Lendlease Group (LLC). We believe that
return environment. With an expected return of 9.5%                                                                      there is further upside to CYB and maintain our position
including dividend yield of 4.5%, we expect investors will                                                               there, but feel that LLC has run hard and took profits in
continue to have to work hard to achieve results typically                                                               the stock during the month. We still like LLC longer term,
associated with equity investment. We remain neutral to                                                                  but can see it having a breather before moving higher.
equities in a balanced portfolio setting.
                                                                                                                         We cut our position in QBE Insurance (QBE) before it
To obtain the latest Shaw Model Portfolio report, please                                                                 could do any further damage to the portfolio and see
contact your Shaw adviser.                                                                                               the potential for a rebasing on profit expectations on
                                                                                                                         an incoming CEO to be a likely event and one worth
                                                                                                                         avoiding if possible. We missed the strong bounce in
                                                                                                                         South32 (S32) making it the largest detractor to relative
                                                                                                                         performance.

Portfolio Performance (Accumulation Basis)

                                                         Portfolio                          Fifty Leaders                              ASX/S&P300 Accumulation

 1.80

 1.70

 1.60

 1.50

 1.40

 1.30

 1.20

 1.10

 1.00

 0.90

 0.80
                 Oct 11

                                                     Oct 12

                                                                                         Oct 13

                                                                                                                             Oct 14

                                                                                                                                                                 Oct 15

                                                                                                                                                                                                     Oct 16
        Jul 11

                                            Jul 12

                                                                                Jul 13

                                                                                                                    Jul 14

                                                                                                                                                        Jul 15

                                                                                                                                                                                            Jul 16

                                                                                                                                                                                                                                Jul 17
                                   Apr 12

                                                                       Apr 13

                                                                                                           Apr 14

                                                                                                                                               Apr 15

                                                                                                                                                                                   Apr 16

                                                                                                                                                                                                                       Apr 17
                          Jan 12

                                                              Jan 13

                                                                                                  Jan 14

                                                                                                                                      Jan 15

                                                                                                                                                                          Jan 16

                                                                                                                                                                                                              Jan 17

         Source: Shaw and Partners

                                                                                                                                                                                                                                         7
Hybrid Income Model Portfolio
The Income Strategies team consists of specialised strategists dedicated to
interpreting the debt and preference share markets. With a focus on structuring
and managing listed and hybrid portfolios and blending with equities, the
team aims to maximise income, whilst simultaneously minimising the risk of
drawdown/permanent loss of capital, providing clients with thoughtful analysis
and investment opportunities.

                                                            Investment Strategy
                                                            The Shaw ASX Hybrid Income Portfolio aims to provide
                                                            investors with exposure to a highly transparent portfolio
                                                            of ASX listed debt and preference securities that offer
                  Cameron Duncan                            diversification benefits to both Australian Equities and
                  Co-Head, Income Strategies                cash/term deposit investor’s allocations.

                                                            There is a growing universe of listed assets spanning
Cameron has 30 years experience across financial            Senior Debt, Subordinated Debt, Convertible Preference
markets, including over 16 years at Macquarie Group in      Shares, Convertible Notes and Income Securities (debt
                                                            and equity). While these “Hybrid” securities each have
listed debt and hybrid advisory, syndication, proprietary
                                                            their own characteristics, research and subsequent
trading and portfolio risk management. Cameron has
                                                            implementation and monitoring allows for strategies to
a Bachelor of Economics degree from the University of
                                                            extract risk adjusted return from this sector that aims to
Sydney and has completed the Diploma of Financial           enhance a core portfolio of Australian Equities and cash.
Planning & RG146.

                                                            Investment Objectives
                                                            The objective of the Shaw Hybrid Income Portfolio is to
                                                            provide a sustainable level of income whilst seeking to
                                                            preserve capital. The target total portfolio return (gross) of
                                                            the portfolio is 3% above the RBA cash rate. This return
                  Steve Anagnos                             will be generated from a combination of cash (interest
                  Co-Head, Income Strategies                payments and dividends), franking credits and capital
                                                            growth (realised and unrealised) from an active portfolio
                                                            strategy.
Steve has 25 years experience across financial markets
and investment management in a range of Senior roles        Risk tolerance: The portfolio aims to limit the risk of
                                                            capital loss through security diversification and active
at Citigroup, Bank of America Merrill Lynch, CBA and
                                                            portfolio management. It is suitable for investors that have
Strategic Capital Management. Steve’s focus has been
                                                            a 3 year + investment horizon that can tolerate secondary
in designing and implementing portfolio strategies using
                                                            market pricing and liquidity risks through the life of the
listed debt, hybrids and equity derivatives. Steve has a    securities, up to the respective first call/maturity date of
Bachelor of Economics degree and Master of Applied          each security.
Finance degree from Macquarie University.

8
Portfolio Holdings – Top 5 Portfolio Highlights
ASX Code Issuer Security Type A total of sixteen securities traded ex-distribution
WBCPG Westpac Bank Capital Note IV during the month, resulting in a gross income return for
the month of 1.27% and 1.57% for the quarter.
NABHA Nat Aust Bank Income Sec
CBAPD Comm bank PERLS VII The Total portfolio return has exceeded its return
objectives based on a period of 1 month, 3 months, 6
WBCPF Westpac Bank Capital Note III
months, 12 months and since inception. For the month
NABPC Nat Aust Bank Capital Note the total portfolio return was 0.82%, above its objective
of 0.40%. The total portfolio return for the quarter was
1.57%, higher than its return objective, 9.3% for the
Portfolio Characteristics 12 month period and 8.23% pa since inception (Sep
Expected Yield to Call/Maturity (including franking): 5.2% 2015).
Expected Gross Running Yield (including franking) 5.1% The Total Income Return (Gross) was 1.27% for
Expected Cash Running Yield (not including franking) 3.7% the month and 1.57% for the quarter, whilst the
commensurate income return since inception (Sep
Expected Years to Maturity 5.6
2015) is +5.79% p.a.
Number of Securities 22
The main contributors to performance during the month
Floating Rate exposure 100%
were MQGPB (+2.8%), ANZPG (+1.8%), and CBAPF
Fixed Rate Exposure 0% (+1.8%).
The main detractors to performance during the month
Markets Returns were NABPB (-0.5%), NABHA (-0.5%), and WBCPD
(-0.2%).
Return 1 Month 3 Month 1 Year
ASX200 Accumulation -0.02% 6.68% 9.24% The Five top securities that traded ex-distribution
during the month were MQGPB, ANZPF, MBLPA,
RBA Cash Rate 0.13% 0.38% 1.51%
WBCPC and CBAPE.
During the month we increased our exposure in
CBAPD and CBAPF from the higher allocation to cash
we had a result of exiting CTXHA in August.
The portfolio continues to enjoy favourable income
returns in a period where large new issues are heavily
bid for and supply is scarce. We continue to see
re-allocation from Equity based portfolios looking for a
lower risk alternative.
Portfolio Performance
Return 1 Month 3 Month 6 month 1 year 2 year Inception
Income Return (Gross) 1.27% 1.57% 2.64% 5.23% 5.54% 5.79%
Capital Return -0.45% 0.17% 1.06% 4.07% 2.87% 2.44%
Total Portfolio Return (Gross) 0.82% 1.74% 3.70% 9.30% 8.41% 8.23%
Portfolio Return Objective 0.40% 1.10% 2.30% 4.60% 4.80% 4.80%
Excess Return v Objective 0.42% 0.64% 1.40% 4.70% 3.61% 3.43%
9
Our Preferred Stocks
Audinate Group (AD8)                                          Oil Search (OSH)
Audinate Group (AD8) engages in the development and           Oil Search (OSH) explores for and produces gas and
commercialization of audio visual software and hardware.      oil through operations in Papua New Guinea. The
Its products include chips, modules, and cards with           Company’s activities are located in the Papuan Highlands
embedded software; reference designs; and software to         which include the Kutubu, Hides, and Gobe oil and gas
enable network configuration and management under the         projects.
Dante brand.
                                                              OZ Minerals (OZL)
Bank of Queensland (BOQ)                                      OZ Minerals (OZL) is an Australian based mining
Bank of Queensland (BOQ) is a full service financial          company with a focus on copper. The Company owns
institution. The Bank operates retail branches, business      and operates the Prominent Hill copper-gold mine and
banking centres, and equipment finance centres                the Carrapateena copper-gold project located in South
throughout Australia and New Zealand. Bank of                 Australia and has a number of equity interests in listed
Queensland also operates an automated teller machine          resource companies.
(ATM) network throughout Australia.
                                                              Rio Tinto (RIO)
Clydesdale Bank (CYB)                                         Rio Tinto (RIO) is an international mining company. The
Clydesdale Bank (CYB) provides commercial banking             Company has interests in mining for aluminium, borax,
services for retail and institutional customers. The          coal, copper, gold, iron ore, lead, silver, tin, uranium, zinc,
Company offers savings accounts, telephone banking,           titanium dioxide feedstock, diamonds, talc and zircon.
insurance, investment management, loans, credit               Dually-listed company with RIO LN.
cards, cash management accounts, financial planning,
mortgage, and internet banking. CYB operates in the           Stockland (SGP)
United Kingdom.                                               Stockland (SGP) is a diversified Australian property
                                                              group. The Group develops and manages Retail centres,
Flight Centre Travel Group (FLT)                              Residential Communities and Retirement Living assets
Flight Centre Travel Group (FLT) is engaged in travel         with a focus on regional centres and outer metropolitan.
agency business. The Company provides a complete              Stockland also owns a portfolio of Office and Industrial
travel service for leisure and business travellers in         assets.
Australia, New Zealand, the United States, Canada, the
United Kingdom, Africa, Middle East, Asia, New Zealand,       Woodside Petroleum (WPL)
and Europe. FLT consists of more than 30 brands with          Woodside Petroleum (WPL) explores for and produces
four categories of brands which are Leisure, Corporate,       oil and gas from offshore and onshore facilities located in
Wholesale and other. The flagship brand is Flight Centre      Western Australia and Northern Territory. The Company
leisure brand.                                                operates numerous oil and gas fields and pipelines
                                                              throughout Australia, United States and Mauritania and
Macquarie Group (MQG)                                         its products include liquefied natural gas, domestic gas,
Macquarie Group (MQG) offers banking, financial               condensate, crude oil and liquefied petroleum gas.
advisory, investment and funds management services.
The Company offers financial advice, cash management,
wealth management and private banking, life insurance,
securities brokerage, corporate debt financing, real estate
funds management, real estate development financing,
investment funds management, and foreign exchange
services.

10
Audinate Group (AD8)                                                                       Bank of Queensland (BOQ)
 Recommendation                                    BUY                                      Recommendation                                    BUY
 Risk                                              HIGH                                     Risk                                              MEDIUM
 Share Price (as at 18 October 2017)               $2.00                                    Share Price (as at 18 October 2017)               $13.27
 Target Price                                      $2.20                                    Target Price                                      $13.02
 Analyst                                           Danny Younis                             Analyst                                           David Spotswood

 Share Price Chart                                                                          Share Price Chart
  150                                                                                       125
                   AD8           ASX                                                                         BOQ           ASX
                                                                                            120
  140
                                                                                            115
  130                                                                                       110
                                                                                            105
  120
                                                                                            100
  110                                                                                        95
                                                                                             90
  100
                                                                                             85
   90                                                                                        80
    Jun-17       Jul-17      Aug-17       Aug-17       Sep-17         Sep-17      Oct-17      Oct-16      Dec-16       Feb-17       Apr-17         Jun-17     Aug-17     Oct-17

 Source: FactSet, Shaw and Partners                                                         Source: FactSet, Shaw and Partners

                                              1 mth              3 mth          12 mth                                                  1 mth                3 mth      12 mth
 Relative Performance*                        (1.6%)             1.7%          (10.8%)      Relative Performance*                           7.8%             0.3%         6.1%
 * Relative Performance is compared to the S&P/ASX 200 Index                                * Relative Performance is compared to the S&P/ASX 200 Index

Tech Leader, Global Standard, High Growth, Strong                                          Lining Up All Their Ducks
Returns, Attractive Outlook                                                                § Key Focus: Bank of Queensland (BOQ) is doing a good job
§ Audinate (AD8) is a very attractive Australian technology story                            managing costs, bad debts and capital, surprising the market
  with a large addressable market and a clear path to profitability                          with an 8cps special dividend. Key for BOQ now is managing
  with sound (and increasing) underlying fundamentals (gross                                 the volume margin trade off in a low growth environment. We
  margins over 75% [FY18F 76%] and FY18 sales growth over                                    now forecast 4-5% revenue growth and 1.5% cost growth in
  30% in USD terms).                                                                         FY18 which should mean the stock has ~4% earnings per
§ AD8’s growth strategy is multi-faceted. The company seeks to:                              share growth assuming bad debts remain well behaved. On
   1. grow the OEMs adopting Dante;                                                          a 6.9% dividend yield, the stock should generate a high single
   2. increase the adoption of Dante within existing customers’                             digit total shareholder return.
       product portfolios;                                                                 § Capital Very Strong: ARPA requires CET1 of 8.5%, BOQ
   3. drive other market participants’ adoption of Dante; and                               set at 9.25%, so can’t justify capital levels above that. Have
                                                                                             a lot of flexibility to return capital, spend on IT investment
   4. d
       eliver new products and services to both OEMs and end-
                                                                                             ($15m-$30m).
      users (e.g. Dante Domain Manager, adapters, video, etc.).
§ All intellectual property is wholly-owned by AD8. AD8 believes                           § Net Interest Margin: Will be up in 1H18.
  that its high gross margins are reflective of the intellectual                           § Bad Debts well behaved: Outlook remains positive, no signs
  property that is embedded in its products.                                                 of stress. Exposure to high risk areas (mining and apartment
§ AD8 reaffirms its FY18 outlook as disclosed in the Prospectus                              markets) very low. Provisioning remains strong, at 160% of
  dated 13 June 2017. Based on AUD / USD exchange rate of                                    impaired assets. We assume bad debts lift slightly in FY18 to
  77c, the company expects revenue of $18.6m and EBITDA                                      12bps of gross loans.
  loss of A$1.2m – Shaw and Partners in line with those
  projections.
§ Number of Dante-enables products on market continues to
  grow, increasing 310 from 872 in pcp to 1,182, or >5x the
  market adoption of its closest competitor, CobraNet, with c.
  200 products – with the number of OEMs also rising from
  310 in pcp to 369. The number of Dante units shipped has
  grown 48% from 122k to 181k, or 5% better than forecast
  (comprising 70% growth in Ultimo vs. 30% for Brooklyn).

 Forecasts                                                                                  Forecasts
 YE 30 June (AUD)                     2017 (A)          2018 (E)               2019 (E)     YE 31 Aug (AUD)                      2017 (A)           2018 (E)           2019 (E)
 Earnings cps                             (1.8)            (2.6)                   0.1      Earnings cps                            93.9               97.8              100.1
 Dividends cps                             0.0              0.0                    0.0      Dividends cps                           84.0               88.0               80.0
 PE x                                   (86.2)                                              PE x                                    13.4               12.1               11.8
 Yield %                                 0.0%                                               Yield %                                  6.7                7.5                6.8
 Franking %                               100                   100                100      Franking %                               100                    100            100

                                                                                                                                                                              11
Clydesdale Bank (CYB) Flight Centre Travel Group (FLT)
Recommendation BUY Recommendation BUY
Risk HIGH Risk MEDIUM
Share Price (as at 18 October 2017) $5.22 Share Price (as at 18 October 2017) $45.44
Target Price $6.09 Target Price $52.00
Analyst David Spotswood Analyst Darren Vincent
Share Price Chart Share Price Chart
130 150
CYB ASX FLT ASX
125 140
120 130
115 120
110 110
105 100
100 90
95 80
90 70
Oct-16 Dec-16 Feb-17 Apr-17 Jun-17 Aug-17 Oct-17 Oct-16 Dec-16 Feb-17 Apr-17 Jun-17 Aug-17 Oct-17
Source: FactSet, Shaw and Partners Source: FactSet, Shaw and Partners
1 mth 3 mth 12 mth 1 mth 3 mth 12 mth
Relative Performance* 3.7% 4.3% 19.3% Relative Performance* 19.4% 24.0% 31.1%
* Relative Performance is compared to the S&P/ASX 200 Index * Relative Performance is compared to the S&P/ASX 200 Index
Good Bottom Up Story with Macro Starting to Turn Conviction Remains; Price Weakness Provides Chance to
§ Clydesdale Bank (CYB) is a good bottom up story with Top Up
potential macro tailwinds. § While Flight Centre Travel Group (FLT) has retraced some of
§ Bottom Up Momentum: CYB’s 3Q17 trading update was the gains made over 2Q17 our conviction in our BUY rating
positive with margins up, good volumes good, loan losses remains. There has been little significant news flow since FLT
down and management are ahead on the cost out story. reported its results in August that has been relevant to our
investment view (including its 11 Oct conference presentation
§ Macro: Official Data Shows Inflation now 3.0%, this is well
pack), especially compared to the company’s significant
above the Bank of England’s 2.0% target. We currently
change in focus towards minimizing cost growth announced
assume 75bps of cash rate increases in the UK by the end of
with its FY17 results.
2019, which would lift cash rates to 1.0%. This results in an
8bps increase in margins in 2019. § With its results, FLT provided an increased level of visibility
into the curtailing of cost growth (Mel Waters- Ryan with
§ Higher cash rates a positive – £10.7bn current account will
key executives has taken responsibility for minimising cost
not reprice with higher rates. We assume 60% competed
growth), expectations re income and net margins, a change
away. This could prove conservative, and obviously a 1%
of business mix going forward and top line initiatives. It also
cash rates is still low.
stated that it is targeting a return to 2% net margin (PBT
§ CYB report their FY17 result on the 21st November. as a % of TTV) within 3-5 years, adding that many of its
businesses are doing better than this now!
§ FLTs AGM on 9 November is expected to provide the next
significant news flow. FLT has stated that it will provide FY18
guidance at its AGM. We will also be looking for further
commentary around the program to curtail cost growth.
Guidance could be significant to both short and longer term
consensus forecasts given that little of FLT’s aspirational 2%
net margin has been factored into longer term consensus
forecasts.
Forecasts Forecasts
YE 30 Sep (GBP) 2016 (A) 2017 (E) 2018 (E) YE 30 June (AUD) 2017 (A) 2018 (E) 2019 (E)
Earnings cps 16.3 21.0 26.6 Earnings cps 228.5 254.9 282.2
Dividends cps 0.0 4.2 10.6 Dividends cps 139.0 154.5 170.9
PE x 15.9 13.4 10.6 PE x 16.8 17.1 15.4
Yield % 0.0 1.5 3.8 Yield % 3.6 3.5 3.9
Franking % 0 0 0 Franking % 100 100 100
12Macquarie Group (MQG) Oil Search (OSH)
Recommendation BUY Recommendation BUY
Risk MEDIUM Risk HIGH
Share Price (as at 18 October 2017) $92.93 Share Price (as at 18 October 2017) $7.17
Target Price $102.44 Target Price $7.50
Analyst David Spotswood Analyst Stuart Baker
Share Price Chart Share Price Chart
120 115
MQG ASX OSH ASX
115 110
110 105
105 100
100 95
95 90
90 85
Oct-16 Dec-16 Feb-17 Apr-17 Jun-17 Aug-17 Oct-17 Oct-16 Dec-16 Feb-17 Apr-17 Jun-17 Aug-17 Oct-17
Source: FactSet, Shaw and Partners Source: FactSet, Shaw and Partners
1 mth 3 mth 12 mth 1 mth 3 mth 12 mth
Relative Performance* 2.3% 3.5% 23.4% Relative Performance* (6.6%) (8.1%) (13.9%)
* Relative Performance is compared to the S&P/ASX 200 Index * Relative Performance is compared to the S&P/ASX 200 Index
Attractive Valuation Beating Expectations
§ Reconfirmed FY18 guidance: Macquarie Group (MQG) have § The Exxon-operated PNG LNG plant continues to perform
reconfirmed guidance of flat earnings twice in the last three at above name-plate rates, resulting in FCF expansion and
months. We have earnings up 4%. MQG are now saying they reduction in unit cash and non-cash costs. In Q3 2017, the
expect 1H18 earnings to be up on pcp, and broadly in line plant operated at 8.6MTP, far higher than the original 6.6
with 2H17 due to performance fees. Looks like have started MTPA design rate.
the year well. Second half earnings normally higher than first § The balance sheet is strong and cash generation is robust
half, if we double 2H17 profit get 5% growth, which seems at current oil prices. Capex and opex for CY2017 have been
reasonable. guided lower. Cash on hand rose to US$1.1B and net debt
§ FX: 63% of MQG’s earnings are offshore, the average fell to US$2.67B at September 30.
AUDUSD rate was c75 last year, if the currency falls this will § Longer term LNG expansion plans are progressing with
be positive for MQG. JV partners in both the Total and Exxon operated ventures
§ Valuation: ex upcoming dividend MQG is on 13.5x and planning to submit a co-ordinated development plan to
continues to looks attractive versus peers. the PNG Government in late 2017. Engineering and gas
§ MQG report 1H18 results on Friday 27th October. marketing activities are planned to begin in 2018.
Forecasts Forecasts
YE 31 Mar (AUD) 2017 (A) 2018 (E) 2019 (E) YE 31 Dec (USD) 2016 (A) 2017 (E) 2018 (E)
Earnings adj cps 644.2 690.7 731.7 Earnings cps 7.0 15.0 16.6
Dividends cps 470.0 503.9 533.9 Dividends cps (AUD) 4.7 9.5 10.6
PE x 14.0 13.0 12.2 PE x 74.2 33.3 30.3
Yield % 5.2 5.6 6.0 Yield % 0.7 1.5 1.7
Franking % 45 45 45 Franking % 0 0 0
13OZ Minerals (OZL) Rio Tinto (RIO)
Recommendation BUY Recommendation BUY
Risk HIGH Risk MEDIUM
Share Price (as at 18 October 2017) $8.47 Share Price (as at 18 October 2017) $70.92
Target Price $10.40 Target Price $75.00
Analyst Peter O’Connor Analyst Peter O’Connor
Share Price Chart Share Price Chart
190 150
OZL ASX RIO ASX
140
170
130
150
120
130
110
110 100
90 90
Oct-16 Dec-16 Feb-17 Apr-17 Jun-17 Aug-17 Oct-17 Oct-16 Dec-16 Feb-17 Apr-17 Jun-17 Aug-17 Oct-17
Source: FactSet, Shaw and Partners Source: FactSet, Shaw and Partners
1 mth 3 mth 12 mth 1 mth 3 mth 12 mth
Relative Performance* 1.6% (9.8%) 11.7% Relative Performance* 3.1% 7.8% 26.7%
* Relative Performance is compared to the S&P/ASX 200 Index * Relative Performance is compared to the S&P/ASX 200 Index
SQ Report: CY17 Costs/Prodn Tracking To Guidance SQ Report: Iron Ore, Tio2, Aluminium, Coal; Copper
§ Power prices: OZ Minerals (OZL) plans on a cheaper Weakness Covered By Price Uptick
tomorrow – The new power price kicked (previously flagged) § First pass thoughts: Numbers look Ok – As usual a lot of
in for SQ17 accounting for almost all the uptick in site data points and a lot of potential “noise”. But for mine always
processing costs. OZL is positioning for the current phase of focus first where the money is made ie iron ore, aluminium
power price tightness to “transition” to easier prices over the and copper – two of the holy trinity have delivered good
next year or so. Current deal at Prominent Hill runs thru end production/sales as well as supportive price backdrops
FY18 and power deal NOT required at Carrapateena until = earnings OK. Copper disappointingly slipped again but
mid-2019 (NB Transmission agreement secured). Escondida is due to come back with a wet sail over the next
§ Key production details: Total copper 28,880t, total gold few quarters.
29,264oz, C1 Cash Costs (US91 cents/lb, Cash balance of § The key numbers: The three major earnings drivers for RIO –
A$639M (unaudited) at 30-Sep-17 with no debt. iron ore copper and aluminium delivered the following for SQ
§ Guidance on track: All production metrics on track to hit FY17 2017 (sequential moves); Pilbara iron ore production (100%
guidance (maintained prior targets): Copper production 105- basis) 85.8Mt, +11%Q/Q, Mined Copper 121 kt (3%)Q/Q,
115Kt; Gold production 115-125Koz and C1 Cash Costs (US Aluminium 887kt, flat Q/Q.
cents/lb) 85 - 95. § Iron ore: Heading for a record CY17 (330mt) and a record
§ BUY OZL: One of the key names in our BUY bucket along DQ (356mt rate required) to bring home the bacon. Given
with nickel, copper, big caps and Iluka. Recent performance seasonal patterns this looks achievable given DQ usual
has lagged the underlying commodity mix (AUD terms) as delivers around 27-28% of annual shipments - ~90mt.
with other copper names. We expect the continued delivery § BUY RIO. Check out the valuation trends - earnings trend has
to plan of the Carrapateena project to be key to closing this turned and valuation metrics can stretch (significantly) higher -
gap. Separately, we love the new office location. such a over time - with ongoing economic and of the Coal and Allied
shareholder positive development. asset sale.
Forecasts Forecasts
YE 31 Dec (AUD) 2016 (A) 2017 (E) 2018 (E) YE 31 Dec (USD) 2016 (A) 2017 (E) 2018 (E)
Earnings cps 37.1 51.9 46.4 Earnings cps 282.9 402.4 358.5
Dividends cps 20.0 20.0 11.0 Dividends cps (AUD) 190.2 262.3 228.9
PE x 21.3 14.4 16.1 PE x 15.3 12.1 13.6
Yield % 2.5 2.7 1.5 Yield % 3.3 4.1 3.7
Franking % 50 100 100 Franking % 100 100 100
14Stockland (SGP) Woodside Petroleum (WPL)
Recommendation BUY Recommendation HOLD
Risk LOW Risk HIGH
Share Price (as at 18 October 2017) $4.37 Share Price (as at 18 October 2017) $29.79
Target Price $4.83 Target Price $32.00
Analyst Peter Zuk Analyst Stuart Baker
Share Price Chart Share Price Chart
115 120
SGP ASX WPL ASX
110 115
110
105
105
100
100
95
95
90 90
Oct-16 Dec-16 Feb-17 Apr-17 Jun-17 Aug-17 Oct-17 Oct-16 Dec-16 Feb-17 Apr-17 Jun-17 Aug-17 Oct-17
Source: FactSet, Shaw and Partners Source: FactSet, Shaw and Partners
1 mth 3 mth 12 mth 1 mth 3 mth 12 mth
Relative Performance* (10.7%) (6.4%) (21.4%) Relative Performance* (5.9%) (5.7%) 3.7%
* Relative Performance is compared to the S&P/ASX 200 Index * Relative Performance is compared to the S&P/ASX 200 Index
Diversified Business Model And Strong Balance Sheet Highest Quality Assets In The Australian Industry
Leaves It Well Positioned For Growth § Woodside Petroleum (WPL) suite of LNG and oil assets are
§ Stockland (SGP) diversified business model and strong world class in terms of low cost and high operating margins,
capital position leaves it well placed to pursue investment enabling WPL to invest in growth through the oil price cycle.
opportunities across a multitude of real estate sectors as/ § There is near term production growth in LNG from Wheatstone
when they present themselves. As at 30 Jun 2017, SGP’s which has just entered production, to be followed by oil
gearing was 22.7%, and with a weighted average cost of from thee Greater Enfield development in 2019. Large oil
debt of 5.4%, if anything, we see SGP benefiting from interest discoveries offshore Senegal, West Africa are planned for
rate tailwinds rather than headwinds if rates rise in Australia. development in the 2021-2023 timeframe.
§ Its investment portfolio is dominated by exposure to the Retail § Undeveloped gas resources in the Browse Basin, and other
sector – and like all retail landlords, SGP is facing challenges gas assets offshore WA, are candidates for future production
due to market conditions (not simply due to the risk of online through the existing 5 NG trains at Karatha as the existing
retailing). However, occupancy remains high at 99.5% and north west shelf gas fields enter decline beyond 2020.
we remain confident that SGP can successfully manage its
tenant mix to keep positive rental growth across the portfolio.
§ The Residential business is performing well, with record low
volumes achieved in FY17. SGP has diversified its product
offering into medium density housing as well as land sales.
We think this increased product offering, plus its ongoing
focus on first homebuyers and the more affordable end of
the housing market, leaves it is well positioned. Pre-sales of
5,811 lots as at 30 Jun 2017 suggest another strong year for
this division in FY18.
Forecasts Forecasts
YE 30 June (AUD) 2017 (A) 2018 (E) 2019 (E) YE 31 Dec (USD) 2016 (A) 2017 (E) 2018 (E)
Earnings cps 30.5 32.6 34.1 Earnings cps 103.9 103.9 118.0
Dividends cps 25.5 26.5 27.8 Dividends cps (AUD) 111.6 108.3 120.6
PE x 14.3 13.3 12.7 PE x 21.7 22.0 19.4
Yield % 5.8 6.1 6.4 Yield % 3.7 3.6 4.1
Franking % 0 0 0 Franking % 100 100 100
15Recommendation Definitions Rating Classification Buy Expected to outperform the overall market Hold Expected to perform in line with the overall market Sell Expected to underperform the overall market Not Rated Shaw has issued a factual note on the company but does not have a recommendation High Higher risk than the overall market – investors should be aware this stock may be speculative Medium Risk broadly in line with the overall market Low Lower risk than the overall market. Disclaimer Shaw and Partners Limited ABN 24 003 221 583 (“Shaw”) is a participant of ASX Limited, Chi-X Australia Pty Limited and holder of Australian Financial Services licence number 236048. ANALYST CERTIFICATION The Research Analyst who prepared this report hereby certifies that the views expressed in this document accurately reflect the analyst’s personal views about the Company and its financial products. The Research Analyst has not been, is not, and will not be receiving direct or indirect compensation for expressing the specific recommendations or views in this report. As at the date of this report, the Research Analyst does have an interest in the financial products of ANZ, BHP, BOQ, CBA, CYB, LLC, MQG, NAB and SUN. DISCLAIMER This report is published by Shaw to its clients by way of general, as opposed to personal, advice. This means it has been prepared for multiple distribution without consideration of your investment objectives, financial situation and needs (“personal circumstances”). Accordingly, the advice given is not a recommendation that a particular course of action is suitable for you and the advice is therefore not to be acted on as investment advice. You must assess whether or not the advice is appropriate for your personal circumstances before making any investment decisions. You can either make this assessment yourself, or if you require a personal recommendation, you can seek the assistance of your Shaw client advisor. This report is provided to you on the condition that it not be copied, either in whole or in part, distributed to or disclosed to any other person. If you are not the intended recipient, you should destroy the report and advise Shaw that you have done so. This report is published by Shaw in good faith based on the facts known to it at the time of its preparation and does not purport to contain all relevant information with respect to the financial products to which it relates. Although the report is based on information obtained from sources believed to be reliable, Shaw does not make any representation or warranty that it is accurate, complete or up to date and Shaw accepts no obligation to correct or update the information or opinions in it. If you rely on this report, you do so at your own risk. Any projections are estimates only and may not be realised in the future. Except to the extent that liability under any law cannot be excluded, Shaw disclaims liability for all loss or damage arising as a result of any opinion, advice, recommendation, representation or information expressly or impliedly published in or in relation to this report notwithstanding any error or omission including negligence. This publication has been prepared in accordance with Shaw’s Research Policy. A copy of the Policy can be found at www.shawandpartners.com.au. DISCLOSURE Shaw will charge commission in relation to client transactions in financial products and Shaw client advisors will receive a share of that commission. Shaw, its authorised representatives, its associates and their respective officers and employees may have earned previously, or may in the future earn, fees and commission from dealing in the Company’s financial products. Shaw acted for AD8 in a corporate capacity within the past 12 months for which it received a fee. RISK STATEMENT Where a company is designated as ‘High’ risk, this means that the analyst has determined that the risk profile for this company is significantly higher than for the market as a whole, and so may not suit all investors. Clients should make an assessment as to whether this stock and its potential price volatility is compatible with their financial objectives. Clients should discuss this stock with their Shaw adviser before making any investment decision. 16
Register for Online Access
Online Portfolio Login
As a Shaw and Partners client, you are provided with free, secure online access
to view your portfolio anytime, anywhere.
Wide range of information included
Transaction history
Access to Shaw’s research library
Details of your CHESS holdings and
derivatives positions
Cash balances in your cash
management account
Access to confirmations and statements
records of each trade you have made
through Shaw
20 minute delayed ASX prices, quotes,
announcements, company profiles and
historical prices, and
‘Watch lists’ along with a charting
package to compare ASX listed stocks.
To register for online access please speak to your adviser, alternatively visit
http://www.shawandpartners.com.au/#/online-registration
17How the Shaw Managed
Accounts work
Shaw Managed Accounts (SMA) are a sophisticated investment and
reporting platform incorporating advanced features to assist in the
management of your overall investment strategy and portfolio.
Shaw Managed Accounts are established and offered The Model Portfolios are managed in a disciplined and
within the registered managed investment scheme consistent manner; overseen by a dedicated team of
known as the Separately Managed Accounts. Each investment professionals with many years of experience
investor has a separate “account” to which their in securities markets.
investments are allocated.
With Shaw Managed Accounts, not only are you the
Your account can be constructed by using a range of beneficial owner of the portfolio (and shares), you will
available investment strategies (referred to as Model also enjoy the ownership benefits (such as dividends
Portfolios) that you can select from the investment menu and franking credits) and have the ability to see the exact
together, with your Shaw and Partners adviser. make up and market value of the portfolio at any time,
via our online service.
Once you decide which Model Portfolios are best
suited to your investment needs and objectives, Shaw
and Partners will purchase securities to be included in
your account so that it reflects the Model Portfolio, or a
combination of Model Portfolios.
Investment goals (return, risk tolerance,
time horizon) and financial situation
Investor Shaw Adviser
Investment strategy, asset allocation
Shaw platform
Portfolio management
and performance
reporting
Shaw Direct Equity SMA Investment
Portfolio Service Model Portfolios professionals
in specie transfer Individual portfolio
of securities
18SMA Investment Options
At Shaw and Partners, we understand that your investment decisions may
vary depending on your stage of life and attitude towards risk.
Shaw and Partners offers 10 portfolio strategies designed to meet your
investment needs and objectives.
Portfolio Strategy Objective / Indicative Minimum
Benchmark Index number of suggested
securities investment
timeframe
Asset Class Portfolios
Shaw Debt Securities Income Portfolio RBA Cash rate + 1.5% 15 – 25 3+ years
Shaw Hybrid Income Portfolio RBA Cash rate + 3% 10 – 25 3+ years
(inclusive of franking credits)
Shaw Australian Equity (Large Cap) S&P/ASX 100 15 – 25 3+ years
Income Portfolio Accumulation Index
Shaw Australian Equity (Large Cap) S&P/ASX 100 15 – 25 3+ years
Core Portfolio Accumulation Index
Shaw Australian Equity (Large Cap) S&P/ASX 100 15 – 25 3+ years
Growth Portfolio Accumulation Index
Shaw Australian Equity (Small and Mid-Cap) S&P/ASX Small Ordinaries 15 – 25 3+ years
Growth Portfolio Accumulation Index
Shaw International Equity Portfolio MSCI World Index 15 – 25 3+ years
(ex–Australia unhedged)
Goal Based Portfolios
Shaw Income Goal Portfolio RBA Cash rate + 3% 15 – 25 3 – 5 years
(Gross Income and Total Return)
Shaw Balanced Portfolio RBA Cash rate + 4% 15 – 25 3 – 5 years
(Gross Income and Total Return)
Shaw Growth Goal Portfolio RBA Cash rate + 5% 15 – 25 3 – 5 years
Speak to your Adviser for more information about Shaw Managed Accounts
and to obtain a copy of the Product Disclosure Statement.
19Sydney | Head Office Melbourne Brisbane
Level 15, 60 Castlereagh Street Level 20, 90 Collins Street Level 28, 111 Eagle Street
Sydney NSW 2000 Melbourne VIC 3000 Brisbane QLD 4000
Telephone: +61 2 9238 1238 Telephone: +61 3 9268 1000 Telephone: +61 7 3036 2500
Toll Free: 1800 636 625 Toll Free: 1800 150 009 Toll Free: 1800 463 972
Adelaide Perth Canberra
Level 21, 25 Grenfell Street Level 14, 197 St Georges Terrace Level 1, 18 National Circuit
Adelaide SA 5000 Perth WA 6000 Barton ACT 2600
Telephone: +61 8 7109 6000 Telephone: +61 8 6188 7643 Telephone: +61 2 6113 5300
Toll Free: 1800 636 625 Toll Free: 1800 636 625 Toll Free: 1800 636 625
Holder of Australian Financial Services Licence Number 236048 | ABN 24 003 221 583 | Participant of ASX Limited, Chi-X Australia Pty Limited
20You can also read