Management Reference Materials - May 2020 The Okinawa Electric Power Company, Inc.
←
→
Page content transcription
If your browser does not render page correctly, please read the page content below
Management Reference Materials

                May 2020
        The Okinawa Electric Power Company, Inc.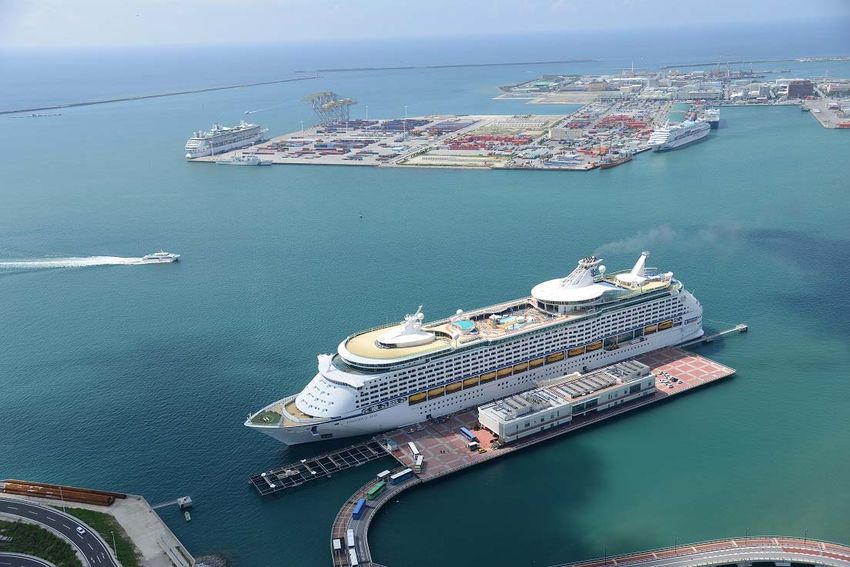
Contents
Main contents Q&A contents
Characteristics of the Business Base 1 Q1.Topics of Okinawa’s Economy
[ Demand for Energy ] 1) Current Status and Future Forecast of Okinawa's Economy 25
Okinawa Prefecture Demographics 2~3 2) Economic Growth of Okinawa Prefecture under the Okinawa Promotion Plan 26
Number of incoming tourists 4~9 3) Okinawa International Logistics Hub 27
Use of returned former U.S. military base sites 10 4) Aviation Industry Cluster 28
[ Competition ] Q2.What is the Current State of U.S. Military Bases? 29
Full liberalization of the Electricity Market 11 Q3.What is the Current State of Promotion of Electrification? 30
[ Total Energy Services ] Q4.What is the enrichment of electricity rate menus? 31
Gas supply business 12 Q5.What are the efforts to fuel cost reduction? 32~33
Energy Service Provider (ESP) Business 13~14 Q6.What are the efforts to reduce CO2 emissions? 34~36
[ Electric Power Generation Facilities ] Q7.Support for TCFD Recommendations 37
Power Supply Composition 15 Q8.The Fuel Cost Adjustment System 38
Yoshinoura LNG Thermal Power Plant 16 Q9.What is the approval that it's possible to engage in electricity transmission
39
Demand-Supply balance 17 and distribution on concurrent?
[ Remote Islands ] Q10.What are the Special Tax Measures? 40
Efforts to Improve Income and Expenditure 18 Q11.What are the efforts to typhoon measures? 41
[ Renewable Energy ] Reference 1:Trends of Ordinary Income and ROE 42
Status of Wind and Solar Power Electricity Generation Facilities 19 Reference 2:Trends of the Total Assets and Shareholder’s equity 43
Challenges for the introduction of renewable energies 20~22 Reference 3:Trends of the Capital Expenditure and Free Cash Flows 44
Efforts to expand the introduction of renewable energies 23~24 Reference 4:Change in Okinawa Electric Power’s Stock Price 45
Reference 5:Earnings Per Share and Payout Ratio 46
Reference 6:Policy for Returning Profits to Shareholders 47
Reference 7:Stock split 48
Reference 8:Repurchase of Shares 49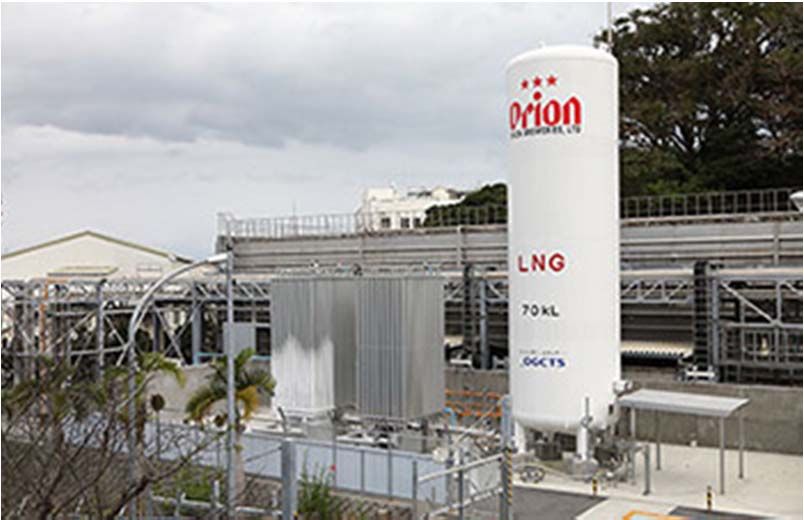
Characteristics of the Business Bases
Reference
Item Overview
Page
Increasing demand for energy due to population growth and increasing tourists.
Demand for As the proportion of energy for consumer use is high, effects of economic fluctuations are low for
2~10
Energy demand for Electric power.
Potential demand due to large-scale urban development projects
OEPC is outside the framework of wide-area power interchange because it has an isolated
system.
Competition OEPC has voluntarily released power of 10,000kW supplied by J-Power. 11
Competition is advancing due to the entry of energy suppliers.
Power producer and supplier is currently implementing plans to construct power plants.
Total Energy Started selling gas with the introduction of LNG.
12~14
Services Developing Total Energy Services by taking advantage of our ability to sell electricity and gas.
Reliant on fossil fuels only due to difficulties to develop nuclear or hydraulic power generation
Electric Power
A sufficient supply capacity is secured after Yoshinoura Thermal Power Plant has started
Generation 15~17
operations.
Facilities
A high reserve supply capacity is required due to an isolated system
OEPC supplies power to 11 isolated systems including those in the main island.
Remote Islands The region has a high cost structure because it has small islands and also because the scale of 18
the economy is small. This leads to constant loss recording.
Reducing fuel consumption and cost is highly effective on remote islands, where fuel unit price is
Renewable high.
19~24
Energy Since the system in the main island of Okinawa is small and independent, the limit of connection
volume is likely to occur when using renewable energy.
1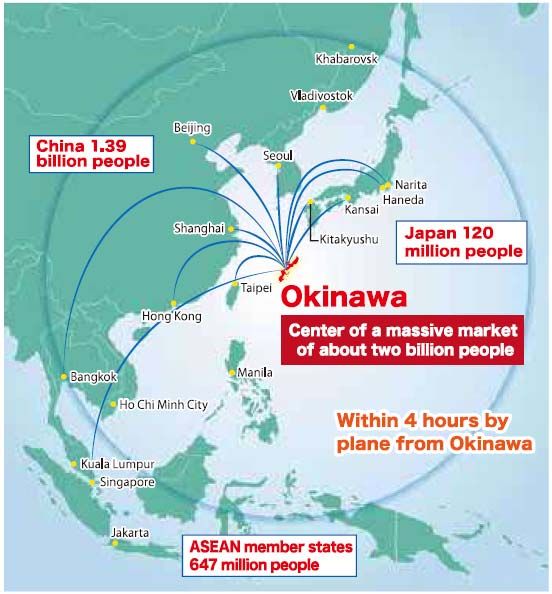
Okinawa Prefecture Demographics(1/2)
While the national population has started decreasing , the population in Okinawa is expected to
increase until around 2030. *
Demand for lighting is expected to increase as the population and number of households increases in
the future.
* According to the National Institute of Population and Social Security Research, "Regional Population Projections for Japan: 2015–2045 (2018)
Population Trend of Population and Households Households Population
⼈⼝(千⼈)
Trend of Population
⼈⼝(千⼈)
(Thousand People)
沖縄の⼈⼝、世帯数の推移
in Okinawa 世帯数(千世帯)
(Thousand) (Thousand People) 全国(沖縄除き)の⼈⼝の推移
(Excluding Okinawa)
1,500 130,000
⼈⼝
Population ⼈⼝
Population
世帯数
Households 606
593
582 600
572 1,466
560 125,995 125,811
1,450 551 125,000 125,661 125,494
543 1,453 125,263 124,995
1,448 124,714
1,443
1,439
1,434
1,426
1,419 500
1,400 120,000
118,637
1,350 400 115,000
2013 2014 2015 2016 2017 2018 2019 ・・・・・ 2029 2013 2014 2015 2016 2017 2018 2019 ・・・・・ 2029
(FY) (年度)
(FY)
(年度)
Source:
Population: The actual figures are based on the data provided by the Ministry of Internal Affairs Source: The actual figures are based on the data provided by MIC.
and Communications (MIC). The figures for FY2029 are based on estimated data provided by OCCTO.
The figures for FY2029 are based on estimated data provided by the Organization
for Cross-regional Coordination of Transmission Operators, JAPAN (OCCTO).
No. of households: The figures are based on the data provided by the Okinawa Prefecture
Government.
2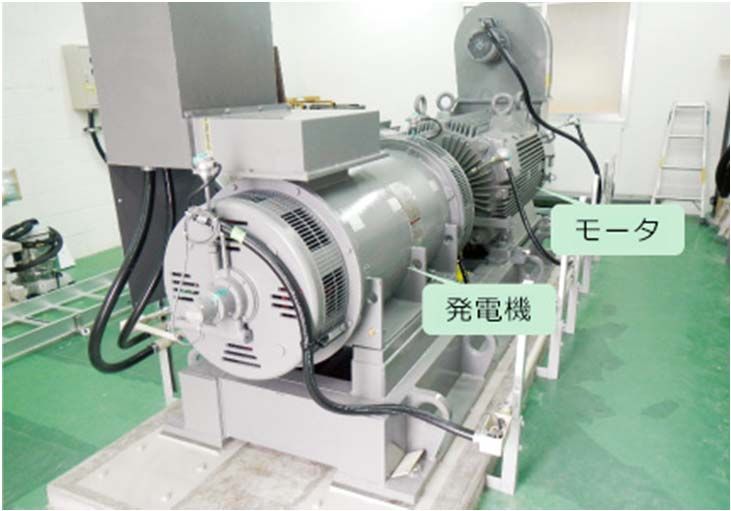
Okinawa Prefecture Demographics(2/2)
The total fertility rate of Okinawa Prefecture in FY2018 was 1.89, the highest among all prefectures in
Japan (nationwide:1.42)
While the number of the national population in FY2019 decreased by -2.2 persons per 1,000 people,
that of Okinawa increased by 3.9 people.
Okinawa Prefecture Demographics (People)
2015 2016 2017 2018 2019
Nationwide 1.45 1.44 1.43 1.42 ―
The total fertility rate
Okinawa 1.96 1.95 1.94 1.89 ―
(Per Thousand people)
Ranking (1) (1) (1) (1) ―
Nationwide -1.1 -1.3 -1.8 -2.1 -2.2
The Increase of population
Okinawa 5.6 4.0 2.6 3.1 3.9
(Per Thousand people)
Ranking (2) (2) (3) (2) (2)
Nationwide -2.2 -2.3 -3.0 -3.4 -3.8
The Natural Increase of population
Okinawa 3.9 3.8 2.9 2.6 2.0
(Per Thousand people)
Ranking (1) (1) (1) (1) (1)
Nationwide 0.7 1.1 1.2 1.3 1.7
The Social Increase of population
Okinawa 0.8 0.2 -0.3 0.5 1.9
(Per Thousand people)
Ranking (7) (11) (17) (11) (8)
Source: ”Vital Statistics” by Ministry of Health, Labour and Welfare
The figures in brackets in the chart show Okinawa Prefecture's national ranking
3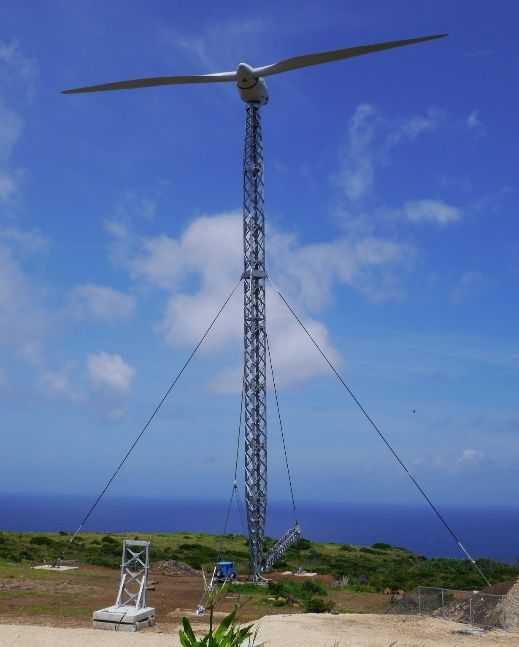
Number of incoming tourists(1/6)
In FY 2019, the number of incoming tourists was 9.47 million. Due to the spread of the novel
coronavirus, it fell below the previous year for the first time in eight years.
[Incoming tourists] FY2018 : 10,000 thousand people (Growth rate of 4.4% year-on-year)
FY2019 : 9,470 thousand people (Growth rate of -5.3% year-on-year)
⼊域観光客数及び宿泊施設客室数の推移
Trends of the Numbers of Incoming Tourists and Guest Rooms at Accommodation Facilities
⼊域観光客数(外国客) ⼊域観光客数(国内客) 宿泊施設客室数
(10(万⼈)
thousand people) (室)
(rooms)
Ta rget
49,560
1,200
50,000
1200 46,068
42,695 45,000
41,037 1,000
40,243
1000 38,891 38,905 958 947 400
38,152 40,000
36,359 37,050 877
35,005
33,654
32,320 794 300 35,000
800 31,238 269 249
717 213
28,303
658 167 30,000
593 592 99
571 589 569 571 63
600 557 553
517 10 19 24 38 25,000
14 25 28 30
12 800
689 700 698 20,000
627 664
400 595 618
543 561 570 570 544 542 554
505 523
15,000
200 10,000
2004 2005 2006 2007 2008 2009 2010 2011 2012 2013 2014 2015 2016 2017 2018 2019 2021
(年度)
(FY)
Note: The breakdown and total values do not match sometimes due to rounding decimals.
Source: “Tourism Guidebook”, “Summary Statistics on Incoming Tourists to Okinawa”, “2018 Accommodations Fact-finding Survey Result”,
“FY2019 Visit Okinawa Plan” and “Road map for promoting tourism in Okinawa (revised edition, March 2020)”
published by Okinawa Prefectural Government 4
Number of incoming tourists(2/6)
Due to the spread of the novel coronavirus, number of incoming foreign tourists fell sharply from the
previous year.
[Incoming foreign tourists] FY2018 : 3.00 million people (Growth rate of 11.5% year-on-year)
(FY)
FY2019 : 2.49 million people (Growth rate of -17.0% year-on-year)
(万⼈)
(10 thousand people) 外国⼈⼊域観光客数の推移
Change in number of incoming foreign tourists
350
台湾 300
300
中国本⼟ 269
249
250 92
韓国
213 81
⾹港 86
200
167 65
その他 69
55
150
44 61
99 55
100 54
25
63 45
23
26 25
38
50
25 28 30 22
13 19
9 10 8 53 60 52
37
0
2004 2005 2006 2007 2008 2009 2010 2011 2012 2013 2014 2015 2016 2017 2018 2019 (FY)
Note: The numbers between 2004 and 2008 are based on the calendar year, and those after 2009 are based on the fiscal year.
The breakdown and total values do not match sometimes due to rounding decimals.
Source: “Tourism Guidebook”, “Summary Statistics on Incoming Tourists to Okinawa” and “FY2019 Visit Okinawa Plan”
published by Okinawa Prefectural Government
5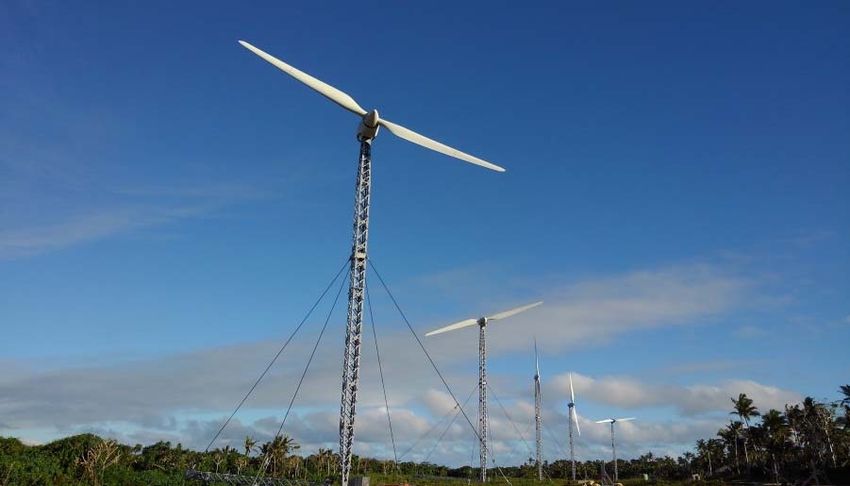
Number of incoming tourists(3/6)
FY2018 Apr-Dec︓7.59 million people Jan-Mar︓2.41 million people
FY2019 Apr-Dec︓7.75 million people Jan-Mar︓1.72 million people
(Growth rate of 2.1%year-on-year) (Growth rate of -28.8%year-on-year)
(10 thousand people) Monthly trend of the number of incoming tourist
110
FY2016
FY2017
95
FY2018
FY2019
80
65
50
35
Apr May Jun Jul Aug Sep Oct Nov Dec Jan Feb Mar
Source: “Tourism Guidebook” and “Summary Statistics on Incoming Tourists to Okinawa” published by Okinawa Prefectural Government
6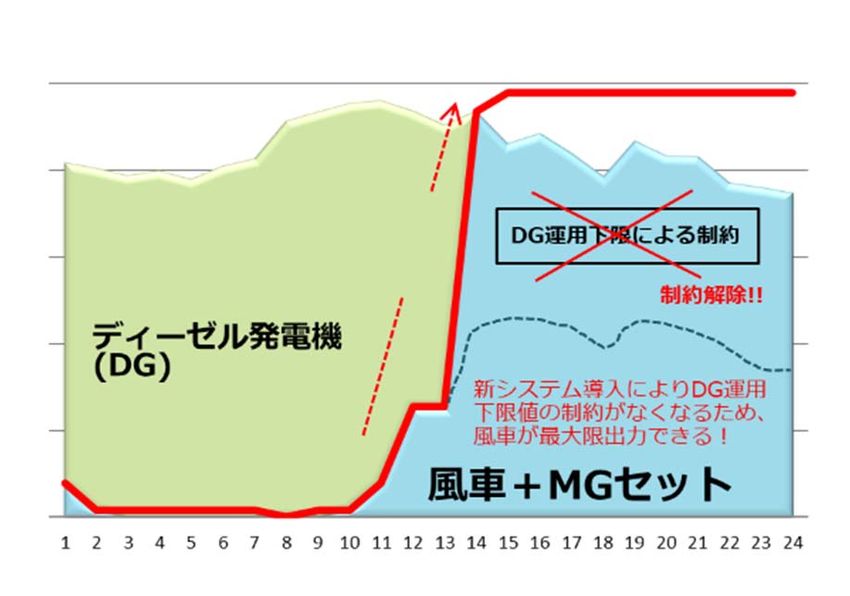
Number of incoming tourists(4/6)
The number of cruise ships calling at the port has been increasing, and marked a record high of 581 times (up 10%)
in 2019(calendar year).
The number between Jan and March 2020 has been reduced to 34 times (Growth rate of -70.7% year-on-year) due to
spread of novel coronavirus.
Aim to strengthen attraction and acceptance system by deploying new berth to ports within Okinawa Prefecture.
Scene of 3 ships calling at Naha Port at the same time (July 28, 2015) Trend in Number of Cruise Ship Calls
(times) in Okinawa Prefecture (Calendar year)
700
581
600 528
Legend of the Seas SuperStar Aquarius 515
69,130 GT 51,309 GT 500
264m 229m 387
400
300
219
200 162
126
貨物岸壁
Cargo Wharf
貨物岸壁
Cargo Wharf 100
(新湊ふ頭7号岸壁)
(Shinko Berth 7)
(新湊ふ頭9号岸壁)
(Shinko Berth 9) 0
Passenger Ship
旅客船岸壁 2013 2014 2015 2016 2017 2018 2019
Wharf
(泊ふ頭8号岸壁)
(Tomari Berth 8) Source:Okinawa General Bureau
Change in number of incoming foreign
Voyager of the Seas
137,276 GT tourists(by Air and Sea)
311m 400
By Air By Sea 300
300 269
249
213 120
167 99
200 106
70
Naha Cruise Ship Terminal
99 51
has been operational since
100 63 180
April 1, 2014 24 170
116 143 143
19
75
44
Provided by Naha Port Authority 0
2013 2014 2015 2016 2017 2018 2019 (FY)
Source: “Tourism Guidebook” and “Summary Statistics
on Incoming Tourists to Okinawa” published by Okinawa
Prefectural Government 7
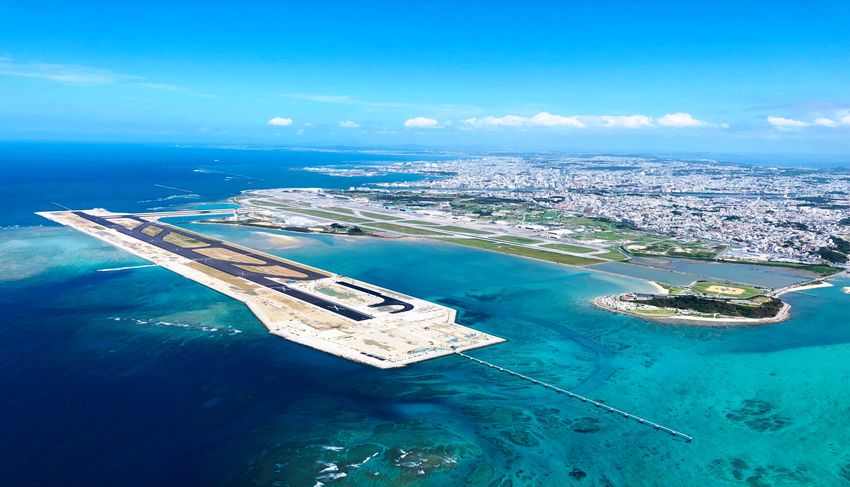
Number of incoming tourists(5/6)
A second runway at Naha Airport started operation on March 26, 2020. Annual departure and arrival
capacity has expanded 1.8 times as much as before.
Operation start: March 26, 2020 Reclaimed land area: about 160 ha
Departure and arrival capacity: about 135,000 times a year → about 240,000 times a year Total construction cost: about 207.4 billion yen
(an annual increase of 105,000 times)
*excluding helicopters and midnight flights
1,310m
Source : Provided by Okinawa General Bureau ( It was taken on September 2019 )
8Number of incoming tourists(6/6)
Accompanying an increase in tourists visiting the region, the numbers of accommodation facilities and
guest rooms have kept increasing in Okinawa Prefecture.
Going forward, multiple accommodation facilities are planned to open.
Major Plans for Opening Accommodations
Okinawa Main Island Miyako Island
Ishigaki Island
[Opening Timing]
▲ 2019
■ 2020
● After 2021
◆ Pending
Source: Compiled by OEPC based on newspaper reports, etc. *Including projects still pending 9Use of returned former U.S. military base sites
If the US military facilities are returned, demand is expected to decrease temporarily.
However, demand will subsequently increase on the strength of revitalization of the local economy
following redevelopment of the US military facilities sites.
Kuwae Kitamae area Former Awase Golf Course site
Former Onna Communication ○Development area: 38.2ha ○Development area: 48ha
Site development project ○Economic effect: ○Economic effect:
(Onna-son) 33.6 billion yen a year 24.2 billion yen a year*
* Planned value
Camp Zukeran
151ha
Nishi-futenma residential area
Former base site utilization
project(Ginowan-shi)
Futenma Airport
481ha
Makiminato Service Area
274ha
Urasoe west coast
development project
(Urasoe-shi)
Around Tedako-uranishi station
Smart City development project
(Urasoe-shi)
Naha new urban area Large-scale MICE project
○Development area: 192ha (Yonabaru-cho,Nishihara-cho)
○Economic effect:
163.4 billion yen a year Legend:
︓Swift return
︓Return after function transfer within the prefecture
︓Return after U.S. Marine Corps is transferred to a foreign location
* Source: The material of the Okinawa Revitalization Council Chair and Specialized Committee Meeting (third session) presented on the Cabinet Office website, and Survey of
Consideration of Ripple Economic Effects from Utilization of Former U.S. Forces Sites posted on the Okinawa Prefectural Government website
10Full liberalization of the Electricity Market
After the Full liberalization of the Electricity Market in April 2016, PPS* that use power supply from J-POWER’s Ishikawa
Coal Thermal Power Station or the feed-in tariff system have been entering the market. As a result, Okinawa area has
also beginning full-scale competition.
The number of cases of switching increased to 33,400 cases in cumulative total (as of April 2020) due to partly the entry
of PPS that take advantage of “the wholesale electricity menu for supply-demand adjustment”, which has been on offer
since April 2018. As a result, PPS’ share in the electricity sales volume in Okinawa area reached 6.3% in the total of all
voltages (as of Jan 2020).
[PPS’s share in electricity sales volume]
Extra High voltage: 1.6%, High voltage: 12.1%, Low voltage: 3.9% * new suppliers, officially called power producer and suppliers
Usage Status of Switching Support System Trend of PPS’s Share in Electricity Sales Volume
(Number)
(Cumulative amount) (By voltage)
40,000 15.0%
High voltage: 12.1%
35,000 33,400
31,500
30,000 28,200
25,900
23,800 10.0%
25,000
21,600
19,300
20,000
17,000
15,200
15,000 12,900
11,400 5.0%
10,000
Low voltage: 3.9%
10,000 6,6008,400
5,900
5,000
5,000 2,800
100 600 Extra High voltage: 1.6%
0.0%
0
Source : “Usage Status of Switching Support System”. Source : “Electricity Trading Report”. 11Gas supply business
Commenced gas supply business in 2015.
The OEPC Group will expand to supply to broad areas through pipelines, based on PEC's*¹ satellite facilities.
Pipeline supply (5 cases) Lorry supply (8 cases) PEC Supply Center (7 cases)
Supplies gas to customers in the vicinity of Supplies LNG by tank lorry to customers in At former U.S. military base site and industrial
the Yoshinoura thermal power plant through areas where pipelines are difficult to be parks, PEC*1 constructs supply centers*2 and
gas pipelines after vaporizing and odorizing developed. supplies gas through pipelines.
liquefied natural gas (LNG).
PEC’s*¹
Yoshinoura Yoshinoura Customer’s Yoshinoura Satellite
thermal power Vaporization Customers thermal power Satellite thermal power Facility Customers
plant and adding plant Facility plant
odor Tank lorry Tank lorry
Gas meter Gas meter
*1: Progressive Energy Corp.
*2: Awase Natural Gas Supply Center,
Suzaki Natural Gas Supply Center
and Makiminato Natural Gas Supply Center
Promote expanding sales Principal customers
other than former general
gas utilities
Okinawa Gas Co. (Wholesale)
TAKUNAN STEEL CO., LTD
Okinawa Watakyu shingu Co.
ORION BREWERIES,LTD
Chubu Tokushukai Hospital
ITO EN, LTD.
Hyatt Regency Seragaki Island, Okinawa
Royal Hotel OKINAWA ZANPAMISAKI
*Customers to whom we supply over 500t of gas per year
Forecast Target
12Energy Service Provider (ESP) Business (1/2)
We have established a new company called The Reliance Energy Okinawa, Inc., which is an energy
service provider (ESP) in December 2017.
We own electric and heat source facilities on behalf of customers, and process and supply energy.
[Increase in new energy demand] [Advancement and diversification of energy needs]
• Large-scale development of urban areas • Initial investment in energy use (e.g. electricity and gas)
(e.g. former U.S. military bases) • Burdens involved in facility operation/maintenance and
• Construction of hotels in response to an increase in the number emergency response
of tourists
• Construction of large-scale retail stores
Okinawa
Prefecture Customer
The Reliance Energy Okinawa, Inc.,
• It owns energy facilities on behalf of customers.
• It provides electricity and gas in the forms of, for example, air-conditioning water (cold / hot), hot-water supply and steam.
13Energy Service Provider (ESP) Business (2/2)
In June 2019, a service for the “SAN-A Urasoe West Coast PARCO CITY”, was launched.
We are looking to development of Total Energy Services for broad areas mainly from the energy center that will be built
on the premises of the OEPC. For example, we are looking to supplying to buildings on the premises, and supplying to
multipurpose building that is planned to be constructed nearby.
< Examples of businesses adopting ESP> [Schematic Overview of Energy Center]
SAN-A Urasoe West Coast PARCO CITY
Service launch date: June 2019 (Facility ownership and operation
maintenance management)
Energy Center
Lab 4 of the Okinawa Institute of Science and
Technology Graduate University Air-conditioning
Service launch date: April 2020 water (cold / hot)
Electric
power
・Turbo refrigerator
San-A Nishihara City (Existing renovation) Okinawa
etc.
Service launch date: April 2020 Electric
Power
Company, Heavy
Yuuaikai Yuuai Medical Center (A new hospital of Inc. oil
Tomishiro Central Hospital) Electric
Service launch date: May 2020
・Receiving and
transforming facility
San-A Ishikawa City Gas ・Regular / emergency
Scheduled service launch date: Summer 2020
generator
etc.
Yugaf Holdings, Inc. (hotels, offices, etc.) Makiminato Natural Gas
Scheduled service launch date: November 2021 Supply Center
New main building of Okinawa Electric Power Electric power
Company, Inc. Water (cold / hot) etc
Scheduled service launch date: May 2022 Emergency power supply
Gas
14Power Generation Facilities
(Power Supply Composition)
The composition of electric power source is highly reliant on fossil fuel, as developing nuclear or hydroelectric power
generation is difficult in Okinawa due to the reasons of geographic condition and the small scale of demand. Accordingly,
fossil fuels; petroleum, coal and LNG, are the only source for the composition.
We have secured long-term power supply capacity, the improvement of energy security, and effective countermeasures
for global warming issues by commencing the operation of Yoshinoura Thermal Power Plant(since 2012), our first plant
using LNG.
Electric Power Composition Ratio(Power generating end)
2% 6%
100%
再エネ・その他
New Energy, Others
23% 14%
80% (8%) (9%)
⽯油
Oil
20%
60% LNG
LNG
40% ⽯炭
Coal
75%
60%
20% Note 1: The figures include other companies
(but excluding demand shifted to new power
suppliers)
Note 2: The figures include both the main land and
0% remote islands.
Note 3: The figures is generator output.
2011 2019 Note 4: The percentage in brackets () for oil refers to
(Before starting operation of the percentage for remote islands stated
Yoshinoura LNG Thermal Power Plant) again.
15Power Generation Facilities
(Yoshinoura LNG Thermal Power Plant)
Yoshinoura Thermal Power Plant was constructed as OEPC first LNG thermal power plant from the viewpoints of
securing stable supply of electricity, increasing energy security, environmental measures and venturing into gas-related
business.
Yoshinoura Multi Gas Turbine Power Plant was constructed mainly for the purposes of starting power grids in case that
the entire main island of Okinawa loses all electricity sources, dealing with the electricity peak of normal time.
[Outline of the Power Plant]
Yoshinoura Yoshinoura
Name
Thermal Power Plant Multi-Gas Turbine Power Plant
Location Nakagusuku-son, Okinawa Prefecture
Power
generation 251,000kW2 power generators 35,000 kW 1 plant
capacity
LNG, kerosene
Fuel Liquefied natural gas (LNG) (The normal fuel to be used is
LNG.)
Storage
140,000kl 2 stations
facilities
Start of Generator No.1:November 27, 2012
commercial March 20, 2015
operation Generator No.2:May 23, 2013
Contractor: Osaka Gas Co., Ltd.
Contract period: 27 years from FY2012 (main source of
Fuel
supply: Gorgon in Australia)
procurement
Contracted quantity: About 400,000 t/year
Terms of delivery: Delivery on ship’s arrival (EX-Ship)
16Demand - Supply balance
A high generation reserve margin is necessary because of OEPC’s isolated system and the
responsibility to provide stable supply as a public utility.
The reserve capacity exceeding of the largest unit is secured so that it is possible to provide stable
supply even if the largest unit breaks down.
We would ensure long-term and stable supply.
Demand-supply balance of maximum electric power (August) (Unit : Thousand kW, %)
2019 2020 2021 2022 2023 2024 2025 2026 2027 2028 2029
(Reference)
Supply capacity 2,217 2,002 2,268 2,133 2,277 2,324 2,273 2,274 2,278 2,282 2,286
Demand-supply
Peak load 1,500 1,500 1,510 1,521 1,529 1,538 1,547 1,555 1,564 1,572 1,581
balance
Reserve supply
capacity
717 502 758 612 748 786 726 719 714 710 705
Reserve supply
rate 47.8% 33.5% 50.2% 40.2% 48.9% 51.1% 46.9% 46.2% 45.7% 45.2% 44.6%
Note: Based on FY2020 Supply Plan Notification. (general transmission / distribution business)
17Remote Islands
(Efforts to Improve Income and Expenditure)
The region has a high cost structure because of such reasons as having small islands scattered about a vast sea area
and the narrow scale of the economy.
Remote island business occupies about 10% of electricity sales and residential, commercial and industrial use charges.
Aguni
Kume
The main island of Okinawa
Tonaki Kitadaito
Minamidaito
Tarama
Miyako
Yonaguni Ishigaki
Hateruma
Electricity Sales Volume Electricity Sales
(FY2019 results) (FY2019 results) (Efforts to improve remote island income and
(Total : 7,316 million kWh) Remote Islands (Total : 171.9 billion yen) Remote Islands expenditure)
689 million kWh 17.1 billion yen Reducing fuel consumption by introducing renewable
(9.4%) (9.9%) energies (Tiltable wind power generators, etc.)
Effective utilization of waste oil
Reducing the fuel consumption rate by introducing
high-efficiency units
Main Island Main Island
6,627 million kWh 154.8 billion yen
90.6% 90.1%
18Status of Wind and Solar Power
Electricity Generation Facilities
The OEPC Group has new energy facilities with total output of 27,868kW
(wind power: 22,130kW, solar power: 5,738kW).
【 OEPC 】 【 Group company】
Name No. of Output Remark Name No. of Output Remark
Units Units
Ogimi Wind Power 2 4,000 kW Sosu Wind Power 2 3,600 kW
Yonaguni Wind Power 1 600 kW Nakijin Wind Power 1 1,995 kW
Wind Power
Aguni Tiltable Wind Power 1 245 kW *1 Gushikawa Wind Power 1 1,950 kW
Wind Power
Minamidaito Tiltable Wind Power 2 490 kW *1 Sashiki Wind Power 2 1,980 kW
Tarama Tiltable Wind Power 2 490 kW *1 Iejima wind Power 2 1,200 kW
Hateruma Tiltable Wind Power 2 490 kW *1 Iejima Daini wind Power 2 1,490 kW
subtotal(6 ) 10 6,315 kW Karimata Wind Power 2 1,800 kW
Abu Mega Solar Power ― 1,000 kW Sadefune Wind Power 2 1,800 kW
Kitadaito Daini Solar Power ― 100 kW *2 subtotal(8) 14 15,815 kW
Miyako Mega Solar Power ― 4,000 kW *2 ― 10 kW
Solar Power
Iejima Solar Power
Power
Solar
Miyako Branch Solar Power ― 10 kW Tokashiki Solar Power ― 198 kW
Tarama Solar Power ― 250 kW *2
subtotal(2) ― 208 kW
Yaeyama Branch Solar Power ― 10 kW
Hateruma Solar Power ― 10 kW
Yonaguni Solar Power ― 150 kW *2
subtotal(8) ― 5,530 kW
(As of March 31, 2020)
*1 Tiltable Wind Power
*2 Micro grid (a combination of system stabilizing technologies such
as storage batteries)
19Challenges for the introduction of renewable energies(1/3)
1 Wind power generation
Examination criteria tightened for construction
of wind power generation facilities in Japan
(2016).
"Extreme wind speed"* ,which is the Reference wind speed
construction standards in Okinawa, is "90 m/s". across Japan
Reference wind speed Vo
(m/sec)
At present, no wind turbine manufacturers
around the world is producing wind power
generation facilities that meet these standards.
As a result, it is practically impossible to
introduce new ones.
We are considering whether it is possible to
install wind turbines by devising operational
aspects (maintenance, monitoring system,
safety measures, etc.).
* Extreme wind speed
Extreme mean wind speed that may be experienced
in the next 50 years [Design reference wind speed distribution]
Extreme wind speed (90 m/s) *Image of "Building Standards Act Notice No.1454" categories
= Reference wind speed (46 m/s) × a × b × c
a: Coefficient corresponding to the terrain Source: Japan Exterior Industry Association website
b: Coefficient corresponding to the hub height, etc.
c: Coefficient corresponding to the maximum
instantaneous wind speed
20Challenges for the introduction of renewable energies(2/3)
2 Solar power generation
The amount of solar PV generation interconnection in the Okinawa area has increased rapidly since
the implementation of the feed-in tariff scheme (FIT scheme) in July 2012.
Since the system in the main island of Okinawa is small and independent, the limit of connection
volume is likely to occur when using renewable energy.
[Connection of renewable energies]
■ Main island of Okinawa (MW)
Amount already connected Connection application amount
200%
30-day output Amount Connection
control limit already application Total
connected amount Connectable amount
150%
(30-day output control limit)
Solar 495 352 101 453
100%
■ Remort islands (kW)
50%
30-day output Amount Connection
control limit already application Total 0%
connected amount Main Island Miyako Island Ishigaki Island Kume Island
Miyako 24,101 28,585 9,660 38,245 * The connectable amount (30-day output control limit) and the
Ishigaki 21,991 19,385 7,353 26,738 connected (applied) amount are figures of solar PV generation
Kume 2,719 2,504 5 2,509 only for the Main Island, while those of whole renewable energies
including wind power for the three remote islands.
* As of March 31, 2020
21Challenges for the introduction of renewable energies(3/3)
Due to expanded introduction of renewable energies, the lower operating limit of thermal power
generation which is necessary for a stable supply is approaching.
There is an increasing possibility of controlling the output of renewable energies in order to maintain
the balance between supply and demand.
Renewable
Supply and demand situation
energy output
①Area demand
749,000 kW
②Solar PV
260,000 kW
37,000 kW to the lower operating
limit of thermal power generation
③Thermal power output Lower limit of thermal power generation
489,000 kW 452,000 kW
0 1 2 3 4 5 6 7 8 9 10 11 12 13 14 15 16 17 18 19 20 21 22 23(Time)
22Efforts to expand the introduction of renewable energies(1/2)
1 Introduction of Tiltable wind power generators
It's problem that damaging to wind turbines due to strong wind because Okinawa is tha area to hit
typhoons frequently.
The introduction of Japan’s first tiltable wind power generators has enabled the stable operation of
renewable energy and reduced the cost of fuel and repair and maintenance.
Currently, it has been introduced to 4 remote islands, Aguni,MinamiDaito,Tarama and Hateruma.
<Characteristics and advantages of Tiltable wind power generator>
Wind power generators can be tilted nearly 90 degrees so that damages by strong winds from typhoons can be avoided
by tilting them.
Wind power generators do not need large-size cranes to construct and can be constructed in moderate hilly areas.
Wind power generators are retractable so that maintenance work
can be carried out on the ground.
Wind power generators are supported by wires.
▲Aguni tiltable wind power generators when tilted
23Efforts to expand the introduction of renewable energies(2/2)
2 Introduction of motor generator (MG set) in Hateruma Island
Demonstration test of motor generator (MG set) is under way.
The MG set operates powered by a battery charged with
excess electricity from renewable energy sources. The system
effectively utilizes surplus electricity from renewable energy
sources, which could not be supplied to the grid before and
motor
therefore was restricted.
The system is connected to the commercial grid as a unit with generator
the same functions as a diesel generator. This is a globally
unprecedented initiative to expand the introduction of
renewable energies.
The electricity used on Hateruma Island was temporarily*
supplied using 100% renewable energy.
* 1 hour 47 minutes from 5:35 AM to 7:22 AM on November 27, 2018
Wind speed up
(Increase in electric power Constraint due to DG Constraint due to DG
according to wind turbine lower operating limit lower operating limit
theoretical power
generation) Constraint removed!!
Diesel generator
Electric power
according to wind
(DG)
Even if the wind speed With the introduction of the new
turbine theoretical increases, WT cannot output system, there is no constraint of DG’s
power generation anymore due to DG’s lower lower operating limit, enabling the
(depending on wind operating limit! wind turbine to output at maximum!
conditions) Wind Turbine Wind Turbine + MG set
Figure. Image of maximizing renewable energy operation by introducing MG set 24Q&A
Q1. Topics of Okinawa’s Economy
1 Current Status and Future Forecast of Okinawa's Economy
The current state
Recently, there are increasing more difficult in the prefectural economy by the impacts of the novel coronavirus.
Trends in Main Economic Indicators of Okinawa Prefecture (%)
FY2019
Indicators
Apr. May Jun Jul Aug. Sep. Oct. Nov. Dec. Jan. Feb. Mar. FY
Sales by large-scale
3.8 3.3 3.9 4.2 2.6 8.7 -5.7 1.0 0.4 2.6 0.2 -6.3 1.5
retailers
No. of new car sold 3.4 6.0 -11.3 -6.6 8.2 12.8 -17.7 -5.6 -4.0 -7.3 -0.5 -15.5 -3.7
No. of incoming tourists 2.2 0.5 7.2 8.8 -1.9 1.0 0.2 0.5 1.0 -3.4 -23.5 -55.2 -5.3
Value of public works
-24.3 30.4 -18.1 94.2 -17.8 -12.5 29.8 28.2 94.7 1.3 -47.5 -11.7 4.3
contracts
New residential
-1.5 -38.4 -20.6 -16.0 25.5 10.7 -16.2 -0.8 -17.5 -37.4 -19.1 -18.4 -12.1
Construction starts
Total unemployment
2.5 2.7 3.0 2.8 2.9 3.2 2.8 2.5 2.5 3.0 3.1 2.9 2.8
rate
Job Opening Ratio 1.18 1.18 1.19 1.19 1.20 1.19 1.20 1.20 1.19 1.11 1.11 1.06 1.16
Note 1: The figures for ‘Sales by large-scale retailers’ are calculated on an all-store base. The values in March 2020 are preliminary figures.
Note 2: The figures for ‘Total unemployment rates’ are raw data, whereas The figures for ‘Job Opening Ratio’ are a seasonally adjusted value for the current month.
(Please note that the values for the fiscal year are both raw data.)
Source: Okinawa General Bureau, Okinawa Prefecture, Ryugin Research Institute, and others.
Prospect
The prefectural economy is expected to continue to be affected by the novel coronavirus. Future risk factors include
developments in the mainland and overseas economies (including prolonged effects of novel coronavirus and geopolitical risks).
25Q1. Topics of Okinawa’s Economy
2 Economic Growth of Okinawa Prefecture under the Okinawa Promotion Plan
With implementation of a variety of action plans under the Okinawa Prefectural government’s “Basic Plan of Okinawa 21st
Century Vision (Okinawa Promotion Plan)” which started in FY2012, the prefecture’s GDP posted growth rate increase of
outpacing the national average growth rate.
Recently, the prefectural economy continue to be affected by the novel coronavirus, but the demand for electricity is
expected to increase in the medium to long term because it's expected to grow the prefectural economy.
Prefectural GDP and National GDP
(billion yen)
FY2013 FY2014 FY2015 FY2016 FY2017 FY2018
Prefectural 4.2% -0.3% 3.2% 3.2% 3.1% 1.6%
GDP 3,892.3 3,879.1 4,004.2 4,132.0 4,260.4 4,330.4
National 2.6% -0.4% 1.3% 0.9% 1.9% 0.3%
GDP 512,534.7 510,704.0 517,223.3 521,963.0 532,070.3 533,645.5
Sources: “Prefectural Accounts for FY2016”, “Prefectural economic outlook for FY2019” and Cabinet Office “List of Statistical Tables” (Second Preliminary Data for the
October-to-December 2019 period)
Note : Prefectural GDP's for FY2017 and FY2018 are estimates. Figures in the upper row are growth rates on a Y to Y basis.
Basic Plan of Okinawa 21st Century Vision (Okinawa Promotion Plan)
In May 2012, the “Basic Plan of Okinawa 21st Century Vision (Okinawa Promotion Plan)” was formulated under the initiative by the Okinawa Prefectural
government (revised in May 2017).
Through the implementation of various measures that are developed based on this plan to take advantage of regional characteristics of Okinawa
Prefecture, gross production in Okinawa(nominal)in FY2021 is estimated to increase about 1.4 times compared with that in FY2010 to 5,100 billion yen.
26Q1. Topics of Okinawa’s Economy
3 Okinawa International Logistics Hub
Okinawa Prefecture is promoting the establishment of an international logistics hub through accumulating the industries at
the areas peripheral to airport and harbor where new business is to be developed through utilizing Okinawa international
logistics hub. In addition, Okinawa Prefecture is working hard to attract logistics companies from home and abroad.
Okinawa Prefecture is located in the center of the huge market of two
billion people.
Travel time required between Okinawa Prefecture and major cities in
Japan and Asia is about four hours.
Utilizing late-night cargo flights through 24-hour operation system at Naha
Airport.
Quick transportation through 24-hour customs clearance system.
(10 thousand tons) Cargo handling volume in Naha Airport
50 International cargo
International cargo
Domestic cargo
40 Domestic cargo
18 18 20 18
30 15 14 14 16
12
5
20
10 23 22 22 22 22 22 22 22 22 22 21
18 19
0
Source: A pamphlet titled “Okinawa International Logistics Hub” (prepared by the
International Logistics Promotion Division, Department of Commerce, Industry and
2006 2007 2008 2009 2010 2011 2012 2013 2014 2015 2016 2017 2018
(FY)
Labor and available on the website of the Okinawa Prefecture) * From October 2009, the cargo hub project was launched by ANA.
Source: Land, Infrastructure and Transportation Ministry
27Q1. Topics of Okinawa’s Economy
4 Aviation Industry Cluster
Aviation demand in Asia is expected to increase in the future and the total number of aircraft is expected to increase by 2.7x
in the next 20years.
Okinawa Prefecture, taking advantage of the characteristic of the center of Asia, is engaged in the aviation industry cluster
focused on MRO*.
MRO Japan started aircraft maintenance business at Naha Airport in January 2019.
* MRO : Maintenance, Repair, & Overhaul
MRO Japan Co., Ltd.
Established on June 2015 (Head Office: Naha City)
Businesses: Aircraft Maintenance, Repair, & Overhaul
Paid-in Capital: 1 billion yen
Shareholder composition:
ANA Holdings Inc. 45%
JAMCO Corporation. 25%
Mitsubishi Heavy Industries, Ltd. 20%
The Okinawa Development Finance Corporation. 2%
Bank of The Ryukyus, Ltd. 2%
The Bank of Okinawa, Ltd. 2%
The Okinawa Kaiho Bank, Ltd. 2%
The Okinawa Electric Power Company, Inc. 2%
Source: The Industrial Site Promotion Guide Book 2019-2020
28Q2. What is the Current State of U.S. Military Bases?
Outline of the U.S. military Forces
in Okinawa Principal electricity supply destination facilities *1
No. of Fasilities 33 Name Location *2 Area
Camp Gonsalves [ US Marine Corps ] Kunigamison, Higashison 36,590k㎡
Area 187,099km2 Okuma Rest Center [ US Air Forces ] Kunigamison 546k㎡
Iejima Auxiliary Air Base [ US Marine Corps ] Ieson 8,015k㎡
No. of employees working for the U.S. Yaedake Communication Site [ US Air Forces ] Motobucho, Nago-shi 37k㎡
Armed Forces in Okinawa: 8,919 Camp Schwab [ US Marine Corps ] Nago-shi, Ginozason 20,626k㎡
*As of the end of March 2018.
Sources ︓ Japan Ministry of Defense “US Forces and
Camp Hansen [ US Marine Corps ] Nago-shi, Ginozason, Onnason, Kincho 48,728k㎡
SDF Bases in Okinawa August 2019”, Military Base Kadena Ammunitions Storage Area [ shared use ]
Onnason, Uruma-shi, Okinawa-shi, Kadenacho,
Yomitanson 26,585k㎡
Affairs Division, Executive Office of the Governor,
Okinawa Prefecture Camp Courtney [ US Marine Corps ] Uruma-shi 1,339k㎡
The U.S. Armed Forces’ share of total Camp Mc Tureous [ US Marine Corps ] Uruma-shi 379k㎡
electricity demand(FY2019) Camp Shields [ shared use ] Okinawa-shi 700k㎡
Total Demand︓ Torii Station [ US Army ] Yomitanson 1,895k㎡
7,316 million kWh Kadena Airbase [ shared use ] Okinawa-shi, Kadenacho, Chatancho, Naha-shi 19,855k㎡
White Beach Naval Facility [ shared use ] Uruma-shi 1,568k㎡
Camp Kuwae [ shared use ] Chatancho 675k㎡
Camp Zukeran [ shared use ]
Uruma-shi, Okinawa-shi, Kitanakagusukuson,
Chatancho, Ginowan-shi 5,450k㎡
Futenma Airport [ US Marine Corps ] Ginowan-shi 4,759k㎡ *3
Facilities Expected to
Makiminato Service Areas [ US Marine Corps ] Urasoe-shi 2,694k㎡
Total Demand of
be Returned U.S. Armed
Naha port facilities [ shared use ] Naha-shi 559k㎡
1 - 3%* Forces *1 Professional use and large-demand customers
of the total demand (approx. 9%) *2 Areas where facilities exist on a cross-area basis
* Range in figures due to planned *3 Facilities south of Kadenacho are scheduled to be returned (Partial return applies to Camp Zukeran )
return of facilities includes partial return.
29Q3. What is the Current State of Promotion of Electrification?
Approach for the promotion and growth in the household sector
(1) OEPC started to offer the "Rikka Denka Lease“, a new lease service plan of the electrical appliance.
(2) OEPC will open "Membership Site" that is a new web service and introduce the point service in September 2020.
(3) Strengthening cooperation with local home appliance stores and housing equipment manufacturers, who are the main
players delivering value directly to customers.
◇ The ratio of all-electric houses to newly-built detached houses in FY2019 : 28.6%
Approach for sales promotion in the corporate sector
(1) Offering customers comprehensive proposals for electrification (air-conditioning systems, kitchens,
and water heaters) appropriate for their power usage.
(2) Strengthening of cooperation with sub-users including manufacturers, contractors, design offices, etc.
(3) Utilization of public subsidy system, etc.
(GWh) Trends of the Total Number and
Acquired demand and target (Houses) (%)
Penetration Rate of All-Electric Houses
400 50,000 6.0
330 5.7
(Target) 5.5
5.4
300 45,000 5.5
5.2 44,992
5.1
43,438
173 4.9 41,847
200 40,000 5.0
(Forecast) 40,313
140
38,385
100 89 35,000 4.5
36,226
53 155
(Target)
22
0 30,000 4.0
2016 2017 2018 2019 2020 2025 2014 2015 2016 2017 2018 2019
30Q4. What is the enrichment of electricity rate menus?
The electricity rate menu for all electrification
◆Ee Home Holiday ◆Ee Home Flat
Suitable for double-income households who use less Suitable for households of full-time housewives and senior
electricity on weekdays. citizens who use more electricity during the daytime on
weekdays.
23:00 23:00 23:00
Approx. 60% savings
Night time
time than meter-rate lighting Night time
Night Night time
11.18 yen/kwh 11.18 yen/kwh
Living time 11.18 yen/kwh
Approx. 60% savings than
Sat,Sun,
27.20 yen/kwh national All meter-rate lighting
Mon to Fri Lower than meter-rate holidays
etc. days
lighting
Daytime Living
Living time
Daytime
17:00 Summer 39.37 yen/kwh
time 7:00 27.20 yen/kwh 7:00 29.15 yen/kwh 7:00
Others 35.88 yen/kwh Higher than meter-rate
lighting
10:00
Good Value Plan au Denki
The plan that is more advantageous than meter-rate lighting by setting
the unit price to be the same as meter-rate lighting or cheaper.
1.13 yen/kWh lower
than meter-rate lighting
0.48 yen/kWh lower
Minimum charge than meter-rate lighting
402.40
This is a service for customers using au.
yen/month First-tier rate OEPC supplies electricity as before.
Third-tier rate
22.95 yen/kWh Second-tier rate
29.34 yen/kWh
28.01 yen/kWh The electricity tariff is equivalent to the electricity tariff
charged at the meter-rate lighting plan by OEPC.
10kWh 120kWh 300kWh The au WALLET points corresponding to up to 5% of
Electricity charges electricity tariff are returned.
31Q5. What are the efforts to fuel cost reduction?(1/2)
■ Efforts toward stable procurement of fuels and
reduction of fuel costs. ($/bbl) Trend in the CIF Customs Cleared Price of Oil
120.00
FY2018 Average
Price 72.14$/bbl FY2019 Average
Efficient operation of coal-fired plants by reducing consumption of fuel 100.00
FY2017 Average
Price 67.79$/bbl
oil and LNG 80.00 Price 57.05$/bbl
60.00
Making Ishikawa Thermal Power Plant the base of distributing fuel oil 40.00
to remote islands 20.00
2017.4 2017.7 2017.10 2018.1 2018.4 2018.7 2018.10 2019.1 2019.4 2019.7 2019.10 2019.11 2019.12 2020.1 2020.2 2020.3
($/t) Trend in the CIF Customs Cleared Price of Coal
Reduction of fuel costs through measures including purchasing 140.00
FY2017 Average
fuel oil on the spot market Price 102.71$/t FY2019 Average
Price 101.14$/t
120.00
100.00 FY2018 Average
Price 120.54$/t
Stable procurement through long-term coal purchase contracts 80.00
60.00
2017.4 2017.7 2017.10 2018.1 2018.4 2018.7 2018.10 2019.1 2019.4 2019.7 2019.10 2019.11 2019.12 2020.1 2020.2 2020.3
Continued use of sub-bituminous coals that are low in not only prices
but also transport costs Trend in the CIF Customs Cleared Price of LNG
($/t)
700.00
FY2019 Average
600.00 FY2017 Average Price 492.45$/t
Price 438.06$/t
Stable procurement through long-term LNG purchase contracts 500.00
FY2018 Average
400.00
Price 545.69$/t
300.00
200.00
2017.4 2017.7 2017.10 2018.1 2018.4 2018.7 2018.10 2019.1 2019.4 2019.7 2019.10 2019.11 2019.12 2020.1 2020.2 2020.3
Achieving stable fuel supply and pursuing cost reductions
32Q5. What are the efforts to fuel cost reduction?(2/2)
Efficient operation of coal-fired plants by reducing consumption of fuel oil and LNG.
* AFC=Automatic Frequency Control
○ Reduction of oil consumption by shifting AFC* that
oil-fired plants took charge of to LNG-fired plants.
○ A shift to coal-fired plants that have much lower power unit costs by reducing the volume of LNG.
(10,000 kl) Trend in Fuel Oil Consumption by Main Island (10,000 t) Trend in LNG Purchase Volumes
45 After FY2017, LNG purchase volume will be about 240,000
25
to 270,000 tons a year for a certain period of time.
40
20
Reduction of fuel oil in the main island by a 35
shift from oil to LNG through measures
including AFC operation by LNG plants. 30
15
25
20
10
15
10
5
5
0 0
2012 2013 2014 2015 2016 2017 2018 2019 (FY) 2012 2013 2014 2015 2016 2017 2018 2019 ・・ 20XX (FY)
33Q6. What are the efforts to reduce CO2 emissions?(1/3)
1 Efforts in electricity business
Introducing hydro or nuclear power is difficult in Okinawa Prefecture due to reasons including the region’s geological and
geographic characteristics and constraints on the scale of demand Dependency on fossil fuels (oil, coal, etc.)
OEPC commenced operation of Yoshinoura Thermal Power Plants, which are fueled by LNG with low CO2 emissions, in
November 2012.
OEPC efforts to CO2 emissions reductions in cooperation with the Electricity Business Council for a Low-Carbon Society.
[ Key measures against global warming ]
Stable operation of Yoshinoura Thermal Power Plants, which are
fueled by LNG Improvement of efficiency of energy use
Use of renewable energy (e.g. mixed combustion of woody
biomass fuel, Tiltable wind power generators) Promotion of energy-saving and CO2 saving activities
Trends of CO2 emission factors Chart: Comparison of CO2 Emission Volumes by Fuel Type
CO2 *1 CO2 *2
About 16% reduction
Emission Emission
0.938 0.858 Fuel Volume Per Volume Per
0.816
0.802 0.799
0.786 0.786 Type Unit vs. vs. kWh vs. vs.
0.816 0.799 Heat Value Coal Oil [kg- Coal Oil
0.789 0.772
0.763 0.769
[g-CO2/MJ] CO2/kWh]
▲ Base emission factors*1 × Adjusted emission factors*1,2
Unit: kg-CO2/kWh Coal 90.6 1.00 1.27 0.84 1.00 1.20
〜
〜
*3
2005 2013 2014 2015 2016 2017 2018 Oil 71.5 0.79 1.00 0.70 0.84 1.00
Yoshinoura Thermal Power Plant Generator No. 2 start of operations
LNG 49.5 0.55 0.69 0.38 0.45 0.54
Note 1: Electricity sales volume and CO2 emission factors related to electricity retailers
(the main island of Okinawa) in and after FY2016 due to the full liberalization of *1 The values of the Enforcement Order of the Act on Promotion of Global Warming
the electricity market. Figures in and before FY2015 are for former general Countermeasures. (Convert the CO2 emission factors Kg-C/MJ to g-CO2/MJ)
electricity utilities (main and remote islands). *2 Calculated using actual value of OEPC’s Thermal Efficiency at Generation End at FY2018.
Note 2: Adjusted emission factors reflecting adjustments related to the feed-in tariff *3 Oil comparisons were based on type C heavy oil.
system and other factors. 34Q6. What are the efforts to reduce CO2 emissions?(2/3)
OEPC efforts to mix combustion of wood biomass fuels at coal-fired thermal power plants.*1
In order to promote the use of renewable energy, the decision was made to introduce it at the Kin
thermal power plant.*2
*1 Gushikawa Thermal Power Plant : from March 2010.
*2 Kin Thermal Power Plant : scheduled to start mixed combustion in March 2021.
It uses Woody pellets made from construction wastes that have been incinerated in the prefecture.
It contributes to the reduction of CO2 emissions in the prefecture by reducing the consumption of coal as fuel
while contributing to the promotion of recycling construction wastes.
Wood biomass consumption : approx. 30,000 t/year*
CO2 reduction: approx. 40,000 t/year* (*Total of Gushikawa and Kin Thermal Power Plants)
Amount of possible mixed combustion : approx. 3% (weight ratio)
Wood biomass (pellets) Wood biomass distribution facility
Four storage silos Generator
No.1 / 2
Conveyor Coal
Coal pulverizer Boiler
bunker
Receiving
hopper
Coal
Mixing
Woody pellets made from Coal yard
construction wastes
35Q6. What are the efforts to reduce CO2 emissions?(3/3)
2 Efforts in OEPC Group
Through the gas supply business, the OEPC Group is working to shift customers’ energy sources from heavy oil to LNG,
which is low in CO2 emissions.
In the overseas business, the OEPC Group contributes to promoting the wide spread use of renewable energy facilities in
Pacific island states with high dependency on fossil fuels similar to Okinawa.
The OEPC Group will make all-out efforts to reduce CO2 emissions in a comprehensive manner.
[ Efforts in gas supply business ] [ Efforts in overseas business ]
Orion Breweries, Ltd. Delivery of tiltable wind power generators to Tonga.
• Orion Breweries became the first brewing company in • Progressive Energy Corporation (PEC) received an order for ODA
Okinawa to shift its fuels from heavy oil to natural gas. project involving the Kingdom of Tonga.
• Introduction of natural gas is expected to reduce CO2 • PEC signed a contract with Tonga Power Limited for five tiltable
emissions by 1,500t annually. wind power generators.
• On June 2019, PEC completed constructions of five tiltable wind
power generators, and handed over them to the Kingdom of Tonga.
LNG satellite facilities Tiltable wind power generators at the Kingdom of Tonga.
36Q7. Support for TCFD Recommendations
In September 2019, Expressing to support the Recommendations adopted by the Task Force on
Climate-related Financial Disclosures(TCFD).
At the same time, deciding to participate in TCFD consortium.
The composition of electric power source is highly reliant on fossil fuel, as developing nuclear or hydroelectric power
generation is difficult in Okinawa due to the reasons of geographic condition and the small scale of demand.
Under such conditions, we have been tackling with the issue of global warming and with the reduction of
environmental load based on the “Okiden Groupʻs Policy on the Environment”.
Also, through CSR reports and environmental action reports, we have been endeavoring to disclose information on
environmental, social and governance initiatives(ESG) .
In recognition of the fact that our business activities are significantly related to the issue of global environment, we
agree with the purpose of the TCFD recommendations, which is “analyzing the risks and opportunities related to
climate change that affect business and promoting climate-related financial disclosures”.
We will continue to enhance information disclosure on climate change, improve corporate value, and contribute to the
realization of sustainable society.
At present, OEPC are considering about "Governance" and "Risks and Opportunities". Scenario analysis will be
progressively disclosed by 2022.
TCFD︓Task Force on Climate-related Financial Disclosures
This task force was established by the Financial Stability Board (FSB), which is an international agency that has central
banks, financial regulatory authorities and other organizations from major countries as members. In June 2017, a proposal
was published regarding the ideal disclosure of information on climate-related risks and opportunities by companies.
TCFD Consortium ︓
TCFD Consortium consists of companies and financial institutions supporting TCFD recommendations, where these
organizations work together through discussing a path to effective disclosure by companies and adequate utilization of
disclosed information in investment decisions by financial institutions. Established on May 27, 2019 37Q8. The Fuel Cost Adjustment System
The fuel cost adjustment system was introduced for the purpose of clarifying the “internal factors” such as the results of
efforts to promote management efficiency at electric power companies and reflecting “external factors” onto electricity
rates such as exchange rates and oil and coal and LNG prices that alter the economic situation.
[ Range of fuel cost adjustment ] [ Conceptual drawing of the fuel cost adjustment system ]
E.g. The average fuel price during the period between December and February of the
○We will calculate the average fuel price based on the prices following year will be applied to fuel cost adjustment for the electricity charge for
of crude oil, coal and LNG on the trade statistics during the May in the following year.
The average fuel price during the period between January and March will be
period between five months and three months prior to the applied to fuel cost adjustment for the electricity charge for June in the same year.
fuel cost adjustment, and electricity charge will be 3-month average fuel price 2-month time-lag
automatically adjusted each month by comparing the above Nov. Dec. Jan. Feb. Mar. Apr. May Jun.
price with the standard fuel price at the time of electricity
rate revision. Fuel price Official announcement of trade
○The maximum level of fuel cost adjustment will be 50%.
○There will be no lower adjustment limit.
Fuel cost adjustment Fuel cost will be adjusted each month.
[ Trend of Average Fuel Price and Standard Fuel Price
(Since July 2006) ]
* Electricity charge for May will be applied to the electricity use starting as early as April 1.
(Yen/kl)
40,000
Jul. 2006 Sep. 2008 基準燃料価格
35,000 Revision Revision (present)
平均燃料価格
Standard Fuel Price (Yen/kl) 18,700 25,100
30,000
27,100
25,000
22,400
20,000
15,000
* September 2008 Revision * From May 2009, the fuel cost adjusted unit price was revised each month
10,000
38Q9. What is the approval that it's possible to engage in
electricity transmission and distribution on concurrent?
After April 2020 when the amended Electricity Business Act comes into effect, the general electricity transmission and
distribution utilities must not engage in electricity retail or electricity generation on concurrent business. (Restrictions on
Concurrent Business)
As an exception to the restriction on Concurrent Business, OEPC became the “the approved general electricity
transmission and distribution utility” which can operate power retail business and power generation business, and this
means that OEPC can continue maintaining the integrated system for power transmission and distribution.
On the other hand, OEPC implemented the organizational revision to respond conduct regulations aimed at ensuring
neutrality of the transmission/distribution sector.
Reasons for exceptions to Restriction on Concurrent Business
There is a particularly high need for flexible power supply operation because OEPC's power grid is small-scale power
system and independent from the mainland.
There is a particularly high need for the transmission and distribution, retail and power generation divisions to work
together in disaster response.
Board of Directors
Conduct regulations
Transmission and Distribution Division Power System Management
Prohibition of use/provision of Department
information for other purposes Branches in the main island
Distribution Department
Prohibition of discriminatory treatment
After April 1, 2020
Prohibition of competitive inhibition acts
Establishment of appropriate information Transmission and Distribution
Board of Directors Administration Department
management system, etc.
Transmission and Distribution Division Power System Management
Department
Further ensuring neutrality of the transmission/distribution sector by establishing Distribution Department
Transmission and Distribution Administration Department in Transmission and
Branches in the main island
Distribution Division, and transferring each branches in the main island.
39Q10. What are the Special Tax Measures?
We consider that special taxation measures are necessary for promoting business in Okinawa Prefecture and improving
the lives of Okinawa residents on the grounds that disadvantages inherent in Okinawa’s electricity business have
remained unchanged. For example, there are many small and isolated systems and Okinawa is dependent on thermal
power.
The amount of tax exemption based on the special taxation measures is deducted from the cost of electricity charge.
Currently Applied Special Tax Measures
Exemption from the Oil and Coal Tax Relating to
Preferential Measure for Standard Taxable Values
Specific Coal, etc. (Coal and LNG) Used for Power
Relating to Fixed Property Tax
Generation in Okinawa
(1) Exemption from the Oil and Coal Tax for coal
Details Alleviation to 2/3 of Standard Taxable Values
(2) Exemption from the Oil and Coal Tax for LNG
(1) October 1, 2003 – March 31, 2022
April 1, 1982 - March 31, 2022 * Extended for 2 years from April 1, 2020
Period
* Extended for 2 years from April 1, 2020 (2) April 1, 2012 – March 31, 2022
* Extended for 2 years from April 1, 2020
Special Measures Law for the Promotion of Okinawa
Basic Supplementary Provisions of the Local Tax Law
(Article 65.2)
Law (Article 15.5)
Special Taxation Measures Law (Article 90.4.3.1)
Revision of the Act on the Special Measures for the Promotion and Value of Tax Alleviation Due to the Special
Development of Okinawa Measures
The Act on the Special Measures for the Promotion and Development of Okinawa The value of the alleviation measures in
was revised in March 2012, and the revised law came into effect on April 1, 2012. FY2019 : about 3.4 billion yen.
Under the revised law, etc., OEPC receives favorable treatment based on The value of the alleviation measures for
“Preferential Measure for Standard Taxable Values Relating to Fixed Property FY2020 : expected to be 3.4 billion yen.
Tax” and “Exemption from the Oil and Coal Tax Relating to Specific Coal, etc.
(Coal and LNG) Used for Power Generation in Okinawa”.
40You can also read