(BCPT) BMO Commercial Property Trust Ltd - 30 June 2020 CM021629 - BMO Global ...
←
→
Page content transcription
If your browser does not render page correctly, please read the page content below

30 June 2020
                                                          CM021629

BMO Commercial
                          Richard Kirby
Property Trust Ltd
                          Richard Kirby
     (BCPT)          Director, Property Funds

                         Matthew Howard
                     Director, Property Funds

                          Scott Macrae
                        Investment Trusts

                           Peter Taylor
                        Investment Trusts

                                                Alhambra House, Glasgow
Investment risks
The value of directly held property reflects the opinion of valuers and is reviewed periodically. These assets
can also be illiquid and significant or persistent redemptions may require the manager to sell properties at a
lower market value adversely affecting the value of your investment.
The value of investments and income derived from them can go down as well as up as a result of market
movements and investors may get back less than the original amount invested.
Estimates and forecasts are provided for illustrative purposes only; they are not a guarantee of future
performance and should not be relied upon for any investment decisions. Estimates are based on
assumptions and subject to change without notice.
2
Annual Report - headline numbers

         Property Market Overview - post March 2020
Agenda
         BMO Commercial Property Trust Performance in 2020

         UK Property Market - looking forward

                                                             3
BMO Commercial Property Trust
Annual Report Key Financial Data

Past performance should not be seen as an indication of
future performance.

Source: BCPT Annual Report & Consolidated Accounts 2019

                                                          4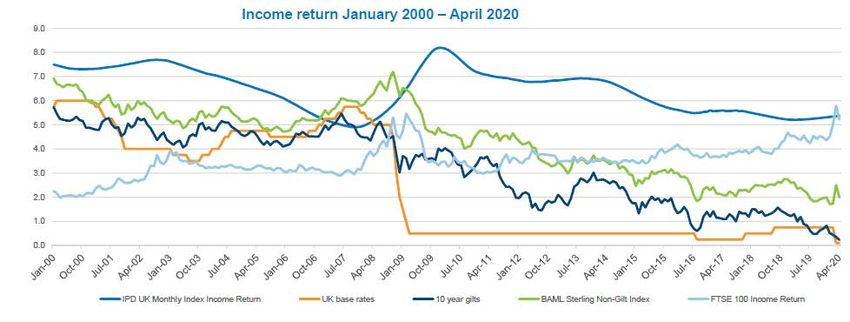
BMO Commercial Property Trust
Annual Report Key Financial Data

Past performance should not be seen as an indication of future performance.
Source: BCPT Annual Report & Consolidated Accounts 2019

                                                                              5
BMO Commercial Property Trust
Annual Report Key Financial Data

Past performance should not be seen as an indication of future performance.
Source: BCPT Annual Report & Consolidated Accounts 2019

                                                                              6
Property Market Overview – post March 2020

                                             7
Headlines
Q1 showed some promise, Covid has delivered a different reality
     Despite positive sentiment towards much of the market outside of retail around the turn of the year, the arrival
     of Covid 19 has delivered unprecedented challenges for UK Real Estate.

   UK transaction volume was                               Can’t pay, won’t pay –                                June quarterly rent likely to be even
   an above average £15bn in                              rent collection rates (21                              more of a pinch point, cash positions
            Q1 2020                                       days) 57% total - 39% in                               will worsen
                                                            retail, 31% in leisure

    CBRE reported that                                           UK property funds                               Travelodge set to launch CVA in effort
    UK prime industrial                                          suspend as valuations hit                               to end rent stand-off
   rents rose by 1.9% in                                         with ‘material uncertainty’
            Q1

The UK [regional] office                           UK REITs lose £20bn of                                        Asked to predict when capital values are likely to
vacancy rate is at its lowest                      market value’ (mid-March)                                     return to pre-COVID-19 levels, none predict
level in 15 years and well                                                                                       recovery within the next two years. “Ex-London
below the long-term                                   Punishing time for shares in student                       we do not expect Retail to ever get back to its
average.                                              property owners …                                          previous highs.”

 Sources: Property Data June 2020, CBRE Prime Rents & Yields Q1 2020, Avison Young Nine Report Q1 2020, M&G Press Release January 2020, Savills, IPE March 2020, EG 18th March 2020,
 Knight Frank April, 2020 Citywire, June 2020, IPF Consensus Forecasts May 2020, FT JuBigne 2020

                                                                                                                                                                                       8
Performance deteriorated sharply in March, driven by falling
capital values at the All Property level
   Quarterly total returns are now negative. Q1 2020 was the sixth consecutive quarter of negative capital growth with
   yields expanding in the main sectors. Rents were trending slightly negative hit by retail weakness. Income underpins
   performance. March end timing is key. Monthly data post period points to further capital falls ….

                                                                   Three- Month All-Property Total Returns per cent
       4.0
                                                        2.9
       3.0                     2.3          2.5
                   2.2
                                                                     1.9         1.7
       2.0                                                                                    1.4
                                                                                                          0.8                    0.5     0.3
                                                                                                                    0.4                          0.0      -   1.4
       1.0

       0.0

    - 1.0

    - 2.0

    - 3.0
                Q1 17        Q2 17       Q3 17        Q4 17       Q1 18        Q2 18       Q3 18        Q4 18       Q1 19        Q2 19   Q3 19    Q4 19        Q1 20

                                                                     Income Return         Capital Growth         Total Return

Past performance should not be seen as an indication of future performance.
Sources: MSCI UK Quarterly Property Digest (Standing Investments) March 2020, MSCI UK Monthly Property Digest March 2020
The MSCI performance data as quoted in this document is calculated net of operating costs

                                                                                                                                                                       9
Dislocation. Industrials lead the way. Retail under continued pressure

   South East Industrial & Logistics assets have been the strongest performers over the year delivering 7.0%. City and
   Provincial Offices also performed well, both delivering 5.0%. Shopping Centres are the laggards. Growing concern for
   Alternatives, Leisure and Hospitality …..

                                                      12 month total return by segment - March 2020 per cent
 15.0

 10.0

   5.0

   0.0

  -5.0

 -10.0

 -15.0

 -20.0

 -25.0
           Standard       Standard         Shopping       Retail    Office - City   Office - West Office - Rest Office - Rest of Industrial -   Industrial -   Alternatives   All-Property
         Retail - South Retail - Rest of    Centre      Warehouse                    End & Mid of South East          UK         South East     Rest of UK
             East             UK                                                        Town

                                           Income Return            Market Value Rental Growth                  Equivalent Yield Impact               Total Return

Past performance should not be seen as an indication of future performance.
Source: MSCI UK Monthly Property Digest March 2020

                                                                                                                                                                                             10
Monthly data post the March Quarter points to a pickup in the
pace of capital falls
The impact of the Covid 19 lockdown and the lack of transaction evidence around the quarter date demanded the
imposition of Material Uncertainty clauses in valuations across all sectors. Some deals have now completed at
discounted levels, and with sentiment uncertain, we have seen values start to move.
• Not all sectors have been impacted in the same
manner.
• Retail remains severely challenged with rent
collection under significant pressure.
• The expected deterioration in the leisure, F&B,
student and hospitality sectors has started to feed
through into the overall numbers. This is reflected in
the aggregated ‘Alternatives’ performance, with the
strongly negative performance of some of these
groups shielded by more favourable Alternative
subsectors.
• Long Income, Industrials & Logistics, Healthcare and
Residential Build To Rent have remained relatively
resilient with continued, albeit reduced, deal flow.
• Frequency and a comparable method of valuation has
a smoothing effect on returns.
Past performance should not be seen as an indication of future performance.
Sources: MSCI UK Monthly Property Digest May 2020
The MSCI performance data as quoted in this document is calculated net of operating costs
11COVID-19 Affecting both the occupier and investment markets
Retail, leisure and hospitality have been the most severely affected in terms of both rent transaction volumes and
collection, with industrials and offices relatively resilient. Rent collection could come under more pressure in the June
quarter. Valuers will be tasked with valuing assets before collection statistic become fully evident.
Rent Collection Rates - March Quarter - per cent
100
90
80
70
60
50
40
30
20
10
0
Retail Offices Industrial Residential Mixed All 2020 All 2019
Due Date +7 days
Sources: Remit Consulting April 2020, Property Data June 2020 £m Left hand scale, Number right hand scale, as at 16th June 2020.
12UK property continues to offer an attractive premium over fixed income
The yield margin above gilts is now at historic highs though the market looks poorer value against UK Equities. Lower for
longer forecasts imply continued support for pricing but risks to revenue from Coronavirus disruption should not be under
estimated. Almost uniquely, at present, implied yield is not the same as income delivered. Dividends from both UK
equities and Listed real estate are under pressure.
Income return January 2000 to April 2020
Past performance should not be seen as an indication of future performance.
Source: MSCI UK Property Index, Datastream as at May 2020. FTSE International Limited (“FTSE”) © FTSE 2020.
13BMO Commercial Property Trust Classification: only to be shown if not public
A diversified balanced UK
portfolio investing in prime
property in core locations
One Cathedral Square, Bristol
Comprehensively refurbished prime regional city centre
office let to University of Bristol and Dyson TechnologiesBMO Commercial Property Trust
Key information
Objective
To provide shareholders with an attractive level of income together with the potential for capital and income growth from investing in a
diversified UK Commercial portfolio
Portfolio statistics Portfolio characteristics
• Launched: 18/3/2005 • Balanced UK portfolio
• NAV (per share) at launch: 97.0p • 36 assets (core & core-plus) including Offices, Retail, Industrial and
• IFRS NAV” per share at 31 March 2020: 124.3p (-5.0%) Alternative sectors
• Trading level: 74.5p (31/03/20) • Institutional sustainable locations
• Discount: 40.1 per cent (31/03/20) • Average lease length: 6.3 years (assuming all breaks exercised)
• Portfolio Valuation: £1,294.8m (31/03/20) • Portfolio void rate: 3.2% of ERV
• Target Dividend: Currently suspended
• Current Dividend yield: 0% Some of our buildings
Manager information
• Fund Manager: Richard Kirby, MRICS
• Deputy Fund Manager: Matthew Howard, MRICS
• Independent Non-Executive Board
The Hive, Estuary One Cathedral Square, Newbury Retail Park,
Business Park, Liverpool Bristol Berkshire
15Performance Review
Annualised Total Return
Gross performance
10.00
8.52 8.86
8.55 8.01
8.00
5.91
6.00 5.13
4.63
4.00
% 2.37
2.00
0.45
0.00
-2.00
-4.00 -2.91
1 Year 3 Years 5 Years 7 Years 10 Years
Fund Benchmark*
* Benchmark: Estimated IPD Quarterly Universe
Returns are shown in GBP, gross of management fees and corporate expenses. Returns over one year are annualised. Inception date: June 2005
Year 12m - March 2016 12m - March 2017 12m - March 2018 12m - March 2019 12m - March 2020
(%) (%) (%) (%) (%)
BCPT Total return 12.2 6.7 8.4 2.0 -2.9
Benchmark 11.3 4.6 10.1 4.6 -0.5
Past performance should not be seen as an indication of future performance.
The performance figures are shown gross of fees. The effect of fees or costs will be to lower the figures shown.
Source: BMO Real Estate Partners as at 31 March 2020
16BMO Commercial Property Trust
Classification: only to be shown if not public
Borrowings and Corporate
• Gearing
• Board composition
− Net Gearing 22.6% (31 March 2020)
− John Wythe appointed 11 September 2018. Long career with
Prudential Property Investment, now M&G Real Estate. He is
• Long-term borrowings currently Chairman of the Trustees of the Portman Estate
− Debt drawn down from Legal & General: £260m and a 10-year − Linda Wilding appointed 3 June 2019 – ex MD private equity
term maturing 31 December 2024 division of Mercury Asset Management
− Interest rate fixed at an all-in rate of 3.32% − Chris Russell, David Preston, Peter Cornell all retired from the
− A long-term loan on attractive terms Board 30 May 2019
− Martin Moore appointed Chairman 3 June 2019
− Company now complies with the Hampton Alexander
• Barclays Bank PLC financing arrangements recommendation
− Current expiry date of £50m term loan facility and additional
revolving credit facility £50m is 21 June 2021.
• UK REIT status
− Negotiations with regard to an extension of this loan and
facility are well advanced. − Company converted to the UK REIT regime 3 June 2019
• Total borrowings
− The current drawn down borrowings amount to £310 million
− The weighted average interest rate on the Group's total
current borrowings is 3.3%
• Management fees
− Revised arrangement from 1 January 2017. Performance fee
removed. Base fee 0.55% pa of gross assets (reduced to
0.525% on assets between £1.5 - £2.0 billion and 0.5% in Prime Four – Unit 3 11-12 Lochside Place
Aberdeen Edinburgh Park
excess of £2 billion)
17BMO Commercial Property Trust
Dividend Payments
• March 2020 monthly dividend payment of 0.5 pence per ordinary share was paid to shareholders on 31 March
2020.
• On the 16 April 2020 the Board announced that due to the significant uncertainty and the expected impact of
COVID-19 on future rental receipts, particularly in relation to the Group's retail and leisure tenants, the
temporary suspension of its future monthly dividend payments in order to strengthen cash reserves and protect
the long-term value of the Group.
• The Board currently intends to re-introduce distributions when conditions improve and believe that the portfolio
is well positioned to begin its recovery once the temporary restrictions surrounding COVID-19 are lifted.
• It is the intention of the Board to provide further Group updates as the situation evolves.
• Key to informing any decision is the actual rent collection of the Group.
18BMO Commercial Property Trust
Corporate Borrowings and Covenants
• The Group has approximately £20 million of available cash and an undrawn revolving credit facility
of £50 million.
• The Group's long-term debt with L&G and loan facility with Barclays do not need to be refinanced
until December 2024 and June 2021 respectively. As at 31 March 2020, the Group’s loan to value
(‘LTV’) was 22.6 per cent.
• There have been no covenant breaches.
• The Group continues to comfortably meet its covenants on the £260 million long-term loan with
L&G at the current time.
• There is also significant headroom on the loan to value covenant of the £50 million loan facility with
Barclays, which relates to the St Christopher’s Place assets. The interest cover test is expected to
become more challenging given the tenant base has been closed during lockdown. This particular
covenant test has been discussed with Barclays who are supportive.
19Portfolio key features
Classification: only to be shown if not public
Our buildings
Scotland Offices Industrial Alternatives/Lifestyle Retail
- 11-12 Lochside Place, Edinburgh Park (O)
- Alhambra House, Glasgow (O)
- Prime Four Business Park, Aberdeen (O)
- B&Q, East Kilbride (R)
North West Midlands
- Revolution Park, Chorley, Lancashire (I) - Sears Retail Park, Solihull (R)
- Dane Street, Rochdale (R) - Oakenshaw Road, Solihull (R)
- Estuary Business Park, Liverpool (I) - Plot 4 DIRFT, Daventry (I)
- G Park, Liverpool (A/L) - Hams Hall, National Dist. Centre, Birmingham (I)
- 82 King Street, Manchester (O)
South West South East
- One Cathedral Square (O) - Ozalid Works, Colchester (I)
- Cowdray Centre, Colchester (O)
- Stockley Park, Uxbridge (O)
South East -16 Conduit Street, London, W1 (O)
- The Broadway, Wimbledon (A/L)
- Newbury Retail Park (R) - 7 Birchin Lane, London EC3 (O)
- Thames Valley Park 1, Reading (O) - 2-4 King Street, London, SW1 (O)
- Winchester University, Burma Road (A/L) - St Christopher’s Place, London W1 (R/O/A/L)
- Strategic Park, Southampton (I) - Cassini House, London, SW1 (O)
- Watchmoor Park, Camberley (O) - 17a Curzon Street, London W1 (O)
- Affinity Point, Camberley (I)
- The Leonardo Building, Crawley, (O)
Source: BMO Global Asset Management, BMO Real Estate Partners as at 31 March 2020
20Portfolio key features
Classification: only to be shown if not public
Sector and regional breakdown
The portfolio is well diversified by sector and geography, with a relatively high weighting to the South East
Segment split Geographical split
Other City
9.9% St Retail - South
East Scotland 1.6%
18.7% 13.1%
Industrial - Rest
of UK
13.3%
St Retail - Rest North West
of UK 11.9% West End
2.4% 36.8%
Industrial -
South East Retail
4.2% Warehouse
9.7% West Midlands
8.8%
Offices - City
1.6%
East Midlands
Offices - Rest of 2.0%
UK Eastern
17.4% Offices - West 2.0%
End South West South East
Offices - South East
16.1% 2.5% 21.4%
6.7%
>
>
No exposure to shopping centres
No exposure to Wales or North East
St. Christopher’s Place and Wimbledon
Limited exposure to City of London
Source: BMO Real Estate Partners as at 31 March 2020
21Portfolio key features
Classification: only to be shown if not public
Specific risk
36 properties externally valued £1,294.8m (31/03/2020)
Top 10 Properties by value Sector Value
London W1, St Christopher's Place Estate Retail >£250m No.1 property by value
London SW1, Cassini House, 57-59 St James' St Offices >£100m St Christopher’s Place: 23%
Newbury, Newbury Retail Park Retail Whse £50m-£75m
London SW19, Wimbledon Broadway Retail £50m-£75m
Solihull, Sears Retail Park, Marshall Lake Rd Retail Whse £25m-£50m
Crawley, The Leonardo Building, Manor Royal Offices £25m-£50m
Winchester, Student Accommodation, Burma Road Other £25m-£50m
Manchester, 82 King Street Offices £25m-£50m
Aberdeen, Unit 2 Prime Four Business Park Offices £25m-£50m
Aberdeen, Unit 1 Prime Four Business Park Offices £25m-£50m
Top 10 Tenants by rent paid Risk %
Artemis Investment Management LLP Negligible 4.2%
Apache North Sea Limited Low 4.0%
No.1 tenant by rent paid
GB Gas Holdings Limited Low 3.9%
Artemis Investment Management LLP: 4.2%
CNOOC Petroleum Europe Limited Low 3.9%
Kimberly-Clark Limited Low 3.7%
Virgin Atlantic Limited Low 3.7%
JP Morgan Chase Bank Limited Unscored 3.0%
Transocean Drilling U.K. Limited Low Medium 2.8%
University of Winchester Negligible 2.8%
Mothercare UK Limited* Maximum 2.6% Top 10 tenant at ‘maximum’ risk
Total 34.6% Mothercare UK Limited: 2.6%
*has a rental guarantee from a Mothercare company not in administration
Source: BMO Real Estate Partners as at 31 March 2020
22Portfolio key features
Void Profile
Vacant area: 3.2% by ERV
Property Area (sq. ft.) ERV (£)
Camberley
Camberley, Watchmoor Park 24,398 458,000 We currently have 7,000 sq.
ft. under offer to an F&B
Newbury, Newbury Retail Park 15,300 400,000 business on a 10 year term at
a rent above ERV. This lease
Colchester, The Cowdray Centre, Cowdray Ave. 60,402 349,900 has progressed during
lockdown.
Liverpool, Units 2 & 4, Estuary Business Park 47,500 297,000
London W1, 17A Curzon Street 3,261 290,500
London W1, St Christopher's Place 3,173 280,300
Solihull, Oakenshaw Road 7,735 162,000
Newbury
London SW1, Cassini House, 57-59 St James' St 7 CPS 35,000 A 5,850 sq. ft. vacant unit
currently under offer to a well
Manchester, 82 King Street 1,416 7,175 known retailer.
London EC3, 7 Birchin Lane 1,105 3,720
Total 164,297 2,283,595
Source: BMO Real Estate Partners as at 31 March 2020
23Asset Management
Recent Activity
Cassini House, London SW1
We have recently completed a lease to let Mitsui Fudosan who took the 6th floor at £106 per sq.
ft., setting a new rental high for this prime St James asset. The property is now fully let.
Newbury Retail Park
In early June 2020 we completed the landlord’s works and handed the unit over to Lidl to
commence their internal fit out. The new store is due to open later this summer. In February
2020 Deichmann Shoes took occupation of part of the former Mothercare unit on a 10 year
lease.
Sears Retail Park, Solihull
Construction works for the new M&S general store commenced earlier this year. Through
careful planning and observing government guidelines the contractors were able to make
continued progress during the lockdown. We are now only 6 weeks behind program and aim
to hand the store over to M&S in Q1 2021.
24Asset Management
Recent Activity
DIRFT
The logistics property is let to Mothercare with a global company guarantee. The tenant has
recently sub-let to Clipper logistics on a short-term basis to service an NHS contract during the
pandemic.
Hurricane 47, Speke
The newly built property remains in marketing but we have recently let the yard on a short term
licence at a peppercorn rent to Bidfood who are providing care packs to vulnerable people
during the pandemic in association with the Department for Environment, Food and Rural
Affairs.
Colchester, Ozalid Works
During 2019 we sold the first phase of a vacant plot of land to Persimmon Homes for c. £6.0m.
The sale of the second phase will complete at the end of July for c. £5.5m.
25Asset Management
Rent Collection
The Company has collected 78% of rent due over
quarter 2, with a further 1% of monthly payment due
imminently.
BCPT Rent Collection - Overall
The remaining 21% accounts for rent not paid in the
quarter. The majority of this will be deferred rent to be 20.7% Rent Received
paid at a later date with a smaller portion of temporary
rent free concessions. Within the 21% there are a
number of outstanding agreements relating to rent 0.8% Outstanding Monthly
concessions which we expect to be agreed during Q3. Rent Payments
Rent Deferment/Rent
The Company has collected 78% of rent due over Free/Outstanding
quarter 2, St Christopher’s Place has skewed the overall Agreement
78.5%
collection downwards with 31% of Q2 rents being
received to date. Owing to the leisure/food & beverage
nature of a large proportion of the tenants we have
intentionally delayed agreements until these businesses
re-open in order to then agree the appropriate level of
concession. Therefore we expect much of Q2
outstanding rent to be received during Q3.
26Asset Management
Rent Collection by Sector
St. Christopher’s Place Retail Warehouse
20.0%
31.7%
Rent Received
Rent Received
6.2% Outstanding Monthly Rent
Rent Deferment/Rent Payments
Free/Outstanding
Agreement
68.3% Rent Deferment/Rent
Free/Outstanding
Agreement
73.9%
Industrial Offices
7.3% 5.4%
Rent Received
Rent Received
Rent Deferment/Rent
Free/Outstanding
Rent Deferment/Rent
Agreement
Free/Outstanding
Agreement
92.7%
94.6%
Source: BMO Real Estate Partners, June 2020
27Responsible Investing (‘RI’)
Classification: only to be shown if not public
ESG considerations at BMO REP
Corporate Framework Case Studies
• BCPT Board ultimately overseas ESG framework London W1, 71-77 Wigmore Street
• Reference and support from BMO GAM RI team Refurbishment of mixed-use asset at SCP
• Comprehensive energy strategy including real
• BMO REP ESG Committee convenes on quarterly basis time consumption display for occupiers
to review legislative drivers and industry sentiment to • BREEAM rating of Very Good
ensure relevance of policy and direction • Green roof to promote biodiversity
• ESG culture integrated across all business sectors and
included in personal objectives London SW1, Cassini House
Refurbishment of prime West End offices
• Property level ESG appraisals reviewed annually and • Extensive use of durable, low maintenance and
incorporated into individual asset level business plans locally sourced materials
• EPC improvement from E to high C
The Company’s latest ESG report published • Enhanced cycling facilities through additional
racks, lockers, showers and repair station
• Describes the Company’s RPI
strategy and priorities
Edinburgh, Nevis House
• Presents key ESG performance Shell and core head office refurbishment
data for the reporting year and
future targets
• EPC improvement from E to B+
• BREEAM certification to Very Good standard
• Provides an overview of key ESG • Renewable electricity from roof mounted solar PV
risks facing the property portfolio
• Plug & Play electrical distribution system for
future flexibility
https://www.bmogam.com/commercial-property-trust
28Responsible Investing (‘RI’)
Classification: only to be shown if not public
Delivering sustainable assets today and for the future
Our approach is focussed on managing ESG risks and opportunities, about engaging and collaborating with our stakeholders,
about understanding value drivers and ensuring that asset worth is preserved and enhanced
> Increased productivity
>
More liquid
Less risk of lease break
• Transactionable • Quality of life / wellbeing
• Enhanced lettability • Improved company image
• Removal of ‘brown – environment/social
discounting’ issues
• Lower operational costs
RESPONSIBLE
INVESTMENT
>
Lower yields / higher prices
> Higher rents
• Reduced capital
expenditure • Increased occupier
demand
• Less regulatory risk
• Lower voids
• Higher residual value –
less depreciation / • Lower holding costs
obsolescence • Lower service charges
29Responsible Investing (‘RI’) Classification: only to be shown if not public
Incorporating ESG through fund activities
LEADERSHIP > Measures through which we demonstrate effective management of ESG matters
INVESTMENT PROCESS > Procedures through which we integrate ESG into the investment process
PORTFOLIO > Attendance to material ESG performance and risk across the assets
TRANSPARENCY > Approach to investor reporting and public disclosure on relevant ESG factors
• ISO14001 environmental management system
ENVIRONMENTAL • Reduction targets and strategies for key impacts
Energy, water, waste • Renewable energy mix
and responsible consumption • Climate resilience modelling
• Net zero carbon pathway
• Living Wage Accreditation
SOCIAL • Occupier satisfaction surveys
Safety, security, wellbeing • Safety and security protocols
and prosperity • Community engagement strategy
• Sustainable supply chain strategy
• ESG in Investment Committee approvals
GOVERNANCE • Annual fund-level ESG Reports
Transparency, engagement • Stakeholder engagement, investor briefs
and disclosure • Public Disclosure, TCFD statements
• GRESB participation, CDP submission
30Responsible Investing (‘RI’)
Classification: only to be shown if not public
Incorporating ESG through the property lifecycle
PHASE
7
Acquire Design Construct Operate Refurbish Dispose
SUSTAINABILITY FEATURED WITHIN OPERATIONAL CHECKS & BALANCES
Due-diligence Development Build beyond Regular efficiency Refurbishment Readiness-for-
checklists Brief current standards analysis Brief sale
Investment
Green
Committee sign- Supply chain standards
Certifications
off
Data Management Platform & Reporting
ESG OBJECTIVES
Green lease
• Acquire properties thoughtfully
clauses
• Design and construct buildings responsibly
• Manage and operate assets responsibly
• Create value within communities
31BMO Commercial Property Trust Classification: only to be shown if not public
UK Property Market –
Looking forward
Estuary Business Park, LiverpoolThe Economic Outlook
Recession appears inevitable in 2020. Recovery projected in 2021 but there are doubts about the speed and trajectory
of the upturn. The downturn is expected to be deeper than in the global financial crisis (GFC). Despite low correlation
with other asset classes, Real Estate returns are correlated with GDP, particularly the Office market.
UK Real GDP - Historic and Forecast per cent Consensus Real GDP Forecast - per cent
8.0 8.0
6.0 6.0
4.0
4.0
2.0
2.0
0.0
0.0
-2.0
-2.0 -4.0
-4.0 -6.0
-6.0 -8.0
-10.0
-8.0
2020 2021
-10.0
UK France Germany W Europe US
1987
1988
1989
1990
1991
1992
1993
1994
1995
1996
1997
1998
1999
2000
2001
2002
2003
2004
2005
2006
2007
2008
2009
2010
2011
2012
2013
2014
2015
2016
2017
2018
2019
2020
2021
Source: ONS, Consensus Economics May 2020 Source: Consensus Economics May 2020
Forecasts are provided for illustrative purposes only; are not a guarantee of future performance; should not be relied upon for any investment decisions; and are subject to change without notice.
33Income – under threat this time?
With greater impact being felt in the ‘real economy’, forecasts are for a more severe loss of income in this downturn
and a less pronounced recovery at the all-property level. Income stream forecast are negative until 2025 at the all-
property level.
Income Streams GFC actual and COVID-19
Forecasts Compared per cent
5.0
4.0
3.0
2.0
1.0
0.0
- 1.0
- 2.0
- 3.0
Y1 Y2 Y3 Y4 Y5 Y6 Y7 Y8 Y9 Y10
Income Growth Historic 2007-16
PMA Income Growth Historic + Forecasts 2018-2027
Source: Property Market Analysis (PMA) March 2020
* 34Property market forecasts – path of returns
Future path of returns highly uncertain but capital values and rents will be under pressure. PMA demonstrates the
recent downgrade to expectations triggered by the lockdown and forecasts of associated global recession. Important to
distinguish short termism from embedded structural challenge.
35Property Market Forecasts - IPF Forecasts by Sector
Polarisation likely to persist. We favour Industrial/distribution and Offices plus some Alternatives. Retail continues as
the laggard though there remains scope for income led returns once values and rents rebase, though this could take
some time. Retail warehousing may present an opportunity. Prospects for Leisure, Hospitality and Student look poor
in the short term.
IPF Consensus Forecast Total Returns by Segment
Five Years to end 2024 per cent per annum
All industrial
City offices
All offices
West End offices
All property
Retail warehouses
Standard retail
Shopping centres
-1.0 0.0 1.0 2.0 3.0 4.0 5.0 6.0
Source: IPF May 2020
Forecasts are provided for illustrative purposes only; are not a guarantee of future performance; should not be relied upon for any investment decisions; and are subject to change without notice.
36UK Property Summary
• The market is slowing, and like all markets remains extremely
uncertain at the present time. Cashflow is king. Counterparty risk to
the fore.
• The shape of the recovery will depend upon the timing of a return to the
‘new normal’ which in itself will continue to deliver a ‘partial economy’ in the
near term with operational challenges to many occupiers. Additional
uncertainties such as Brexit, US, China and the structural challenges to the
retail market should not be forgotten.
• There has been no exuberance in values since 2016 at the All Property
level with Brexit having dampened the cycle. New construction/supply
limited, outside of the logistics market.
• Behavioural challenges evident in the Office, Leisure and hospitality
markets. Digitalisation of the economy - accelerating structural change.
Opportunities will present themselves.
• Industrial is the star performer but caution on over exuberance.
Cassini House, London SW1
• Sector and stock selection of increasing importance. No forced selling
evidenced in the market to date.
37BCPT Near Term Strategy
• Preserve cash and postpone non-essential capital expenditure. The Company’s cash position is sound but
uncertainties over Q2 and Q3 income requires a prudent and defensive approach to cash preservation.
• Reinstate a dividend. Once the picture relating to Q3 rent collection is clearer the Company can consider the timing
of a possible reinstatement of a dividend.
• Negotiations are well advanced to extend the £100m Barclays facility.
• Rent Collection. Focus on income and continue close engagement with our tenants. Successfully conclude
outstanding rent concessions and repayment agreements for Q2 and Q3 with businesses adversely affected by the
Covid-19 pandemic.
• Safe management. Continue the sound planning and implementation of the safe re-opening and operation of our
assets in line with government best practice guidelines.
• Continue to drive business plans and asset management initiatives where relevant, focusing on the long term
performance of UK commercial real estate.
• Continue to manage and invest in our core real estate assets and locations with strong underlying residual values.
• Beyond the current challenges look to deliver income growth and capitalise on opportunities brought about by the
rapid changes enforced by the pandemic.
• There will be a further market update in July.
38Disclaimer
For professional investors only
This financial promotion is issued for marketing and information purposes only by BMO Global Asset Management in the UK.
BMO Commercial Property Trust Limited is an investment trust and its Ordinary Shares are traded on the main market of the London Stock Exchange.
English language copies of the key information document (KID) can be obtained from BMO Global Asset Management, Exchange House, Primrose Street,
London EC2A 2NY, telephone: Client Services on 0044 (0) 20 7011 4444, email: client.service@bmogam.com or electronically at www.bmogam.com. Please
read before taking any investment decision.
The information provided in the marketing material does not constitute, and should not be construed as, investment advice or a recommendation to buy, sell or
otherwise transact in the Funds.
The funds or securities referred to herein are not sponsored, endorsed, issued, sold or promoted by MSCI, and MSCI bears no liability with respect to any
funds or securities or any index on which such funds or securities are based. The prospectus contains a more detailed description of the limited relationship
MSCI has with BMO Asset Management Limited and any related funds.
©2020 BMO Global Asset Management. Financial promotions are issued for marketing and information purposes; in the United Kingdom by BMO Asset
Management Limited, which is authorised and regulated by the Financial Conduct Authority; in the EU by BMO Asset Management Netherlands B.V., which is
regulated by the Dutch Authority for the Financial Markets (AFM); and in Switzerland by BMO Global Asset Management (Swiss) GmbH, which is authorised
and regulated by the Swiss Financial Market Supervisory Authority (FINMA). Telephone calls may be recorded.
© 2020 BMO Real Estate Partners LLP. Registered in England and Wales with number OC338377. Registered Office: 7 Seymour Street, London W1H 7JW.
BMO REP Asset Management plc is a subsidiary of BMO Real Estate Partners LLP and are members of the BMO Financial Group, which is itself wholly-
owned by the Bank of Montreal.
39Contact us
BMO Global Asset Management (EMEA) – Head Office BMO Global Asset Management – Edinburgh
Exchange House 6th Floor, Quartermile4,
Primrose Street 7a Nightingale Way,
London EC2A 2NY Edinburgh EH3 9EG
Tel: +44 (0) 20 7628 8000 Tel: +46 (0) 207 628 8000
bmogam.com
Extensive worldwide investment capabilities
• Total focus on clients
• Comprehensive range of products
and solutions
• Defined expertise – including a suite of specialist investment
boutiques
CM021629 UK 06/2020
©2020 BMO Global Asset Management. Financial promotions are issued for marketing and information purposes; in the United Kingdom by BMO Asset Management Limited, which is authorised and regulated by the Financial Conduct
Authority; in the EU by BMO Asset Management Netherlands B.V., which is regulated by the Dutch Authority for the Financial Markets (AFM); and in Switzerland by BMO Global Asset Management (Swiss) GmbH, which is authorised and
regulated by the Swiss Financial Market Supervisory Authority (FINMA).
40You can also read