SINGAPORE 1Q 2021 - REAL ESTATE TIMES - Edmund Tie
←
→
Page content transcription
If your browser does not render page correctly, please read the page content below

REAL ESTATE
                                        TIMES

                                        APRIL 2021

SINGAPORE 1Q 2021
Uneven recovery across property sectors despite
improving economy
ECONOMY

Market commentary                               Table 1: Singapore’s Gross Domestic Product (GDP)
                                                                                                  Yoy change (%)
Key economic indicators                           Selected indicators           1Q        2Q            3Q           4Q           1Q
                                                                               2020      2020          2020         2020         2021
• Based on estimates released by the
  Ministry of Trade and Industry (MTI)            Overall GDP                  -0.3      -13.3          -5.8         -2.4         0.2
  on 14 April 2021, Singapore’s economy           Manufacturing                7.9        -0.8          11.0         10.3         7.5
  expanded by 0.2% yoy in 1Q 2021,                Construction                 -1.2      -59.9         -52.4        -27.4        -20.2
  following a -2.4% decline in 4Q 2020 (Table     Services producing
                                                                               -2.3      -13.6          -8.4         -4.7         -1.2
  1). This is the first positive turnaround       industries
  after three consecutive quarters of                                           Source: MTI, advanced estimated released on 14 April 2021
  decline. The economy expanded by 2.0%
  qoq in 1Q 2021, compared to an expansion      Table 2: Inflation, unemployment rate and fixed asset investments
  by 3.8% qoq in 4Q 2020.
                                                                                            1Q           2Q           3Q          4Q
• Economic activities were ramped up at the       Selected indicators
                                                                                           2020         2020         2020        2020
  start of the year as the economy entered        Consumer Price Index
                                                                                            0.0         -0.2         -0.3         -0.2
  Phase 3 of recovery from 28th December          (Core inflation) yoy % change
  2021. After posting a strong 10.3%              Consumer Price Index
  yoy growth, the manufacturing sector            (All items inflation) S.A.                0.4          -0.7        -0.3         -0.1
  expanded by 7.5% yoy in 1Q 2021. Clusters       yoy % change
  such as electronics, precision engineering,     Unemployment rate, S.A. (%)               2.4          2.9          3.6         3.2
  chemicals and biomanufacturing
  performed better than the transport             Fixed asset investments (S$bn)           12.4          1.9          2.1         3.0
  engineering and general manufacturing                                                          Source: Singapore Department of Statistics
  clusters, which experienced output
  declines. As the construction sector          • MAS core inflation rose to 0.7% in February from 0.2% in January
  gradually picked up due to public and           2021, driven by the rise in food inflation and service costs. The labour
  private sector demand, the contraction          market conditions improved slightly in February 2021, as Singapore’s
  moderated to a decline of 20.2% yoy in          overall unemployment rates fell to 3% from 3.2% in January,
  1Q 2021, an improvement from the 27.4%          signifying a renewed confidence by firms to add to headcount. The
  contraction in 4Q 2020.                         labour market has turned the corner for now due to the various job
• The services sector fell by 1.2% yoy in         support/conversion schemes initiated by the government.
  1Q 2021, an improvement from the drop         • The International Monetary Fund (IMF) has upgraded in April this
  of 4.7% in 4Q 2020. Among the services          year its 2021 growth outlook for Asia to 7.6% in 2021, up from the
  sectors, wholesale, retail trade and            6.9% forecasted as of October 2020. Global economic prospects
  transportation & storage fell by 4.1%           have also brightened although the rising interest rates in the US
  yoy in 1Q 2021, a slight improvement            could translate into higher borrowing costs.
  from the decline of 6.4% yoy in 4Q 2020.
  Accommodation & food services, real           • Business and consumer confidence are rising due to the easing of
  estate, administrative & support services       border restrictions and the gradual rollout of the COVID-19 vaccines.
  and other services dropped by -3.9%             Apart from travel dependent industries, we expect most sectors to
  yoy in 1Q 2021 from -9.9% in 4Q 2021.           experience stronger growth in 2021. MAS estimates Singapore’s GDP
  The bright spot was the information and         growth in 2021 to fall within the upper range of their official forecasted
  communications, finance and insurance           growth of 4 to 6%. Cognizant of ongoing global and regional risks, MAS
  and professional services sector which          has maintained an accommodative monetary policy, keeping the rate
  grew 3.7% yoy in 1Q 2021 yoy from 1.4%          of exchange rate appreciation at 0% per annum.
  in 4Q 2021.

EDMUND TIE RESEARCH                                                                                                         1
INVESTMENT

Market commentary                                                  Figure 1: Yearly investment sales by quarter
                                                                    $bn
                                                                    40
Investment sales
                                                                    35
Total investment sales nearly doubled from $2.5bn in                30
Q4 2020 to $4.8bn in Q1 2021 (Figure 1). This was likely
                                                                    25
due to the improved business sentiments arising from
                                                                    20
Singapore’s Phase 3 reopening on 28 December last year
                                                                    15
and the commencement of the Ministry of Health’s (MOH)
national vaccination programme that was piloted on 27               10

January this year. The recovery in investment sales is also          5

reflective of the gradual pick-up of the construction sector,        0
                                                                          2011    2012   2013        2014     2015        2016   2017     2018   2019   2020      2021
which posted a more moderate contraction of 20.2% yoy                                                         Q1     Q2     Q3   Q4

in Q1 2021, compared to the 27.4% contraction in Q4 2020.                                                   Source: Various sources, EDMUND TIE Research

The public investment sales market recordedQ1  no2021
                                                  activity in
                                                           Q4 2020 Figure 2: Total investment sales by asset type
this quarter, given that there were no sites awarded under
                                                                   Q4 2020
the public land sales programmes. This was in part due
                                                                               3%
                                                                         5%
to the government’s cautious approach towards releasing                               10%

sites for tender given the COVID-19 pandemic and the                          6%
prevailing macroeconomic situation at the end of last year. 19%
Furthermore, land parcels released under the 2H2020 GLS                                          39%                                                     Residential Residentia
                                                                                                                                                         Office          Office
programme were granted longer tender periods by URA                     15%
                                                                                                                                                         Industrial Industrial
due to the COVID-19 situation and would only be awarded                                                                                                  Retail          Retail
from Q2 2021 onward.                                                                                                                                     Shophouse Shophouse
                                                                                 4%                                                     65%
On the other hand, the private investment sales market
witnessed brisk activities and recorded 156% qoq growth,
from $1.9bn in Q4 2020 to $4.8bn in Q1 2021. This was                34%
                                            Q1 2021     Q1 2021
led by strong performances in the residential and office
                                                                Q1 2021
sectors, which posted total transaction amounts of $1.8bn
                                                                           3%
and $1.6bn respectively, or 39% and 34% of Q1 2021’s total            5%                        5%
                                                                                                       3%

investment sales (Figure 2). For the remaining sectors,
industrial transactions made up 19% of total investment
                                                            19%        19%
sales, followed by retail and shophouse transactions,                                                                 39%               39%
                                                                                                                                                         Residential Residentia
which represented 5% and 3% of total investment sales                                                                                                    Office          Office

respectively. There were no investment sales in the                                                                                                      Industrial Industrial
                                                                                                                                                         Retail          Retail
hospitality sector.
                                                                                                                                                         Shophouse Shophouse

                                                                                            34%
                                                                            34%

                                                                                                                                          Source: EDMUND TIE Research

EDMUND TIE RESEARCH                                                                                                                                2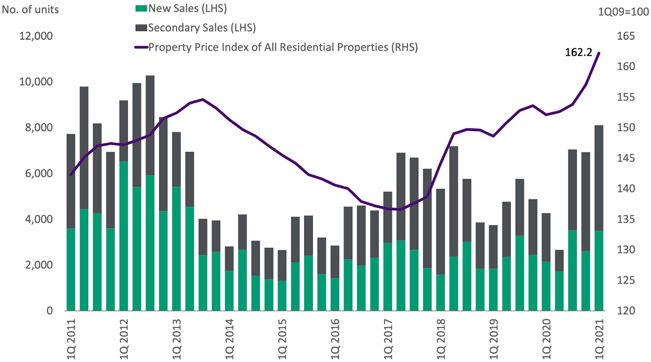
Table 3: Investment sales summary

                            2018    2019     2020     Q2 2020   Q3 2020     Q4 2020        Q1 2021         qoq chg
                            $ mn    $ mn     $ mn      $ mn      $ mn        $ mn           $ mn             %
 Total Investment Sales    32,469   30,350   12,763    1,867     4,788       2,476          4,750            92
 Residential               20,423   7,573    4,478     271       976         1,616          1,840            14
 Office                    5,078    8,506    3,038     1,324     846           84           1,626           1,848
 Industrial                3,018    4,924    2,122     178       433          375            897             139
 Retail                    1,818    3,578    2,677      43       2,457        155            241             55
 Hospitality                985     5,038      0        0         0            0              0             n.m.
 Shophouse                 1,148     730      379       50        60          246            145             -41
 Others                      0        0       70        0         16           0              0             n.m.
 Private Sales             25,348   25,024   10,913    1,863     4,780       1,853          4,750            156
 Residential               13,892   3,023    2,865     271       976          993           1,840            85
 Office                    4,713    8,506    3,038     1,324     846           84           1,626           1,848
 Industrial                2,855    4,711    1,884     174       425          375            897             139
 Retail                    1,818    3,578    2,677      43       2,457        155            241             55
 Hospitality                923     4,475      0        0         0            0              0             n.m.
 Shophouse                 1,148     730      379       50        60          246            145             -44
 Others                      0        0       70        0         16           0              0             n.m.
 Government sales          7,121    5,326    1,851      4         8           622             0             n.m.
 Residential               6,531    4,550    1,612      0         0           622             0             n.m.
 Office                     365       0        0        0         0            0              0             n.m.
 Industrial                 163      213      238       4         8            0              0             n.m.
 Retail                      0        0        0        0         0            0              0             n.m.
 Hospitality                 62      562       0        0         0            0              0             n.m.
 Shophouse                   0        0        0        0         0            0              0             n.m.
 Others                      0        0        0        0         0            0              0             n.m.

                                                                          Source: Various sources, EDMUND TIE Research

EDMUND TIE RESEARCH                                                                                   3
Sector trends and outlook
• There were three significant office transactions in Q1 Point for $220mn to unrelated parties. The shopping
2021, with the highest amount posted by the divestment mall has around 70 tenants spread over 74,000 sq ft
of 50% of OUE Bayfront by OUE Commercial REIT to of NLA. This transaction marked FCT’s third retail mall
Allianz Real Estate for $633.8mn (Table 4). The other divestment over three consecutive quarters, adding to
significant transactions were the sale of Certis Cisco the REIT’s divestment of Bedok Point and Anchorpoint
Centre at 20 Jalan Afifi for $150mn, and 108 Robinson Shopping Centre in Q3 2020 and Q4 2020 respectively.
Road for $142.8mn. These key transactions marked a • There were two significant residential transactions in
contrast to Q4 2020, where there were no significant Q1 2021. The first was the $293mn sale of all 20 units
office transactions, and point to a possible return of of Eden, a freehold luxury condominium by Swire
interest for the office sector given that with effect from Properties at 2 Draycott Park, to the members of the Tsai
5th April 2021, 75% of staff can return to their workplace family of Want Want China Holdings. The second was the
at any one time and working from home is no longer the sale of a Good Class Bungalow (GCB) at 30 Nassim Road
default arrangement. to a private investor for $128.8mn. Apart from these, the
• Industrial investment sales amounted to $897.4mn in residential sector was abuzz with 10 other transactions
Q1 2021, more than doubling the $375.4mn recorded greater than $30mn each in Q1 2021, of which 7 were
in Q4 2020. There were three significant industrial recorded by GCBs.
transactions, namely the sale of 20 – 23 Rochester Park The stark pick-up in transaction activities in Q1 2021
at $144.8mn, followed by BreadTalk Group’s divestment relative to the previous quarter is indicative of the
of BreadTalk IHQ at 30 Tai Seng Street for $118mn, and improving appetite amongst investors. As MOH’s ongoing
AIMS APAC REIT’s $102mn acquisition of Sime Darby vaccination drive helps the nation achieve herd immunity
Business Centre at 315 Alexandra Road. against COVID-19 and consequently normalcy in the
• For retail investment sales, the sole significant economy, investment activity could be bolstered for the
transaction in Q1 2021 was FCT’s divestment of YewTee rest of 2021.
Table 4: Key* private investment sale transactions in 1Q 2021
Remaining Purchase price
Development Purchaser Seller
tenure, yrs $ mn $ psf
Residential
Eden Freehold 293.0 4,827 NLA Want Want China Holdings Swire Properties
Jin Xiao Qun Sukmawati Widjaja
4,005
30 Nassim Road Freehold 128.8 (wife of the founder of Nanofilm (Vice chairperson of Sinar
land area
Technologies International) Mas Group)
Office
OUE Commercial Real Estate
OUE Bayfront (50% stake) 86 633.8 3,170 NLA Allianz Real Estate
Investment Trust
Certis Cisco Centre 23 150.0 1,152 land area Certis & Lendlease Property Trust Certis Cisco Security Pte Ltd
108 Robinson Road Freehold 142.8 2,604 NLA PGIM Real Estate Sin Capital Group
Industrial
1,046 land
20 - 23 Rochester Park 25 144.8 Unknown Unknown
area
Lian Beng Group, Apricot Capital,
BreadTalk IHQ 19 + 30 118.0 474 GFA BreadTalk Group Pte Ltd
& 32RE Investments
Sime Darby Business Centre 34 102.0 569 GFA AIMS APAC REIT Aster (Alexandra) Pte Ltd
Retail
YewTee Point 84 220.0 2,986 NLA Unknown Frasers Centrepoint Trust
*Refers to any property transactions with value above S$100mn. Source: Various sources
EDMUND TIE RESEARCH 4OFFICE
Office demand and occupancy rates Rents
• With effect from 5th April 2021, 75% of Monthly rents in the various subzones of the office sector held steady
staff can return to their workplace at any or declined slightly in 1Q 2021 (Table 5). Within the CBD and Non-CBD,
one time and working from home is no there was a flight to quality by corporates. Due to the tight vacancies,
longer the default arrangement. Even as premium grade office rents held steady in the quarter. In addition, with
more workers gradually return to their the impending redevelopment of AXA Tower and Fuji Xerox Towers,
office premises, some employees have there is some leasing demand from the displaced tenants seeking to
indicated a preference for work-from-home lease alternative office premises. The steepest declines were recorded
arrangements, citing productivity gains in Raffles Place Grade A and Shenton Way/Robinson Road/Tanjong
and reduced commute times. As a result, Pagar Grade B as vacancies rose. In the Orchard Road and decentralised
businesses remain cautious about expanding areas, leasing activity was limited but rents were broadly unchanged.
traditional office spaces as they deliberated
Figure 3: Office occupancy rates* and qoq % point change (in arrows) in
on the ideal hybrid working model. 1Q 2021
• Major banks are reviewing their
operations and shrinking their physical
offices. It was reported that DBS plans to
shed 75,000 sq ft at Marina Bay Financial
(MBFC) Tower Three, while Standard
Chartered is also considering giving up its
space in MBFC Tower One. ANZ Singapore
is also considering terminating one floor
of its current existing space in Ocean
Financial Centre in 2021.
• Co-working operator Just-Co had recently
announced in March 2021 that it will be
opening another office in Tampines located
at Asia Green, after an announcement
for an expansion located in One-North
(30,000 sq ft). Bridge+ by CapitaLand also
opened another co-working office at 79
Robinson Road in January 2021, three Figure 4: Office development pipeline
years after the debut of its Bridge+ flagship
mn sq ft Under Construction Planned
co-working office in Ascent building at
1.6
Singapore Science Park 1.
• Based on EDMUND TIE Research statistics,
overall net absorption islandwide declined 1.2
from a robust 390,000 sq ft in 4Q 2020 to
74,000 sq ft in 1Q 2021. The islandwide
occupancy rate remained stabilised 0.8
remaining at 93.3% in 1Q 2021 (Figure 3). The
occupancy rate in CBD fell by 0.4% pts qoq to
92.7% in 1Q 2021 from 93.1% in 4Q 2020. 0.4
0.0
2021 2022 2023 2024
Source: EDMUND TIE Research
EDMUND TIE RESEARCH 5Supply pipeline Outlook
Based on EDMUND TIE Research, there are On the whole, we expect office rents to bottom out by the end of
nearly 4.5mn sq ft of new office space that this year as the employment outlook improves. Even as major banks
will be completed from 2021 to 2024 (Figure continue to downsize their office spaces, demand for office spaces
4). Most of the office developments will be continues to be fuelled by technology, fintech and finance companies.
completed in 2021 (28.03% or 1.36mn sq Singapore has been a regional base for Western companies and is now
ft) and 2024 (28.05% or 1.4mn sq ft). Close becoming a hub for Chinese technology companies. This is supported by
to half (47.2%) of the supply pipeline from the office expansion of Tencent, Alibaba and ByteDance, as they ramp up
2021 (28% or 1.4mn sq ft) to 2024 will be in the hiring process to recruit more talents in Singapore, especially talents
the CBD, followed by 32.2% in Decentralised who are trained in the technology sector. The recent announcement of
Areas. The larger developments include Google co-founder Sergey Brin opening a family office in Singapore will
Central Boulevard towers (1.26mn sq ft) buoy investor confidence in Singapore as a financial hub.
which is slated to be completed in 2023 and
We expect more businesses to sign on leases with co-working operators
an office/ retail development by SP Group
due to the flexibility and shorter-term commitments. As companies
(640,000 sq ft) located at Pasir Panjang Road
endeavour to accommodate their employees’ preferences to work
and scheduled to be completed in 2024.
with some form of flexibility, the trend of co-working spaces might
be preferred by companies looking for a change from traditional
workspaces. Even for traditional offices, we are seeing a gradual
transition to integrate more communal spaces for people to connect
and engage in meaningful collaborations.
Table 5: Average monthly gross office rents (S$ per sq ft)
Location Subzone Grade 4Q 2020 1Q 2021 Qoq change (%)
Marina Bay Premium 12.03 12.03 0.0
Raffles Place A 10.26 10.06 -1.0
CBD Premium 10.86 10.86 0.0
Shenton Way/
Robinson Road/ A 8.72 8.67 -0.5
Tanjong Pagar
B 7.11 7.04 -1.0
Marina Centre A 9.65 9.60 -0.5
Premium 10.72 10.72 0.0
Non-CBD City Hall/Bugis
* 7.01 6.98 -0.5
Orchard Road * 8.84 8.84 0.0
Decentralised areas Decentralised areas * 6.03 6.03 0.0
*Ungraded office space Source: EDMUND TIE Research
EDMUND TIE RESEARCH 6INDUSTRIAL
Market commentary Table 6: Singapore’s NODX and PMI
Key
Key indicators 4Q 1Q
economic Key trends
2020 2021
The manufacturing sector expanded for the indicators
• NODX growth was led by the electronics
ninth consecutive months in March 2021 and
sector (14.8%) in 1Q 2021 while non-
the PMI reading is the highest since March electronic NODX posted growth of 8.4%
NODX
2019. The PMI reading expanded by 0.3 (Yoy)
-0.5% 9.7% in 1Q 2021. The largest contributor was
points from February 2021 to 50.8 in March China, which contributed 15.3% to exports.
This is followed by United States, which
2021 (Table 6). NODX increased 9.7% yoy in contributed to 12.8% in exports.
1Q 2021, after a -0.5% fall in 4Q 2020. • The higher reading is supported by a
higher growth in new orders, exports and
50.5 50.8
employment. The electronics subindex fell
Demand and occupancy PMI* (Dec (March
by 0.2 points from February 2021 to 50.6
2020) 2021)
in March 2021. This is the eighth month of
• Based on JTC’s statistics, overall industrial
expansion for the electronics sector.
net absorption increased from 1.2mn sq ft
* Reading above 50 indicates an expansion, while below 50 indicates Source: SIPMM
in 3Q 2020 to 2.3mn sq ft in 4Q 2020. The a contraction.
full-year absorption declined from 7.9mn
sq ft in 2019 to 7.5mn sq ft in 2020 (-4.0%). Figure 5: Occupancy rates of industrial space by type
In 4Q 2020, occupancy rates of single-user
%
factory space, multiuser factory space,
Single-user factory Multiple-user factory Business park Warehouse
and business park and warehouse space
100
increased (Figure 5). The two industrial
segments, which saw the greatest increase
are multi-user factory occupancy, which
improved by 0.8% qoq and business park 90
occupancy, which improved by 0.5% qoq
in 4Q 2020.
80
Rents
• Based on EDMUND TIE Research’s
industrial property basket, monthly rents 70
2015 2016 2017 2018 2019 2020
were broadly flat for most industrial
Source: JTC
segments in 1Q 2021 (Table 7). Although
upper-storey factory rents fell by -0.5%
Table 7: Average monthly gross rents (islandwide) (S$ per sq ft)
qoq in 1Q 2021, it was a smaller decline
compared to 4Q 2020 (-1.0%). 4Q 1Q Qoq change
Industrial type* Subcategory
2020 2021 (%)
• We expect hi-tech industrial properties to First-storey 1.84 1.84 0.0
Multiple-user factory
perform better than the other industrial Upper-storey 1.31 1.30 -0.5
stock due to the government’s push for Warehouse/logistics Overall 1.59 1.59 0.0
High-tech industrial Overall 2.92 2.94 0.5
Central Region 5.00 5.00 0.0
Business park
Suburban 3.66 3.66 0.0
* In-house estimates of key selected private Source: EDMUND TIE Research
industrial premises.
EDMUND TIE RESEARCH 7advanced manufacturing as Singapore Figure 6: Industrial development pipeline (with planning approvals and
prepares for Industry 4.0. In 1Q 2021, hi- GLS sites which are pending approvals)
tech industrial rents rose by 0.5% qoq. mn sq ft Data centres
Extensions, additions and alterations to industrial properties
There has been a preference for modern Warehouse
specifications due to a rise in e-commerce, Multiple-user industrial developments
Single-user industrial developments
food logistics, and medical manufacturing. Business parks
Older industrial buildings will likely see a 25
decline in demand, resulting in a two-
20
tiered industrial market.
15
Supply pipeline
10
• As of 4Q 2020, the supply pipeline from
2021 to 2024 is projected to be around 5
41.7mn sq ft (NLA). Approximately 53%
0
of the pipeline will be completed in 2021, 2021 2022 2023 2024
followed by 30.7% in 2022 (12.8mn sq ft). Source: JTC, EDMUND TIE Research
The hike in potential completions in 2021
was due to the delay in the completion of
projects and new supply being rolled over Outlook
from 2020. Multi-user factories accounted The industrial sector outlook remains relatively bright, as the
for the bulk (33%) of the supply pipeline government continues to ensure that Singapore remains a competitive
(Figure 6). The larger multi-user factory manufacturing hub, especially for the pharmaceutical sector. Various
developments in the pipeline are Solaris major multinational firms have raised interest in developing facilities
@ Tai Seng (929,000 sq ft) and Mapletree to develop and manufacture vaccines. Thermo Fisher Scientific will be
Industrial Trust located at Kallang Way investing $174 million, and their facility will be operational in 2022,
(710,000 sq ft). With the excess supply the plant will manufacture a wide range of vaccines and therapeutics.
of industrial projects in 2021, we will also Another global biopharmaceutical company Sanofi will be investing
expect to see more subdued rents for $639 million over five years for their new vaccine site, their first vaccine
industrial spaces. production centre in Asia, where construction is expected to start in
Q3 2021.
There has also been increasing focus on the environmental impact of
industrial properties in Singapore, especially for data centres. Digital
Realty recently opened its third and largest data centre in Singapore,
which received the Building and Construction Authority’s highest
Green Mark Platinum certification. Moving forward, we can expect
a shift towards more environmentally sustainable infrastructures, as
companies increasingly adopt an ESG agenda.
We expect industrial rents to bottom out this year, led by the high-tech
and warehouse segment as the drive towards e-commerce and hi-tech
manufacturing continues. However, the looming supply pipeline in 2021
will moderate such an increase.
EDMUND TIE RESEARCH 8RETAIL
Market commentary • In February 2021, Watches & Jewellery saw the greatest
improvement of 37% on a yoy basis, followed by Computer &
Key indicators Telecommunications Equipment which grew by 20% yoy (Figure 8).
• With the pandemic situation relatively However, Food & Alcohol was the worst- performing sector, which
well contained in Singapore, coupled declined by 25% yoy in February 2021.
with a stabilisation in the labour market,
businesses and consumers have gradually Figure 7: Retail sales growth (Three-year moving average) (excluding
regained a sense of normalcy. motor vehicles)
• Starting from 5th April 2021, the number of % Retail sales Index
employees allowed to go back to work has 20
been raised from 50 per cent to 75 per cent.
This could potentially drive more footfall 10
in the central area, as retail operators
are largely dependent on the lunchtime 0
working crowds for their business.
-10
• Traditional brick and mortar stores located
in Chinatown ramped up digitalisation with
-20
a committee formed by IMDA, ESG and STB.
Chope and Qoo10 have been appointed to
-30
assist the tenants to drive more sales and
footfall into the area, by providing guidance
-40
and training on digital marketing. 2000 2005 2010 2015 2020
• Although the growth of e-commerce is set in Source: Department of Statistics Singapore
motion, there is still a role for physical retail
and placemaking activities, as consumers
Figure 8: Retail sales index (Feb 2021), yoy change
still need avenues for socialisation.
Department Stores
• A set of guidelines termed the Fair Supermarkets & Hypermarkets
Tenancy Framework Code of Conduct Mini-marts & Convenience Stores
for Leasing of Retail Premises has been Food & Alcohol
Motor Vehicles
developed recently, which is set to come
Petrol Service Stations
into effect from 1 June 2021. It is a set of Cosmetics, Toiletries & Medical Goods
guidelines to assist landlords and tenants Wearing Apparel & Footwear
of qualifying premises (which include, Furniture & Household Equipment
but is not limited to retail, F&B, clinics, Recreational Goods
Watches & Jewellery
and schools) to reach a fair and balanced
Computer & Telecommunications Equipment
position in lease negotiations. Optical Goods & Books
Others
• The 3-month moving average retail
Retail sales excl motor vehicles
sales growth (excluding motor vehicles)
-60% -40% -20% 0% 20% 40%
improved to -1.6% yoy in February 2021
from -5.1% in January 2021 (Figure 7). Source: Department of Statistics Singapore
The Retail Sales Index improved 7.9% in
February 2021, which marked the first
month of growth since January 2020. This
was driven by an improvement in consumer
sentiment and greater shopping footfall.
EDMUND TIE RESEARCH 9• For the food and beverage services Figure 9: Food and Beverage index (Feb 2021), yoy change
index for February 2021, food caterers
reported the greatest decline of 58.9% Total
yoy despite it being the month of the
Chinese New Year celebrations. However,
Restaurants
due to the restrictions of large gatherings,
this has resulted in lower demand for
event catering. Restaurants expanded Fast Food Outlets
6.1% yoy and performed relatively well
as consumers took to dining out more
Food Caterers
frequently (Figure 9).
Demand and occupancy Cafes, Food Courts & Other Eating Places
• Based on EDMUND TIE Research,
-60% -40% -20% 0% 20% 40%
islandwide net absorption improved to
Source: Department of Statistics Singapore
258,000 sq ft in 4Q 2020 from -538,000
sq ft in 3Q 2020. The occupancy rate • More retailers have a preference to open their shops located at the
increased by 0.8% pts qoq to 91.2% in 4Q Fringe/Suburban subzone due to the rise in footfall and the continuation
2020 from 90.4% in 3Q 2020. of the work-from-home arrangements for some companies.
Orchard/Scotts Road (OSR) Other city areas 1 (OCA) Fringe/Suburban areas2 (FSA)
Net • Retail net absorption in • Net absorption in Other City Areas • Net absorption rebounded to
absorption Orchard/Scotts Road declined reversed from negative territory in the 3Q 334,000 sq ft in 4Q 2020 after three
from 32,000 sq ft in 3Q 2020 to 2020 to a positive value of 118,000 sq ft in quarters of contraction in 2020
-194,000 sq ft in 4Q 2020. 4Q 2020.
Occupancy • The occupancy rate declined • The occupancy rate increased by 1.7% pts • The occupancy rate rose by 0.9%
from 90.9% in 3Q 2020 to from 3Q 2020 to 89.3% in 4Q 2020. pts qoq to 92.5% in 4Q 2020.
88.4% in 4Q 2020. (Figure 10).
Openings • Carre d’ artistes at Paragon • Uniqlo at Tampines Mall
(1Q 2021) Shopping Centre • Genki Sushi at NEX
• Din Tai Fung at Compass One
• Yakiniku at Seletar Mall
• Green Common at VivoCity
• Tokyo Shokudo at Westgate
Closures • Robinsons at Raffles City Shopping Centre • Uniqlo at Tampines 1
(1Q 2021)
¹ Other City Areas refer to Downtown Core and Rest of Central Area Source: EDMUND TIE Research
² Fringe/Suburban Areas refer to Fringe Areas and Suburban Areas (Outside Central Region)
EDMUND TIE RESEARCH 10Rents Figure 10: Retail occupancy rates (4Q 2020)
Based on EDMUND TIE Research’s definition
of retail spaces, retail rents were stable in
Orchard/Scotts Road and Other City Areas
in 1Q 2021 (Table 8). Given the strong retail
performance in Fringe/Suburban Areas, as
a result of the catchment population and
Fringe/Suburban
extensive work-from-home arrangements, Areas
Orchard/Scotts 92.5%
rents have ticked up accordingly. Road
88.4%
Supply pipeline
Based on EDMUND TIE Research, around Other City
Areas
1mn sq ft of NLA is expected to be completed 89.3%
islandwide from 2021 to 2024. The bulk of the
supply pipeline is expected to be completed
in 2021 (39.0%) and 2023 (39.0%) (Figure 11).
The majority (87.0%) of the supply pipeline
will emerge from the Fringe/Suburban Areas. Source: EDMUND TIE Research
Figure 11: Retail development pipeline
Outlook '000 sq ft
Orchard/ Scotts Road Other City Areas Fringe/Suburban Areas
Following a series of closures by international
450
brands, Abercrombie & Fitch is the latest
400
international brand that is to exit from
350
Singapore, as it closed its last physical retail
outlet in Singapore and shifts to an exclusively 300
online store. Retailers have to adapt to this new 250
reality and the increasing shift towards online 200
marketing platforms for the sale of products. 150
100
50
0
2021 2022 2023 2024
Source: EDMUND TIE Research
Table 8: Average monthly gross rents (S$ per sq ft)
Location Level 4Q 2020 1Q 2021 Qoq change (%)
Orchard/Scotts Road First storey 37.27 37.27 0.0
(OSR) Upper storey 16.00 16.00 0.0
Other city areas First storey 19.45 19.45 0.0
(OCA) Upper storey 9.83 9.83 0.0
Fringe/Suburban areas First storey 29.97 30.27 1.0
(FSA) Upper storey 17.03 17.11 0.5
Source: EDMUND TIE Research
EDMUND TIE RESEARCH 11RESIDENTIAL
With the introduction of the new Market commentary
Fair Tenancy Framework Code of
Conduct for Leasing of Retail Premises Key indicators
(the “Code”), we are seeing greater • Urban Redevelopment Authority (URA) private residential property
protection being accorded to retail price index rose for the fourth consecutive quarter in Q1 2021, rising
tenants as the Code aims to allow by 3.3% qoq, after an increase of 2.1% in Q4 2020. Compared to a
landlords and tenants to reach a more year ago, prices are 6.6% higher (Table 9).
balanced and fair position in leasing
negotiations as parties will now have • Private non-landed property prices rose by 2.5% qoq in Q1 2021.
to abide by the leasing principles for All market segments registered growth with prices of non-landed
key tenancy terms as provided under properties in the CCR, RCR and OCR increasing by 0.5%, 6.1% and
the Code. 1.1% qoq respectively.
We expect rents in the Orchard/ • The landed property price index soared 6.7% qoq in Q1 2021,
Scotts Road and Other city areas to reversing the 1.6% decrease in Q4 2020.
trade sideways for the rest of this year • Housing loans value rose for the sixth consecutive quarter by 17.5%
amid continued border restrictions yoy in 4Q 2020. However, on a qoq basis, housing loans fell by 2.7%
and flexible work arrangements. A in 4Q 2020, compared to 15.1% growth in 3Q 2020 (Figure 12).
bright spot would be suburban retail,
which caters directly to the needs Table 9: URA Private Residential Price Index
of residents in their catchment. 4Q 2020 1Q 2021 qoq % chg
Suburban rents will post an increase All Residential property 157 162.2 3.3
for the year, tempered slightly by the
Non-Landed 153.3 157.1 2.5
new forthcoming supply.
Core Central Region (CCR) 133.6 134.3 0.5
Rest of Central Region (RCR) 160.6 170.4 6.1
Outside Central Region (OCR) 183.6 185.6 1.1
Landed property 173.8 185.4 6.7
Source: URA
Figure 12: New housing loans limits granted
$ mn
14,000
12,000
10,000
8,000
6,000
4,000
2,000
0
1Q 2015 1Q 2016 1Q 2017 1Q 2018 1Q 2019 1Q 2020
Source: Monetary Authority of Singapore
EDMUND TIE RESEARCH 12• Total private home sales volume in 1Q Figure 13: Private homes sales volume (excluding ECs) and URA All
2021 amounted to 8,100 units, 16.9% Residential Price Index
higher than the sales volume of 6,929
units in 4Q 2020 (Figure 13). We believe
that demand was driven by low interest
rates, strong liquidity, improving buyer
sentiment and the wealth effect of the
rising financial markets.
• New sales volumes increased from 2,603
units in 4Q 2020 to 3,493 units in 1Q 2021.
New sales in 1Q 2021 were 62.5% higher
than that a year ago and 34.2% higher on
the quarter (Figure 13). The share of primary
sales to total transaction volume rose from
37.6% in 4Q 2020 to 43.1% in 1Q 2021.
Source: URA
• Secondary sales volumes increased
slightly from 4,326 units in 4Q 2020 to
near Habourfront MRT station. It had the highest take-up rate of 86%
4,607 units in 1Q 2021.
for its launched units (343 out of 400 units) at the end of March 2021.
• In 1Q 2021, there were five new launches Transacted prices ranged from $2,077 to $2,831 per square feet.
(Table 10), excluding ECs. 2,743 units were
• Another new launch was Midtown Modern, which is part of a mixed
launched in 1Q 2021 compared with 2,422
residential and commercial development located near Bugis MRT
units in 4Q 2020.
station. It had the second-highest take-up rate of 82% (368 out of
• The Reef at King’s Dock, launched in 447 units) as of the end of March 2021. Transacted prices ranged
January 2021, is in the Keppel Bay precinct from $ 2,299 to $ 4,213 per square feet.
Table 10: Non-landed private residential launches (excluding ECs) in 1Q 2021
Launched Sold Launched &
Property Total Prices $ psf Launch
Development Developer Tenure as at as at Unsold as
type Units as at Mar-21 Month
Mar-21 Mar-21 at Mar-21
CCR
Guoco Midtown II
Midtown Non-
Pte Ltd/Midtown 99 yrs 558 447 368 79 2,299 - 4,213 Mar-21
Modern landed
Modern Pte Ltd
Bukit Sembawang Non-
The Atelier Freehold 120 20 4 16 2,743 - 3,040 Mar-21
Land Pte Ltd landed
678 467 372 95
RCR
Normanton Kingsford Huray Non- 99 yrs 1862 1862 735 1127 1,469 - 1,856 Jan-21
Park Development Pte Ltd landed
The Reef at Harbourfront Non- 99 yrs 429 400 343 57 2,077 - 2,831 Jan-21
King's Dock Three Pte Ltd landed
2291 2262 1078 1184
OCR
Distinct Home (TKJ) Non-
J@63 Freehold 14 14 4 10 1,332 - 1,447 Feb-21
Pte Ltd landed
14 14 4 10
Total 2,983 2,743 1,454 1,289
Source: URA
EDMUND TIE RESEARCH 13• In the private residential leasing market, Figure 14: Number of private home rental transactions (excluding ECs)
total rental volumes increased 6.6% yoy but '000 units 1Q 2Q 3Q 4Q
declined by 3.1% qoq to 23,123 transactions 100
in 1Q 2021 (Figure 14). The URA Rental
Index of Private Sector Residential 80
Properties increased by 2.2% qoq in 1Q
2021. The mass rental market is expected 60
to see sustained demand from expatriates
relocating from prime properties as
40
well as from foreign workers seeking
accommodation due to border restrictions.
20
• As at 1Q 2021, the residential supply
pipeline stood at 50,906 units. Most 0
completions are expected to occur in 2023 2011 2012 2013 2014 2015 2016 2017 2018 2019 2020 2021
and 2024 (Figure 15). Around 4,942 units Source: URA
will be expected to complete from Q2
to Q4 2021. Around 52.1% of the supply
Figure 15: Number of private homes in the pipeline (excluding ECs)
pipeline (26,537 units) have been sold, '000 units Under Construction PP/WP Others
while the remaining 24,369 uncompleted
16
units are still unsold.
14
Outlook 12
Given an improving economic outlook, 10
coupled with dwindling unsold inventory
8
and the expectation of more launches ahead,
we expect residential demand and prices to 6
improve for the rest of the year. The buoyant 4
HDB resale market may also prompt flat
2
owners to sell their flats and upgrade to
private property. With private residential 0
2Q-4Q2021 2022 2023 2024 2025 >2025
property prices rising for the fourth
Source: URA
consecutive quarter, there are rising concerns
that the government may introduce new
cooling measures. Market players thus need
to ensure that the property market trajectory
is in line with economic fundamentals to
ensure a sustainable market for all.
EDMUND TIE RESEARCH 14CONTACTS Ong Choon Fah
Chief Executive Officer
+65 6393 2318
choonfah.ong@etcsea.com
PROFESSIONAL SERVICES
Valuation Advisory Property Tax Advisory & Hospitality Property Management
Poh Kwee Eng Statutory Valuation Kwok Sai Kuai Kwok Sai Kuai
Executive Director Ng Poh Chue Executive Director Executive Director
Regional Head of Executive Director +65 6417 9229 Regional Head of
Valuation Advisory +65 6393 2515 saikuai.kwok@etcsea.com Property Management
+65 6393 2312 pohchue.ng@etcsea.com +65 6417 9229
kweeeng.poh@etcsea.com Tay Hock Soon saikuai.kwok@etcsea.com
Senior Director
Nicholas Cheng Research & Consulting +65 6887 0088 Paul Wong
Executive Director tayhs@treetops.com.sg Senior Director
Ong Choon Fah
+65 6393 2317 +65 6417 9225
Chief Executive Officer
nicholas.cheng@etcsea.com paul.wong@etcsea.com
+65 6393 2318
choonfah.ong@etcsea.com
Lam Chern Woon
Senior Director
+65 6393 2340
chernwoon.lam@etcsea.com
AGENCY SERVICES REGIONAL OFFICES
Investment Advisory Business Space & Retail Malaysia
Poh Kwee Eng Tan Chun Ming Chua Wei Lin Eddy Wong
Executive Director Executive Director Executive Director Managing Director
+65 6393 2312 Cross-border Investment Advisory Regional Head of +603 2024 6380
kweeeng.poh@etcsea.com +65 6393 2360 Business Space eddy.wong@ntl.my
chunming.tan@etcsea.com +65 6393 2326
Swee Shou Fern weilin.chua@etcsea.com
Executive Director Thailand
+65 6393 2523 Christopher Ng
shoufern.swee@etcsea.com Chief Operating Officer
EDMUND TIE Group
Auction & Sales Residential China Desk +65 6393 2376
christopher.ng@etcsea.com
Chua Wei Lin Margaret Thean Tan Chun Ming
Executive Director Executive Director Executive Director Tan Chun Ming
+65 6393 2326 Regional Head of Residential +65 6393 2360 Executive Director
weilin.chua@etcsea.com +65 6393 2383 chunming.tan@etcsea.com +65 6393 2360
margaret.thean@etcsea.com chunming.tan@etcsea.com
Joy Tan
Senior Director Karen Ong Punnee Sritanyalucksana
+65 6393 2505 Executive Director Chief Operating Officer
joy.tan@etcsea.com +65 6393 2366 EDMUND TIE Thailand
karen.ong@etcsea.com +66 2257 0499 ext 101
punnee.s@etcthailand.co.th
Editor: Authors:
Saleha Yusoff Lam Chern Woon Amanda Goh
Executive Director Senior Director Research Analyst
Regional Head of Research & Consulting Research
Research & Consulting +65 6393 2340 +65 6393 2382
+603 2161 7228 ext 302 chernwoon.lam@etcsea.com amanda.goh@etcsea.com
saleha.yusoff@etcsea.com
For more information, please contact us at research.sg@etcsea.com.
Disclaimer: The information contained in this document and all accompanying presentations (the “Materials”) are approximates only, is subject to change
without prior notice, and is provided solely for general information purposes only. While all reasonable skill and care has been taken in the production of the
Materials, EDMUND TIE (the “Company”) make no representations or warranties, express or implied, regarding the completeness, accuracy, correctness,
reliability, suitability, or availability of the Materials, and the Company is under no obligation to subsequently correct it. You should not rely on the Materials
as a basis for making any legal, business, or any other decisions. Where you rely on the Materials, you do so at your own risk and shall hold the Company,
its employees, subsidiaries, related corporations, associates, and affiliates harmless to you to and any third parties to the fullest extent permitted by law for any losses,
damages, or harm arising directly or indirectly from your reliance on the Materials, including any liability arising out of or in connection with any fault or negligence. Any
disclosure, use, copying, dissemination, or circulation of the Materials is strictly prohibited, unless you have obtained prior consent from the Company, and have credited the
Company for the Materials. © EDMUND TIE 2021
We are now on
Edmund Tie & Company (SEA) Pte Ltd Scan the QR code with
5 Shenton Way, #13-05 UIC Building, Singapore 068808. WeChat app to visit
our WeChat account.
T. +65 6293 3228 | F. +65 6298 9328 | mail.sg@etcsea.com | Please visit www.etcsea.com and follow us onYou can also read