A Brighter Future for EDP - Empower EDP

Page created by Hector Young
 
CONTINUE READING
A Brighter Future for EDP - Empower EDP
A Brighter
Future for EDP
14 February 2019
A Brighter Future for EDP - Empower EDP
Disclaimer
THIS DOCUMENT HAS BEEN ISSUED BY ELLIOTT ADVISORS (UK) LIMITED (“EAUK”), WHICH IS AUTHORISED AND REGULATED BY THE UNITED KINGDOM’S FINANCIAL CONDUCT AUTHORITY (“FCA”). NOTHING WITHIN THIS DOCUMENT
PROMOTES, OR IS INTENDED TO PROMOTE, AND MAY NOT BE CONSTRUED AS PROMOTING, ANY FUNDS ADVISED DIRECTLY OR INDIRECTLY BY EAUK (THE “ELLIOTT FUNDS”).

THIS DOCUMENT IS FOR DISCUSSION AND INFORMATIONAL PURPOSES ONLY. THE VIEWS EXPRESSED HEREIN REPRESENT THE OPINIONS OF EAUK AND ITS AFFILIATES (COLLECTIVELY, “ELLIOTT MANAGEMENT”) AS OF THE DATE HEREOF. ELLIOTT
MANAGEMENT RESERVES THE RIGHT TO CHANGE OR MODIFY ANY OF ITS OPINIONS EXPRESSED HEREIN AT ANY TIME AND FOR ANY REASON AND EXPRESSLY DISCLAIMS ANY OBLIGATION TO CORRECT, UPDATE OR REVISE THE INFORMATION
CONTAINED HEREIN OR TO OTHERWISE PROVIDE ANY ADDITIONAL MATERIALS.

ALL OF THE INFORMATION CONTAINED HEREIN IS BASED ON PUBLICLY AVAILABLE INFORMATION WITH RESPECT TO EDP – ENERGIAS DE PORTUGAL, S.A (THE “COMPANY”, “EDP”), INCLUDING PUBLIC FILINGS AND DISCLOSURES MADE BY THE
COMPANY AND OTHER SOURCES, AS WELL AS ELLIOTT MANAGEMENT’S ANALYSIS OF SUCH PUBLICLY AVAILABLE INFORMATION. ELLIOTT MANAGEMENT HAS RELIED UPON AND ASSUMED, WITHOUT INDEPENDENT VERIFICATION, THE ACCURACY
AND COMPLETENESS OF ALL DATA AND INFORMATION AVAILABLE FROM PUBLIC SOURCES, AND NO REPRESENTATION OR WARRANTY IS MADE THAT ANY SUCH DATA OR INFORMATION IS ACCURATE. ELLIOTT MANAGEMENT RECOGNISES THAT
THERE MAY BE CONFIDENTIAL OR OTHERWISE NON-PUBLIC INFORMATION WITH RESPECT TO THE COMPANY THAT COULD ALTER THE OPINIONS OF ELLIOTT MANAGEMENT WERE SUCH INFORMATION KNOWN.

NO REPRESENTATION, WARRANTY OR UNDERTAKING, EXPRESS OR IMPLIED, IS GIVEN AND NO RESPONSIBILITY OR LIABILITY OR DUTY OF CARE IS OR WILL BE ACCEPTED BY ELLIOTT MANAGEMENT OR ANY OF ITS DIRECTORS, OFFICERS, EMPLOYEES,
AGENTS, OR ADVISORS (EACH AN “ELLIOTT PERSON”) CONCERNING: (I) THIS DOCUMENT AND ITS CONTENTS, INCLUDING WHETHER THE INFORMATION AND OPINIONS CONTAINED HEREIN ARE ACCURATE, FAIR, COMPLETE OR CURRENT; (II) THE
PROVISION OF ANY FURTHER INFORMATION, WHETHER BY WAY OF UPDATE TO THE INFORMATION AND OPINIONS CONTAINED IN THIS DOCUMENT OR OTHERWISE TO THE RECIPIENT AFTER THE DATE OF THIS DOCUMENT; OR (III) THAT ELLIOTT
MANAGEMENT’S INVESTMENT PROCESSES OR INVESTMENT OBJECTIVES WILL OR ARE LIKELY TO BE ACHIEVED OR SUCCESSFUL OR THAT ELLIOTT MANAGEMENT’S INVESTMENTS WILL MAKE ANY PROFIT OR WILL NOT SUSTAIN LOSSES. PAST
PERFORMANCE IS NOT INDICATIVE OF FUTURE RESULTS. TO THE FULLEST EXTENT PERMITTED BY LAW, NONE OF THE ELLIOTT PERSONS WILL BE RESPONSIBLE FOR ANY LOSSES, WHETHER DIRECT, INDIRECT OR CONSEQUENTIAL, INCLUDING LOSS
OF PROFITS, DAMAGES, COSTS, CLAIMS OR EXPENSES RELATING TO OR ARISING FROM THE RECIPIENT’S OR ANY PERSON’S RELIANCE ON THIS DOCUMENT.

EXCEPT FOR THE HISTORICAL INFORMATION CONTAINED HEREIN, THE INFORMATION AND OPINIONS INCLUDED IN THIS DOCUMENT CONSTITUTE FORWARD-LOOKING STATEMENTS, INCLUDING ESTIMATES AND PROJECTIONS PREPARED WITH
RESPECT TO, AMONG OTHER THINGS, THE COMPANY’S ANTICIPATED OPERATING PERFORMANCE, THE VALUE OF THE COMPANY’S SECURITIES, DEBT OR ANY RELATED FINANCIAL INSTRUMENTS THAT ARE BASED UPON OR RELATE TO THE VALUE OF
SECURITIES OF THE COMPANY (COLLECTIVELY, “COMPANY SECURITIES”), GENERAL ECONOMIC AND MARKET CONDITIONS AND OTHER FUTURE EVENTS. YOU SHOULD BE AWARE THAT ALL FORWARD-LOOKING STATEMENTS, ESTIMATES AND
PROJECTIONS ARE INHERENTLY UNCERTAIN AND SUBJECT TO SIGNIFICANT ECONOMIC, COMPETITIVE, AND OTHER UNCERTAINTIES AND CONTINGENCIES AND HAVE BEEN INCLUDED SOLELY FOR ILLUSTRATIVE PURPOSES. ACTUAL RESULTS MAY
DIFFER MATERIALLY FROM THE INFORMATION CONTAINED HEREIN DUE TO REASONS THAT MAY OR MAY NOT BE FORESEEABLE. THERE CAN BE NO ASSURANCE THAT THE COMPANY SECURITIES WILL TRADE AT THE PRICES THAT MAY BE IMPLIED
HEREIN, AND THERE CAN BE NO ASSURANCE THAT ANY ESTIMATE, PROJECTION OR ASSUMPTION HEREIN IS, OR WILL BE PROVEN, CORRECT.

THIS DOCUMENT IS FOR INFORMATIONAL PURPOSES ONLY, AND DOES NOT CONSTITUTE (A) AN OFFER OR INVITATION TO BUY OR SELL, OR A SOLICITATION OF AN OFFER TO BUY OR SELL, ANY SECURITY OR OTHER FINANCIAL INSTRUMENT AND
NO LEGAL RELATIONS SHALL BE CREATED BY ITS ISSUE, (B) A “FINANCIAL PROMOTION” FOR THE PURPOSES OF THE FINANCIAL SERVICES AND MARKETS ACT 2000, (C) “INVESTMENT ADVICE” AS DEFINED BY THE FCA HANDBOOK, (D) “INVESTMENT
RESEARCH” AS DEFINED BY THE FCA HANDBOOK, OR (E) AN “INVESTMENT RECOMMENDATION” AS DEFINED BY REGULATION (EU) 596/2014. THIS DOCUMENT IS NOT (AND MAY NOT BE CONSTRUED TO BE) LEGAL, TAX, INVESTMENT, FINANCIAL OR
OTHER ADVICE. EACH RECIPIENT SHOULD CONSULT THEIR OWN LEGAL COUNSEL AND TAX AND FINANCIAL ADVISERS AS TO LEGAL AND OTHER MATTERS CONCERNING THE INFORMATION CONTAINED HEREIN. THIS DOCUMENT DOES NOT
PURPORT TO BE ALL-INCLUSIVE OR TO CONTAIN ALL OF THE INFORMATION THAT MAY BE RELEVANT TO AN EVALUATION OF THE COMPANY, COMPANY SECURITIES OR THE MATTERS DESCRIBED HEREIN.

NO AGREEMENT, COMMITMENT, UNDERSTANDING OR OTHER LEGAL RELATIONSHIP EXISTS OR MAY BE DEEMED TO EXIST BETWEEN OR AMONG ELLIOTT MANAGEMENT AND ANY OTHER PERSON BY VIRTUE OF FURNISHING THIS DOCUMENT.
ELLIOTT MANAGEMENT IS NOT ACTING FOR OR ON BEHALF OF, AND IS NOT PROVIDING ANY ADVICE OR SERVICE TO, ANY RECIPIENT OF THIS DOCUMENT. ELLIOTT MANAGEMENT IS NOT RESPONSIBLE TO ANY PERSON FOR PROVIDING ADVICE IN
RELATION TO THE SUBJECT MATTER OF THIS DOCUMENT. BEFORE DETERMINING ON ANY COURSE OF ACTION, ANY RECIPIENT SHOULD CONSIDER ANY ASSOCIATED RISKS AND CONSEQUENCES AND CONSULT WITH ITS OWN INDEPENDENT
ADVISORS AS IT DEEMS NECESSARY.

THE ELLIOTT FUNDS HAVE DIRECT OR INDIRECT INVESTMENTS IN EDP AND CERTAIN OF ITS AFFILIATES. ELLIOTT MANAGEMENT THEREFORE HAS A FINANCIAL INTEREST IN THE PROFITABILITY OF THE ELLIOTT FUNDS’ POSITIONS IN EDP.
ACCORDINGLY ELLIOTT MANAGEMENT MAY HAVE CONFLICTS OF INTEREST AND THIS DOCUMENT SHOULD NOT BE REGARDED AS IMPARTIAL. NOTHING IN THIS DOCUMENT SHOULD BE TAKEN AS ANY INDICATION OF ELLIOTT MANAGEMENT’S
CURRENT OR FUTURE TRADING OR VOTING INTENTIONS WHICH MAY CHANGE AT ANY TIME.
ELLIOTT MANAGEMENT INTENDS TO REVIEW ITS INVESTMENTS IN THE COMPANY ON A CONTINUING BASIS AND DEPENDING UPON VARIOUS FACTORS, INCLUDING WITHOUT LIMITATION, THE COMPANY’S FINANCIAL POSITION AND STRATEGIC
DIRECTION, THE OUTCOME OF ANY DISCUSSIONS WITH THE COMPANY, OVERALL MARKET CONDITIONS, OTHER INVESTMENT OPPORTUNITIES AVAILABLE TO ELLIOTT MANAGEMENT, AND THE AVAILABILITY OF COMPANY SECURITIES AT PRICES
THAT WOULD MAKE THE PURCHASE OR SALE OF COMPANY SECURITIES DESIRABLE, ELLIOTT MANAGEMENT MAY FROM TIME TO TIME (IN THE OPEN MARKET OR IN PRIVATE TRANSACTIONS, INCLUDING SINCE THE INCEPTION OF ELLIOTT
MANAGEMENT’S POSITION) BUY, SELL, COVER, HEDGE OR OTHERWISE CHANGE THE FORM OR SUBSTANCE OF ANY OF ITS INVESTMENTS (INCLUDING COMPANY SECURITIES) TO ANY DEGREE IN ANY MANNER PERMITTED BY LAW AND EXPRESSLY
DISCLAIMS ANY OBLIGATION TO NOTIFY OTHERS OF ANY SUCH CHANGES. ELLIOTT MANAGEMENT ALSO RESERVES THE RIGHT TO TAKE ANY ACTIONS WITH RESPECT TO ITS INVESTMENTS IN THE COMPANY AS IT MAY DEEM APPROPRIATE.

ELLIOTT MANAGEMENT HAS NOT SOUGHT OR OBTAINED CONSENT FROM ANY THIRD PARTY TO USE ANY STATEMENTS OR INFORMATION CONTAINED HEREIN. ANY SUCH STATEMENTS OR INFORMATION SHOULD NOT BE VIEWED AS INDICATING
THE SUPPORT OF SUCH THIRD PARTY FOR THE VIEWS EXPRESSED HEREIN. ALL TRADEMARKS AND TRADE NAMES USED HEREIN ARE THE EXCLUSIVE PROPERTY OF THEIR RESPECTIVE OWNERS.

                                                                                                                                                                                                                         2
A Brighter Future for EDP - Empower EDP
Executive Summary: Empowering EDP

Energias de Portugal (EDP) owns a collection of high-quality assets with significant value to be unlocked
• Achieving that goal requires: (1) focusing on core areas; (2) accelerating growth; and (3) reducing leverage
The bid put forward by China Three Gorges (CTG) is not in the best interest of EDP stakeholders
• The bid price of €3.26 significantly undervalues EDP
• There has been barely any progress in obtaining necessary regulatory approvals or toward addressing EDP’s concerns
• The stalled bid actively hinders EDP’s growth
• In order to overcome regulatory hurdles, CTG’s bid would likely force an unattractive break-up of EDP leaving the Company weaker
EDP can pursue a superior alternative: An empowerment plan to invest in growth and optimise the portfolio
• Opportunity to crystallise €7.6bn of value from divestments of EDP Brasil, legacy Iberian thermal generation, and minority stake in
  Iberian networks
• Proceeds from portfolio optimisation can allow EDP to invest in its future, including:
    − Invest €3.5bn to accelerate capex in high return renewables projects adding c. 3.5 GW of extra capacity in the near-term
    − De-lever the balance sheet to 3.0x Net Debt / EBITDA
    − Reinvest in core EDP with €1.2bn share buyback

      Elliott believes EDP can realise substantial upside to CTG’s bid by successfully executing an invest and optimise strategy;
             this new EDP — more focused, committed to growth and less levered — will be considered an “ideal utility”

                                                                                                                                        3
A Brighter Future for EDP - Empower EDP
A Brighter Future for EDP

                   Table of Contents

                       EDP Today: A Unique Value Opportunity

                       CTG’s Bid: Hindering EDP’s Growth

                       A Promising Alternative Pathway: Invest and Optimise

                       EDP’s Contrasting Futures

                                                                              4
A Brighter Future for EDP - Empower EDP
EDP Today:
A Unique Value
Opportunity

                 5
A Brighter Future for EDP - Empower EDP
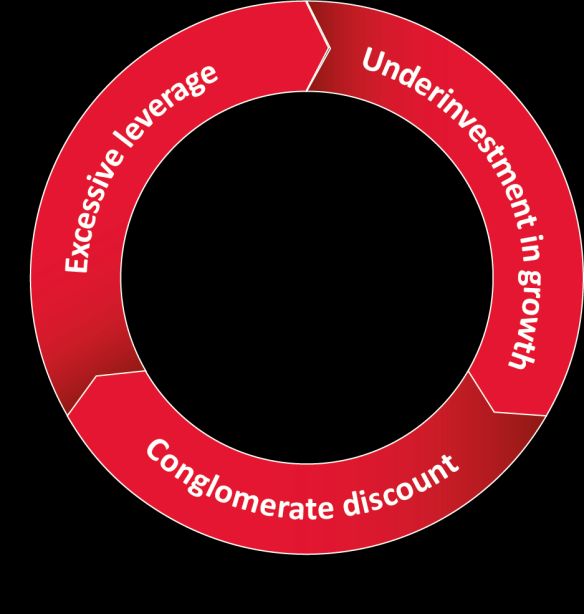
EDP Today: A Collection of High Quality Assets
    Provides stability and growth underpinned by exposure to one of the world’s largest
    renewables portfolios as well as regulated electricity networks

                                                    84%1 of EDP’s EBITDA comes from regulated / long-term contracted activities

                    North America                                                                   Iberian Networks                                                  Europe Wind & Solar
                                                                                                    21% LTM     EBITDA2                                                 20% LTM EBITDA2
                  17% LTM EBITDA2
                    Wind & Solar
                  One of the most
              attractive US renewable
                  energy platforms

                                                                                                                                                                       Iberian Hydro &
                                                                                                                                                                   Conventional Generation
                                                                                                                                                                        21% LTM EBITDA2

                           Brasil

                          Brazil                                                                                                   Brazil
                  19% LTM EBITDA2                                                                                          2% LTM EBITDA2
                 Hydro, Networks,                                                                                                  Wind
                 Commercialisation

Source: EDP Reporting
1 Based on 2017 EBITDA per Report of the Executive Board of EDP published on 8 June 2018; 2 % of EDP’s consolidated LTM EBITDA excl. Other & Adjustments as per EDP’s 9M 2018 report

                                                                                                                                                                                             6
A Brighter Future for EDP - Empower EDP
EDP Trades at a Discount to its Intrinsic Value
    CTG’s bid takes advantage of this value gap at the expense of EDP shareholders

                                                                                                                                                                                                                                                                           4.66
                                                                                                                                                                                                                            4.41                     4.49

                                                                                                                                                                              3.85
                                                                                                                                                      3.60
                                                                                                                               3.41
                                 3.16                                           3.26

                             EDP current                                 CTG offer price                                    Broker                  EDP @                   EDP @                                        Precedent                   EDP @                EDP @
                             share price                                                                                  Target Price           Iberian peers             EU peers                                     transaction                Precedent            Precedent
                                                                                                                                                           1, 3                    1, 2                                                    4, 5
                                                                                                                                                    PE 19E                  PE 19E                                      based SOTP                  Iberian                 EU
                                                                                                                                                                                                                                                  transaction          transaction
                                                                                                                                                                                                                                                   multiples 4, 5       multiples 4, 5

Source: Bloomberg as of 8 February 2019; 1 Based on average P/E 19E; 2 European peers include: Engie, Endesa, Iberdrola, Enel, Naturgy, E.ON, Innogy (pre-transaction) and Orsted; 3 Iberian peers include: Endesa, Iberdrola, Naturgy; 4 Calculations based on Report of the Executive Board
of EDP published on 8 June 2018; 5 EV to Equity bridge as per EDP’s 9M 2018 report

                                                                                                                                                                                                                                                                                                7
Drivers of EDP’s Value Gap
    Given its highly attractive asset mix, EDP has a unique opportunity to transform itself into
    an “ideal utility” attracting a premium valuation

                             Excessive leverage                                                                                                                       Underinvestment in growth

At 4.0x1 Net Debt/EBITDA, EDP has one of the                                                                                                             EDP should take advantage of significant growth
highest levels of leverage in the industry                                                                                                               potential in renewables
resulting in excessive interest costs
                                                                                                                                                         Growth restrained by:
Interest costs additionally penalised by:                                                                                                                (1) Suboptimal leverage position
(1) EDP Brasil’s high cost of debt                                                                                                                       (2) Unfocused portfolio with different business units
(2) Legacy debt priced off substantially higher                                                                                                          competing for capital resources of the EDP group
Portuguese spreads

The leverage directly constrains:
(1) The pursuit of growth opportunities
(2) Shareholder remuneration through dividends

                                                                                                                   Conglomerate discount
                                                                                               EDP’s high-multiple business units are diluted
                                                                                               by lower-multiple divisions
                                                                                               EDP’s four main business units already operate as
                                                                                               standalone entities, with limited synergies gained from
                                                                                               being part of a single group
                                                                                               Opportunity to optimise portfolio, close discount and
                                                                                               capture value

1 Based   on Bloomberg consensus EDP 2019E EBITDA as of 8 February 2019 and net debt as per EDP’s 9M 2018 report

                                                                                                                                                                                                                 8
CTG’s Bid:
Hindering EDP’s
Growth

                  9
CTG’s Bid Met with Immediate Scepticism

CTG made a preliminary announcement for the launch
                                                                                                                                                   “. . .[W]e struggle to see how CTG will get all the authorisations the offer is
of a tender offer for the acquisition of the shares of EDP on 11                                                                                   subject to. . .”
May 2018. Problems with the bid were immediately apparent.
                                                                                                                                                   “[T]he bid has a low probability of success . . . and the premium offered for
Unacceptable price                                                                                                                                 the acquisition is not impressive. . .”

Offer price of €3.26 per share, representing a premium                                                                                             Kepler, 14 May 2018
of just 4.8%1
                                                                                                                                                   “. . . [W]e do not see CTG agreeing to sell the U.S. renewable business of
17 CPs with no commitment to resolve any concerns                                                                                                  EDP to rescue the deal”
• 15 different anti-trust, foreign investment, energy regulatory
                                                                                                                                                   JP Morgan, 14 May 2018
  or other approvals or confirmations
• Amendment to EDP’s bylaws to lift the cap on 25%                                                                                                 “EDP’s crown jewels are the renewable assets in the U.S., which are owned
  voting interest                                                                                                                                  in the portfolio of EDPR. CTG knows that they would not get approval from
• Registration of the offer with CMVM                                                                                                              CFIUS to keep them should they own a majority stake in EDP, one of the
                                                                                                                                                   sources said”
No mention of how unbundling restrictions² will be managed                                                                                         Reuters, 26 June 2018

No long-stop date
                                                                                                                                                   “We believe that, while the possible disposal of the US wind assets would not
Further regulatory conditions identified post announcement                                                                                         come as a surprise, the EU raising the issue of unbundling could possibly
                                                                                                                                                   derail the transaction”

                                                                                                                                                   Credit Suisse, 28 January 2019

1 Over   the closing share price of EDP on the day of the Preliminary Announcement by CTG (announcement made after market closed); 2 Unbundling Regime in Directive 2009/72/EC (‘Electricity Directive’) and Directive 2009/73/EC (‘Gas Directive’)

                                                                                                                                                                                                                                                      10
CTG’s Bid Fails to Deliver Fair Value

                                                                                 CTG bid price vs. EDP’s management assessment of adequate value1

      Premium to CTG bid:                                                                           21%-34%                                  38%-43%           35%

                                                                                                                                               4.66

                                                                                                         4.35

                                                                                                                                               4.49           4.41
                                                                                                         3.95

                                    3.26

                                  CTG bid                                                          Public market                              Precedent      Precedent
                                                                                                      premia 2                               transaction    transactions
                                                                                                                                              multiples 2   based SOTP 2

1   Calculations based on Report of the Executive Board of EDP published on 8 June 2018; 2 EV to Equity bridge as per EDP’s 9M 2018 report

                                                                                                                                                                           11
CTG’s Bid Has Failed to Make Progress
    No clear communication or apparent effort to resolve extensive regulatory issues

Already one of the longest M&A processes in the utilities sector
• It has been over 278 days since announcement vs. the average utilities deal notified to the EC taking 68 days
   between announcement and EC filing, and 162 days between announcement and closing1
• After 9 months, only 1 anti-trust approval received… 16 of the 17 conditions still outstanding, with many of them
   not yet filed
CTG has failed to provide any clarity on items identified in the Executive Management Board’s response2 to its bid

                                                                                                                                                                                                                                        CTG response

                          Q:           How will CTG handle EDP’s US assets?

                          Q:           How will CTG resolve unbundling issues?

                          Q:           What assets and on what terms does CTG intend to contribute to EDP?

                          Q:           How can CTG justify a price that significantly undervalues EDP?

1 Based on utilities deals notified to EC in the last 5 years, including those with the following NACE codes: (i) D.35.1 – Electric power generation, transmission and distribution; (ii) D.35.2 – Manufacture of gas, distribution of gaseous fuels through mains; (iii) E.36 – Water collection,
treatment and supply; and (iv) E.37 – Sewerage; 2 Based on Report of the Executive Board of EDP published on 8 June 2018

                                                                                                                                                                                                                                                                                                     12
CTG’s Offer Would Force an Unattractive Break-Up
    Beyond concerns with price and lack of progress, a successful bid would involve
    the loss of EDP’s most valuable assets
CTG will likely have to divest EDP’s US renewables portfolio as well as all of EDP’s Portuguese generation portfolio,
resulting in less exposure to attractive “green power” generation

                             EDP enterprise value business split today1                                                                                         EDP enterprise value business split if successful CTG bid1

                                                              Spain G&S                                                                                                                                             Spain G&S

                 Portugal G&S                                                           EDP Brasil                                                                                                                                            EDP Brasil

                                                                                                                                                               Potentially
                                                                                                                                                                divested
                                                                                                                                                                 assets
            EDPR US
                                                                                                      Iberian                                                                                                                                              Iberian
                                                                                                     Networks                                                                                                                                             Networks

                              EDPR
                             Portugal                     EDPR RoW                                                                                                                                            EDPR RoW

                                    CTG’s bid would leave EDP weaker, and does not envisage sharing likely substantial capital gains realised
                                                      through the disposals in US and Iberia with other EDP shareholders

1Total EV as per EDP market value as of 8 February 2019 and 9M18 balance sheet items. EDPR and EDP Brasil EV as of 8 February 2019 and 9M18 balance sheet items. EDPR split by region pro-rata LTM 9M18 EBITDA. Iberian networks EV in line with Southern European peers’ (Red
Electrica, Enagas, Snam, Terna) average EV/EBITDA multiple applied to 9m18 LTM EBITDA. Remainder attributed to Iberian Generation & Supply, split by generation capacity for Portugal and Spain

                                                                                                                                                                                                                                                                                 13
EDP Has Lagged Peers Since CTG’s Bid was Announced

                                                                     Total shareholder return since CTG made its bid on 11 May 2018

      “Given the lack of clarity on some of these [aspects of the offer] and on the
      evolution of the offer, management postponed the update on its business
      plan, expected in 2H18, until it has a clearer view on a transaction”

      Morgan Stanley, 27 July 2018

                                                                 9%
                                                           underperformance
        Average1: 11%                                         vs. average1

                                                                                                                                       19%   20%
                                                                                                                 16%             17%
                                                                                                 12%

                                                                                  6%
                                             2%                 2%

              (1%)

Source: Bloomberg as of 8 February 2019. 1 Excluding EDP

                                                                                                                                                   14
CTG’s Bid is Not in the Best Interest of EDP Stakeholders
    CTG has shown neither the commitment nor the conviction in securing this bid

The price is too low
• EDP Executive Board’s assessment puts adequate bid price in €3.95-4.66 range1
• Elliott believes common-sense reforms focused on accelerating investment and optimising EDP’s portfolio can generate stand-alone value
      well in excess of CTG’s bid price

The effort is not evident
• CTG has made no progress in addressing questions from EDP
• CTG has made no progress in resolving regulatory concerns across the globe
• CTG has made no sustained, affirmative case for the merits of its proposal
         − CTG has not made any public communication related to its offer since the announcement itself

The plan is suboptimal
• The substance of the structural changes to EDP that would be required for a successful CTG takeover involves a number of unattractive
      divestments, including the sale of EDP’s US renewables portfolio
• CTG doesn’t envisage sharing substantial capital gains likely to be realised in the process of regulatory disposals with other EDP shareholders
• CTG’s plan leaves EDP weaker: more volatile; a less attractive asset mix; and fewer growth opportunities

                                      The process has stalled, an unattractive offer is not in the best interest of EDP stakeholders

1 Calculations   based on Report of the Executive Board of EDP published on 8 June 2018

                                                                                                                                                    15
A Promising
Alternative Pathway:
Invest and Optimise

                       16
An Empowered EDP Can Break the Current Impasse
Neither CTG’s bid nor the status quo offers a promising future for EDP
• The status quo prolongs a sustained value gap
• CTG’s bid reinforces that value gap, leaving EDP weaker: more volatile; a less attractive asset mix;
  and fewer growth opportunities

There is a better way forward: Invest and Optimise
• Invest in growth in core areas at attractive rates of return
• Optimise the portfolio to reduce excessive leverage and re-focus on areas where EDP has core
  know-how and more attractive return opportunities

This new EDP— more focused, committed to growth and less levered—offers an “ideal utility” to drive
re-rating
• EDP could offer an industry-leading asset mix, attractive financial metrics, and clear growth story—all
  of which would likely drive re-rating and deliver significant upside for all stakeholders

                                                                                                            17
Invest in Growth
    EDP growth in renewables has been constrained by shortage of capital

                                                                         EDP has not been able to keep pace with renewables build-out

                                                                                                                                        EDP has added c. 5 GW of renewables capacity
              25%
                                                                                                                                        in the last 8 years
                                                                  22%
                                                                                                                                        If not for the shortage of capital, capacity
                         20%                                                                                                            deployment could have potentially been much
                                17%               18%                                                                                   quicker
                                                                                                       16%                              • In 2009 EDP targeted 10.5 GW of installed
                                                                                           15%
                                                                                                                   14%                     capacity by 2012 (increase of c. 5 GW)
                                                                                                                                  13%
                                           12%                                 12%                                                      • EDP achieved this target only in 2017 when
       10%                                                                                                                                 its installed capacity reached 11 GW
                                                                                                              8%
                                                            7%            6%          6%          7%
                                                                                                                          6%             “EDP plans to keep deleveraging, at least
                                                                                                                                         until it moves to a BBB credit rating . . .
                                                                                                                                         implying . . . tight control of capex, which
                                                                                                                                         would delay a pick up in profit growth”
                                                                                                                                         Morgan Stanley, 21 November 2017
          2009              2010              2011           2012          2013        2014        2015         2016        2017

                                                                                                                                  1
                 EDPR annual capacity growth                     Wider EMEA & Americas wind & utility PV annual capacity growth

         With market-leading, highly experienced project execution capabilities, EDP needs to be able to fully realise the opportunity set in renewables

Source: EDPR annual reports; Bloomberg New Energy Finance
1 Includes onshore & offshore

                                                                                                                                                                                        18
Invest in Growth
       Elliott believes EDP can build 2 GW of renewables per annum at attractive rates of return

                                                            An abundance of projects in the pipeline could be accelerated with sufficient resources

• EDP has a strong pipeline of 3.01 GW,                                                            EDP’s Annual Capacity Additions (GW)
       including      1.02    GW in the US                                                         2.0
• With increased financial flexibility and
       focused resource dedication, EDP should be
       able to substantially increase annual
       renewables capacity additions to cement its                                                 1.5
       existing market position
       − Market is expected to grow3 at 11%-15%
         p.a. in 2019/2020 implying EDP needs to
                                                                                                   1.0
         be adding c. 1.7GW of capacity to grow in
         line with market
• Accelerated capacity deployment should be
       possible through a combination of:                                                          0.5
       − Tapping into over 3 GW of existing
         pipeline in North America which is
         currently in pre-development stage
                                                                                                   0.0
       − Moving forward the construction of
                                                                                                                                    2019                                                    2020                                                    2021
         selected projects currently scheduled
         for 2022 – 2024                                                                                          North America                       Europe                  Potential additions assuming no capital constraints

1 Asper EDPR 9M 2018 presentation, net to EDPR’s equity stakes; 2 As per EDPR 9M 2018 presentation, excludes Turtle Creek and Meadow Lake VI which were completed in 2018, adjusts for 80% stake sales of Prairie Queen and Nation Rise in December 2018; 3 Bloomberg New Energy
Finance. Based on EMEA and Americas onshore & offshore wind and utility PV

                                                                                                                                                                                                                                                                                   19
Invest in Growth
    Historical returns demonstrate investment in renewables has been very profitable

                                                Total shareholder return over last five years

                                                                                                92%

                                          50%

Source: Bloomberg as of 8 February 2019

                                                                                                      20
Optimise Portfolio: Sell EDP’s 51% Stake In EDP Brasil
    Given existing capital constraints, EDP is not the right owner for EDP Brasil (“EDPB”)

• EDPB is an attractive asset:                                                                             EDP Brasil’s main business divisions remain sub-scale and would benefit from a committed owner
     − Clear growth story driven by increasing                                                     Generation (Installed capacity, GW)1
       electricity demand and electrification                                                                                                                                                                                                                        7th
                                                                                                                                                                                                                                                              Largest Private
• However, EDPB is sub-scale: neither a market                                                      10
                                                                                                                                                                                                                                                                Generator¹
     leader nor a credible challenger                                                                 5
     − Due to EDP’s capital constraints, EDPB has                                                      -
       been lagging behind peers in terms of
       growth capex
• EDPB introduces exposure to volatility of BRL                                                    Distribution (2017 Pro-forma Energy Billed, TWh p.a.)2
     into EDP’s hard currency earnings                                                              75
                                                                                                                                                                                                                                                                     9th
                                                                                                    60                                                                                                                                                        Largest Private
• Brazilian exposure attracts higher WACC,                                                          45                                                                                                                                                         Distributor2
     which is reflected in lower trading multiple and                                               30
                                                                                                    15
     as a result dilutes EDP’s multiple                                                               -

Potential to unlock value in M&A scenario as                                                       Investment (2017 Capex, R$bn)3
EDPB is an ideal target for strategic player with                                                                                                                                                                                                              EDPB
                                                                                                       4
sufficient resources to drive future growth
                                                                                                       3                                                                                                                                    underinvestment
                                                                                                       2                                                                                                                                                   noticeable
  “historical discount to private names… based on
                                                                                                       1
  poor capital allocation, unexpressive operational
                                                                                                       0
  efficiencies and lack of a clear strategy”
  Itaú BBA, 31 January 2019

Note: Benchmarking excludes state-owned companies and Eletrobras; 1 Source: Company websites and latest earnings reports; 2 Source: ANEEL “Consumo de Energia Eletrica”. ENEL includes Eletropaulo Metropolitano. Neoenergia includes Elektro Redes. EDPB includes minority stake in
CELESC; 3 Source: Company annual reports and presentations. Capex as reported, Enel excludes Eletropaulo Metropolitano capex; EDPB excludes CELESC capex

                                                                                                                                                                                                                                                                                       21
Optimise Portfolio: Sell EDP’s 51% Stake in EDP Brasil
    EDP’s stake in EDP Brasil can be sold at a substantial premium to current trading value

                   Over 75% upside and €2.3bn proceeds                                                                                               There should be considerable demand for a Brazilian utility like EDPB

                                      c.€0.27bn LTM
                                      EBITDA at 11x¹                                                                                                 “The Chinese government run State Grid has R$15bil available for
                                                                                                                                                     investing in Brazil, where it has built a position in the power transmission
                                                                                                                                                     segment, while now the goal would be power distribution”

                                                                                                                                                     Folha de São Paulo, 8 March 2016

                                              €3.0bn
                                                                                                                                                     “Enel will reinforce its focus on markets where it has an integrated
                                                                                                                                                     presence such as Italy, Spain, Chile and Brazil”
       2,991 MW at
       €0.9m/MW¹
                                                                                €5.6bn                                                               Enel New Strategic Plan 2019-21, 15 November 2018

                                                                                                                                                     “We also have the ambition to grow our activities in other areas such as
                                                                                                                                                     Latin America, Brazil and Mexico”
            €2.6bn                                                                                                €2.3bn                             Engie Investor Workshop, June 2017

                                                                                                                                                     “Iberdrola… plans to invest somewhere between R$25 billion and R$30
                                                                                                                                                     billion in the country by the end of 2023… ‘Our bet on this country is
        Generation                      Transmission,                   Enterprise value                   51% EDP stake                             clear. What the government is telling us sounds good’ [CEO Ignacio
                                        Distribution &                                                      equity value 2                           Sánchez Galán] emphasised”
                                            Supply
                                                                                                                                                     Valor Econômico, 23 January 2019

Note: As of 8 February 2019; 1 Capacity as per Q318 EDPB earnings. Transmission, distribution & supply LTM EBITDA sourced from EDP “Key Data 2017-18”. Based on average precedent transactions multiples: Generation transactions: CESP / CPPIB & Votorantim (Oct 2018); EDPB (132MW
small hydro) / Statkraft (Oct 2018); Gerdau (Barra dos Coqueiros and Caçu) / Kinross (Feb 2018); Paranapanema Gera / China LAC (Dec 2016); Neoenergia (stakes in six projects) / ContourGlobal (Nov 2016); Duke Energy (2.09GW hydro) / CTG (Oct 2016); Itapebi Geracao de Energia /
Neoenergia (Feb 2014); EDPB (Jari and Cachoeira Caldeirao) / CTG (Oct 2013). Other businesses transactions: Eletropaulo / Enel (Apr 2018); AES Sul / CPFL (Jun 2016); 2 Implies R$31 per share

                                                                                                                                                                                                                                                                                  22
Optimise Portfolio: Sell EDP’s 51% Stake in EDP Brasil
    Recent Brazilian utility transactions have commanded substantial premia

                                                                                                          Premium to undisturbed price (%)1

  Implied EV/EBITDA multiple2                                                      12.2x                                                                                                     11.4x

                                                                                                                                                                                             175%

                                                                                     62%

                                                                   State Grid acquisition                                                                                    ENEL acquisition of
                                                                      of CPFL Energia                                                                                    Eletropaulo Metropolitana

Source: Bloomberg, Eletropaulo Investor Pres (5 June 2018); CPFL Renovaveis Price Justification Document (12 September 2018); Folha de São Paulo; 1 CPFL Energia undisturbed price as of 7 March 2016; Eletropaulo Metropolitana undisturbed price as of 26 Feb 2018; ² CPFL Energia
Implied EV/LTM EBITDA 12.2x (based on LTM EBITDA as of 1Q16); Eletropaulo Metropolitana EV/LTM EBITDA 11.4x (based on 2017 EBITDA pre-pension)

                                                                                                                                                                                                                                                                                       23
Optimise Portfolio: Sell a 49% Stake in EDP’s Iberian Electricity Distribution
    EDP should take advantage of significant demand from infrastructure investors who value
    networks assets at a substantial premium to the public market
Iberian Networks is a fully regulated asset with long-duration cash flows; Sale of a 49% minority stake would
be one of a limited number of remaining opportunities for financial investors to deploy capital in this space

                                                                                                                                              • Brokers value EDP’s Iberian Networks at 7-10x LTM
                                                                                           €7.2bn                                                  EBITDA¹
                              €6.7bn                                                                                                          • Precedent transactions Portuguese networks assets
                                                                                                                                                   traded for 11x LTM EBITDA²
                                                                                                                                              • Recent upgrade of Portugal‘s sovereign rating to
                              €4.7bn                                                                                                               investment grade, makes EDP’s assets very attractive to
                                                                                                                                                   a large number of buyers
                                                                                                                                              • Distribution assets provide attractive yield to
                                                                                                                                                   infrastructure investors, irrespective of control

                                                                                                                                                    “We estimate that both the Portuguese and the Spanish networks
                                                                                                                                                    could be sold at a combined price of €7.4bn. We have used M&A
                                                                                                                                                    multiples from previous transactions in Europe. We use an average
                                                                                                                                                    multiples of 11.3x EV/ EBITDA 18e related to gas & power network
                  Brokers value today                                              Value from sale                                                  transactions in the last eight years”

                                                        Low            High                                                                         Macquarie, 19 October 2018

Note: Enterprise value for Iberian Networks based on brokers multiple range of 7-10x LTM EBITDA and 11x LTM EBITDA transaction multiple on Iberian Networks LTM 3Q18 EBITDA €657m; 1 EV/EBITDA LTM EBITDA multiples from: Goldman Sachs (8 Jan 2019), RBC (26 Nov 2018),
Macquarie (19 Oct 2018), JP Morgan (14 May 2018), UBS (15 Aug 2018), Credit Suisse (28 Jan 2019), HSBC (15 May 2018), Morgan Stanley (2 Mar 2018); 2 EV/LTM EBITDA transaction multiple for Ren acquisition of EDP Gas per Ren investor presentation (April 2017)

                                                                                                                                                                                                                                                                           24
Optimise Portfolio: Sell a 49% Stake in EDP’s Iberian Electricity Distribution
    Naturgy’s sale of a minority stake in its Spanish gas distribution to a consortium of financial
    investors proves there is significant upside potential to public market-implied valuation
                                                          Naturgy sale of a 20% stake in Spanish gas distribution to CPPIB and Allianz
                                                crystallised an implied €4bn / + 40% valuation uplift vs. public market valuation at the time

                                                                                       +€4.0bn                      €13.9bn
                                                                                        +4.5x                       ~15.7x1

                                                                 €9.9bn
                                                                 ~11.2x1

                                                          Research analysts SOTP                               Transaction terms

                          Public market values Iberian Networks at EDP’s cost of capital, whereas a minority stake sale
           can raise significantly more proceeds from yield-seeking infrastructure investors. EDP has been a beneficiary of a similar
                       arbitrage when it sold Naturgas at a substantial premium to market-implied valuation at the time
Source: Gas Natural Fenosa 9M 2017 results presentation
1 EV/EBITDA 2016

                                                                                                                                                25
Optimise Portfolio: Sell Legacy Thermal Assets in Iberia
   Legacy thermal power plants in Iberia are non-core and undercut EDP’s
   otherwise green equity story
                                    A disposal of a thermal portfolio in Iberia that is non-core to EDP is consistent with Management’s strategy

• Thermal assets are marginal from the perspective of a worldwide                                                           Installed capacity (MW)
  renewables market leader and one of the greenest power generators in
  Europe                                                                                                                    12,000
• Disposal of the thermal fleet would:
    − Result in a more focused and cohesive asset mix                                                                       10,000
    − Free EDP up to invest further in high return renewables capacity
    − Allow EDP to close valuation gap between the current implied value of
       EDP’s thermal portfolio and its M&A value                                                                              8,000
• Even without the thermal portfolio, EDP will remain Portugal’s leading
  power producer and continue to benefit from expected strong baseload                                                        6,000
  prices

                                                                                                                              4,000
  “We are trying to reduce everything that is either subscale or as is in the case
  of Brazil very far away from the rest of our business. And in the case of
  Portugal, the rationale is, of course, in the subscale elements, crystallising                                              2,000
  value, reduce also our exposure to a market where, if anything, we are basically
  too big and also having more money to invest where we make the difference.
  So I think it's more or less obvious. It goes also in the same direction, as we                                                     -
  have seen, we have sold Portgás in Portugal. So I believe that if you had all
  this, it shows clearly a strategy of focus”

  Antonio Mexia, 9 November 20181                                                                                                                                   CCGT   Coal   Nuclear

Source: Company websites and filings, including 2017 Endesa annual report, 9M 2018 databook for EDP and Naturgy, Iberdrola website; 1 EDP’s Q3 2018 earnings call

                                                                                                                                                                                            26
Optimise Portfolio: Sell Legacy Thermal Assets in Iberia
    A sale of a portfolio of power generation assets in Iberia can be done at attractive valuation

Potential to unlock at least €1.7bn of proceeds to double down on Core EDP
                   Conventional generation viewed as supplementary
                                                                                                                                                             But opportunity to unlock value with a private market sale…
               to core hydro assets, with few brokers breaking out value
  Broker valuation for coal, CCGT and nuclear assets¹ (€bn)
                                                                                                                                                                                 Average multiple                       EDP metric                        Potential value

                                                                                                                                                                                                                      €0.2bn LTM
                                                                                                 1.2                                               EV/EBITDA                              8.5x3                                                               ~€1.7 bn
                                                                                                                                                                                                                       EBITDA²

                                 0.8                                                                                                               EV/MW                           €0.4m4 / MW                            6.3GW                               ~€2.4 bn

                                                                                                                                                                               …especially given superiority of EDP’s
                            Macquarie                                                          Exane                                                                        assets vs. other opportunities in the market

    “…If we take the mid-point of both transactions and apply it to the hydro                                                                      “…the most efficient plant                                            “strong coal fleet that is clearly
    fleet of EDP Iberia (7.3GW) and assume the remaining capacity, plus                                                                            in Iberia…”                                                           the most efficient in Iberia. In our
    customers, at an EV of nil, the total EV of [EDP Iberia Power Generation &                                                                                                                                           view, EDP’s coal fleet is going to
    Supply] would stand at almost €10bn, equivalent to an EV/EBITDA 2019E                                                                                                                                                remain at an advantage in the
    multiple of ~11x.”                                                                                                                                                                                                   short term...”

    UBS, 12 December 2018                                                                                                                          UBS, 12 December 2018                                                 RBC, 26 November 2018

1 Macquarie  equity research (19 Oct 2018); Exane equity research model (Nov 2018); 2 LTM EBITDA calculated as of 9M18 as per “EDP Key Data 2017-2018”. Conventional gross profit calculated quarterly using total volume average selling price post-hedging applied to own generation
CCGT, coal and nuclear output minus each technology’s respective variable cost per MWh. EBITDA calculated quarterly by applying total Iberian generation & supply gross profit to EBITDA margin on conventional gross profit; 3 Average EV/LTM EBITDA transaction multiple based on: T-
Power acquisition (Tessendro ING research, 13 Jun 2018); Eon Spain (Gas Natural Morgan Stanley research, 6 May 2015); Marcinelle (Mergermarket); Naturgy Global Power Generation 25% stake (Oct 2015); 4 Average EV(€m)/MW transaction multiple based on: Scottish Power (Drax press
release, 16 Oct 2018); T-Power (Tessendro ING research, 13 Jun 2018); Viesgo (June 2018); GPG (Naturgy press release 30 March 2015 and 2016 annual report); Engie (Engie press release, 31 Oct 2017); Centrica (Centrica press release, 21 Jun 2017); Eon Spain (Societe Generale equity
research, 28 Nov 2014); Marcinelle (Mergermarket)

                                                                                                                                                                                                                                                                                      27
Reduce Financial Leverage: Lower Cost of Debt
       Deleveraging would result in lower cost of debt and more favourable ratings metrics

                           Reduction of cost of debt                                                        Ratings impact

• Prudent leverage will increase key ratings metrics
• Sale of EDP Brasil will additionally lower cost of debt    “The rating could be upgraded in the event that                            Upgrade threshold
                                                             improving conditions were to be reflected in more
        − EDP average cost of debt: 4.1%                     rapid and extensive deleveraging than currently
        − EDPR average cost of debt: 4.0%                    contemplated, such as would be reflected in                                                       20%
                                                                                                                               15-17%
        − EDP Brasil average cost of debt: 11.1%             RCF/net debt in the mid-teens and FFO/net debt
                                                             of around 20% on a sustainable basis.”
                                                                                                                        Current FFO / net debt        New EDP FFO / net debt
                                                             Moody’s Credit Opinion, 7 August 2018

                                                            Scope to reduce EDP’s cost of debt in line with peers

2022 debt maturities average spread to sovereign (bps)1

                                              83

                                                                                          60
                                                                                                                                                 52

                                          Baa3 / BBB-                               Baa2 / BBB                                          Baa1 / BBB+

1   Source: Bloomberg as of 8 February 2019

                                                                                                                                                                               28
Summary of Key Measures to Unlock Value and Empower EDP
   A New EDP—more focused, committed to growth and less levered—will deserve a premium
   valuation as an “ideal utility”

                                         Portfolio optimization                                                                                                 Investments in growth and leverage reduction

                          Sell 51.2% EDP Brasil Stake: +€2.3bn                                                                                            De-lever to 3.0x net debt / pro-forma EBITDA: €2.8bn

                                                                                                                                                                             Free up additional €3.5bn to invest
     Sell 49% minority stake in Iberian networks: +€3.6bn
                                                                                                                                                                             in high return renewables pipeline1

               Sell conventional Iberian generation: +€1.7bn                                                                                              Double down in Core EDP with €1.2bn share buyback

                                                                                                                                  €7.6bn

                                                                                                           Total value crystallised
                                                                                                      and re-deployed to empower EDP

1Assumes   projects deployed 50/50 in 2020 and 2021. Average project unlevered return of 10%, LTV of 25%, 3.4% cost of debt. $1.5/MW cost with 12-month construction phase

                                                                                                                                                                                                                   29
EDP’s Contrasting
Futures

                    30
EDP’s Contrasting Futures

                                                                                                                                                                                                                                             4.33

                                                                                                                                                                                                                                              3.79
                                                                                                 3.16                                                                  3.26

                                                                                                                1
                                                                                           Status quo                                                               CTG bid                                                      New EDP
                                                                                                                                                                                                                                                   2
                                                                                                                                                                                                                        (Invest and Optimise Plan)

    Prudent leverage

    Strong presence in renewables

    Growth in earnings / dividends                                                                 /                                                                      /                                                                     /

    Significant presence in Portugal

1EDP share price as of 8 February 2019; 2 Assumed New EDP valuation range on December 31, 2019 based on: (1) Current Iberian peers P/E FY2 (2020E) of 14.4x and assumed New EDP EPS FY2 (2021E) of EUR 0.26; (2) Current European peers Dividend Yield FY2 (2020E) of 5.5% and
assumed New EDP DPS FY2 (2021E) of EUR 0.24

                                                                                                                                                                                                                                                                                 31
The Status Quo vs. A New EDP

                       Improved Business Mix – 2022E Contracted EBITDA¹                                                                                                    Improved Growth – 2019-22E EBITDA Growth

                                                                                                   76%                                                                                                                                           7%
                                    56%
                                                                                                                                                                                  2%

                          EDP Status Quo 2                                                     New EDP 3                                                               EDP Status Quo 2                                                     New EDP 3

                             More Prudent Leverage – Net Debt / EBITDA                                                                                                  Shareholder Remuneration – 2019-22E DPS CAGR

                4.0x 4.0x                       3.9x                                                                                                                                                                                            11%
                                                        3.0x                    3.4x 3.1x                      3.3x 2.9x

                                                                                                                                                                                  0%

                  2019E                           2020E                          2021E                           2022E                                                 EDP Status Quo 2                                                     New EDP 3
                                                EDP Status Quo 2                   New EDP 3

1Includes EUR, USD and CAD long term contracted and regulated EBITDA; 2 EDP Status Quo broker average based on broker consensus adjusted to include 2022 projections for UBS, Credit Suisse and Morgan Stanley; 3 New EDP assumes: (1) EDP Brasil stake sold for EUR 2.3bn; (2) 49%
stake in Iberian Networks sold for EUR 3.6bn; (3) Iberian thermal generation sold for EUR 1.7bn; (4) Debt pay-down of EUR 2.8bn; (5) 10% of outstanding shares bought back at EUR 3.26 per share for a total of EUR 1.2bn; (6) Assumes EUR 3.5bn of equity investments into growth
renewables projects deployed 50/50 in 2020 and 2021. Average project unlevered return of 10%, LTV of 25%, 3.4% cost of debt. $1.5/MW cost with 12-month construction phase; (7) 90% dividend payout ratio

                                                                                                                                                                                                                                                                                      32
A New EDP Will Be a Highly Attractive Iberian Utility: EBITDA Exposure
     Highest exposure to growing renewables business with presence in attractive,
     stable markets with primarily EUR and USD revenues
                                                                                                                                                    EBITDA Business Mix

                                                                                                     17%                                                            13%                                                            13%
                                                                                                                                                                                                                                                                                        Other
                                                                                                                     1%
                                       54%                                                                                                                          21%                                                                                                                 Retail

                                                                                                     58%                                                                                                                                                                                Renewables
                                                                                                                                                                                                                                   72%
                                       23%                                                                                                                          57%                                                                                                                 Networks
                                                                                                                                                                                                                                                                                        Generation (Mostly Thermal)
                                       23%                                                           22%
                                                                                                                     2%                                              9%                                                            15%                                                  Generation (Mostly Hydro)
                                                                                                                       2                                                               3                                                               4
                                 New EDP 1

                                                                                                                                                 EBITDA Geographic Mix

                                                      2%                                                                                                                           1%
                                                                                                                                                                    15%                                                            14%                                                  Other
                                       20%
                                                                                                                                                                    25%                                                            35%                                                  LatAm
                                                                                                                                                                                                                                                                                        North America
                                                                                                    100%
                                       79%                                                                                                                                                                                                                                              Europe
                                                                                                                                                                    58%                                                            51%

                                 New EDP 1

Sources: Report of the Executive Board of EDP published on 8 June 2018, Companies’ reporting; 1 New EDP based on brokers forecasts for 2020E assuming sales of: (1) EDP Brasil; (2) 49% stake in Iberian Networks and (3) Iberian thermal generation; 2 Source: Endesa 2017 annual report. Generation incl. supply. G&S technology split by mainland
territories output. Other includes non-mainland territories G&S and structure, services & adjustments. 3 Source: Report of the Executive Board of EDP. 4 Source: Report of the Executive Board of EDP

                                                                                                                                                                                                                                                                                                                                                   33
New EDP Will Be a Highly Attractive Iberian Utility: Key Financial Metrics

                                               EBITDA CAGR 2019-22E                                                                                                                            Net Debt / EBITDA 2020E

                                                                                                                                                                                                                                                              Avg 2.8x

                                         7.3%                                                                   Avg 2.9%
                                                                   5.9%
                                                                                                                                                             3.9x                                                 3.6x
                                                                                                                                                                                        3.0x                                                 3.1x
              2.1%                                                                                                                                                                                                                                                      1.8x
                                                                                              1.7%
                                                                                                                         1.0%
                                                   2
       EDP Status Quo1                New EDP                                                                                                        EDP Status Quo1                 New EDP 2

            Dividend Per Share – CAGR 2019-2022E & Payout Ratio 2020E                                                                                                              Earnings Per Share – CAGR 2019-2022E
                                                                                                                                100.5%
                                                90.0%                                                 90.2%
                     78.8%
                                                                           70.1%
                                                                                                                                                                                      7.0%
                                                                                                                                                            5.1%                                                                                               Avg 2.3%
                                                                                                                                                                                                                 5.0%
                                        11.5%                                                                                                                                                                                               3.4%
              0.0%                                                                                              Avg 1.4%
                                                                    5.3%                      5.0%

                                                                                                                        (6.0%)                                                                                                                                        (1.6%)

       EDP Status Quo1                New EDP 2                                                                                                     EDP Status Quo1                 New EDP 2

Sources: Bloomberg as of 8 February 2019; 1 EDP Status Quo based on broker consensus adjusted to include 2022 projections for UBS, Credit Suisse and Morgan Stanley. Bloomberg consensus CAGRs for EDP of: 0.8% (EBITDA); -0.9% (EPS); 0% (DPS); 2 New EDP pro-forma growth assumes:
(1) EDP Brasil stake sold for EUR 2.3bn; (2) 49% stake in Iberian Networks sold for EUR 3.6bn; (3) Iberian thermal generation sold for EUR 1.7bn; (4) Debt pay-down of EUR 2.8bn; (5) 10% of outstanding shares bought back at EUR 3.26 per share for a total of EUR 1.2bn; (6) Assumes EUR
3.5bn of equity investments into growth renewables projects deployed 50/50 in 2020 and 2021. Average project unlevered return of 10%, LTV of 25%, 3.4% cost of debt. $1.5/MW cost with 12-month construction phase; (7) 90% dividend payout ratio

                                                                                                                                                                                                                                                                                          34
A Clear Contrast for EDP’s Future

         Languishing at the                                                        An undervalued bid?                                                                                      Or a new EDP?
        current share price?

                                                                                                                                                                                                                                                                4.33
                                                                                                                                                                          3.79                         3.80                         3.94
                                                                                                           3.26
                               3.16

                          Status quo 1                                                                  CTG Bid                                                    New EDP                        New EDP                    New EDP       New EDP
                                                                                                                                                                @ Iberian Peers                  @ EU Peers               @ Iberian Peers @ EU Peers
                                                                                                                                                                    P/E FY2 3,4                   P/E FY2 2,4             Dividend Yield Dividend Yield
                                                                                                                                                                                                                               FY2 3,5        FY2 2,5
                                                                                                                                                                        Upside from re-rating in excess of average multiple thanks to superior
                                                                                                                                                                        asset mix and financial metrics
1 EDP share price as of 8 February 2019; 2 European peers include: Engie, Endesa, Iberdrola, Enel, Naturgy, E.ON, Innogy (pre-transaction) and Orsted; 3 Iberian peers include: Endesa, Iberdrola, Naturgy; 4 Assumed valuation on December 31, 2019 based on current peers’ average P/E FY2
(2020E) and New EDP EPS FY2 (2021E) of EUR 0.26; 5 Assumed valuation on December 31, 2019 based on current peers’ average Dividend Yield FY2 (2020E) and assumed New EDP DPS FY2 (2021E) of EUR 0.24

                                                                                                                                                                                                                                                                                           35
The Pathway Forward for EDP
Key steps ahead for EDP in order to realise its full potential

Step 1                               Step 2                              Step 3                                 Realising its potential

Realistically assess                 Invite all stakeholders to          Implement EDP’s Invest
CTG’s bid                            take a fresh approach               and Optimise Plan
                                                                                                                    A brighter future
                                     We invite CTG to either: (1)
CTG’s current offer shows
                                     take decisive actions to put its
                                                                         EDP should put forward an                    for EDP as an
no signs of progress, and is                                             ambitious plan to invest
unlikely to be successful in the     offer on track for success, or      and optimise its portfolio                “ideal utility” that
absence of the following:            (2) take a fresh approach
                                                                         Investment in EDP’s current                  commands a
I    Strong commitment to
     resolve regulatory and anti-
                                     Decisive actions are needed
                                     urgently to move beyond the
                                                                         pipeline and key areas of growth
                                                                         (e.g. renewables)
                                                                                                                   premium valuation
     trust issues (e.g. CFIUS)       current impasse
                                                                         Portfolio optimisation through
II   Clarity on CTG’s intentions     All stakeholders stand to benefit   realising the full value of selected
     with regards to resolving the   from a fresh approach which         assets
     unbundling issues               makes EDP stronger
                                                                         Balance sheet optimization with
III Satisfactory detail on                                               reduced levels of debt and
    the strategic plan for EDP                                           enhanced shareholder returns
    and assets CTG intends
    to contribute
IV A revised offer price
   reflecting EDP’s fair value

                                                                                                                                          36
You can also read