RESEARCH Office Vacancy Report - Property Wheel
←
→
Page content transcription
If your browser does not render page correctly, please read the page content below
RESEARCH Office Vacancy Report

Q3   Office Vacancy Report
     October 2018

CONTRIBUTORS

  Copyright SAPOA. Please refer to Disclaimer on back page.

                        T: (011) 883 0679 F: (011) 883 0684
                        Email: marketingmanager@sapoa.org.za   02
                        Web: www.sapoa.org.za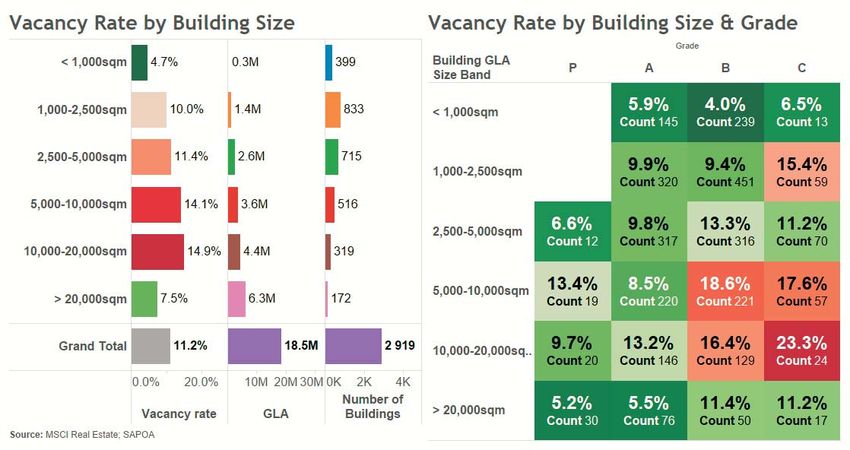
Q3         Office Vacancy Report
           October 2018

KEY FINDINGS
As at Q3 2018, the national office vacancy rate as recorded by SAPOA was 11.2% - up 10bps on the
quarter before. The sticky vacancy rate (especially in the A-grade segment) has seen asking rental growth
slow down to 5.3% y/y Ð down from 6.3% in the quarter before.

On balance, the office sector is still in its recovery phase with the overall vacancy rate moving sideways
and asking rental growth negative in real terms since 2011. This is indicative of the low economic growth
environment coupled with an excess supply in the market.

For the 33 quarters since Q4 2010, there has been only 6 quarters of improving office occupancy rate.
Despite this, the overall office vacancy rate has only increased by 1.5% during this period highlighting
the broadly sideways trend characterising the drawn out recovery phase of the current cycle.

The quarter ending September 2018, saw vacancy rates increase in the B-grade, C-grade & Prime grade
segments while the A-grade office segment saw occupancy rates improve by 40bps. The largest change
was in the Prime office segment with a quarter on quarter deterioration of 120bps to end the quarter at
a 3 year high of 6.7%.

As at the end of Q3 2018, the SAPOA OVS sample included more than 2m sqm of green certified office
space (~22% of total P & A-grade office GLA).

For the quarter ending September 2018, Green Certified Prime & A-grade offices had a vacancy rate
of 4.6% versus the 9.2% of all P &Ê A-grade offices & a premium on its asking rental of 14% (R171/sqm
vs. R150/sqm).

Among the countryÕs five largest metropolitan municipalities, the City of Cape Town still has the lowest
overall office vacancy rate despite a 30bp increase during the quarter. The highest vacancy rate among
the larger metros was the 12.8% recorded for the City of Johannesburg which overtook Ethekwini which
improved to 12.1% after a 120bp improvement.

ItÕs the first time that the City of Johannesburg has had the highest office vacancy rate among the five
largest metros since 2003 when itÕs aggregate vacancy rate topped out at 17.1%.

The report also analyses office vacancy rates by building size. Interestingly, vacancy rates are the lowest
in office buildings smaller than 1,000sqm (4.7%) and larger than 20,000sqm (7.5%) but significantly
higher in the middle tiers.

At the end of the current quarter, developments under construction totaled 544k sqm. This up from the
previous quarter but down significantly from the Q4 2015 peak.

Expressed as a percentage of existing market stock, development activity is currently at 2.9% -off the
6.6% high of Q4 2007. One driver of the decline is that many development schemes are scaling down
speculative building activity and opting to only phase development on a tenant driven basis.

On balance, the office sector is still in its recovery phase with the overall vacancy rate moving sideways
and asking rental growth still negative in real terms since 2011. This is indicative of the current low growth
environment coupled with the significant excess supply still present in the market.

        Copyright SAPOA. Please refer to Disclaimer on back page.

                              T: (011) 883 0679 F: (011) 883 0684
                              Email: marketingmanager@sapoa.org.za                                               03
                              Web: www.sapoa.org.za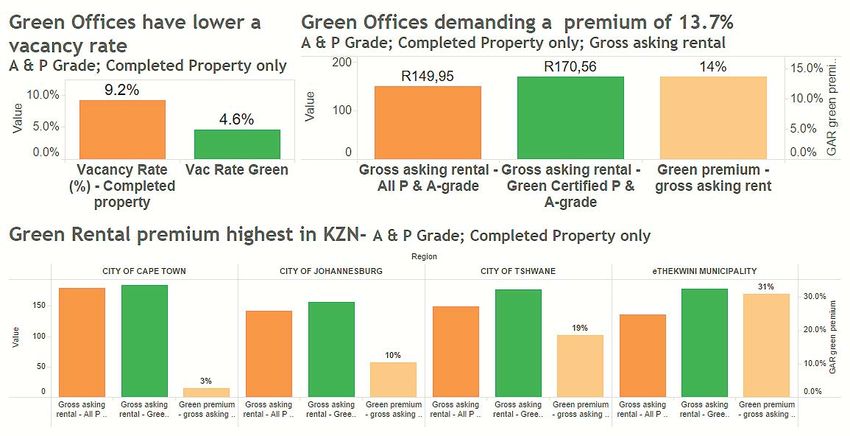
Q3          Office Vacancy Report
            October 2018

HEADLINE RESULTS & DRIVERS
VACANCY RATE UP 10BPS Q/Q
As at Q3 2018, the national office vacancy rate as recorded by SAPOA was 11.2% - up 10bps on the
quarter before. The sticky vacancy rate (especially in the A-grade segment) has seen asking rental growth
slow down to 5.3% y/y Ð down from 6.3% in the quarter before.

On balance, the office sector is still in its recovery phase with the overall vacancy rate moving sideways
and asking rental growth negative in real terms since 2011. This is indicative of the low economic growth
environment coupled with an excess supply in the market. An aggregate of 8.5k sqm of rentable area
(newly completed & existing area) was occupied during the past quarter while 33.8k sqm of stock was
added to the sample- the result: a net absorption of -25.3k sqm.

For the 33 quarters since Q4 2010, there has been only 6 quarters of improving office occupancy rate.
Despite this, the overall office vacancy rate has only increased by 1.5% during this period highlighting the
broadly sideways trend characterising the drawn out recovery phase of the current cycle. Over the same
period, there has been only 4 quarters of negative asking rental growth. However, asking rental growth
has not kept up with inflation and in real (inflation-adjusted) terms has declined by more than 10% over
this period.

The current phase of the office vacancy cycle has been characterised by the occupation of large-scale new
developments- often by single occupiers- while limited private sector employment growth hasnÕt provided
sufficient impetus to counter backfill vacancy.

         Copyright SAPOA. Please refer to Disclaimer on back page.

                               T: (011) 883 0679 F: (011) 883 0684
                               Email: marketingmanager@sapoa.org.za                                            04
                               Web: www.sapoa.org.za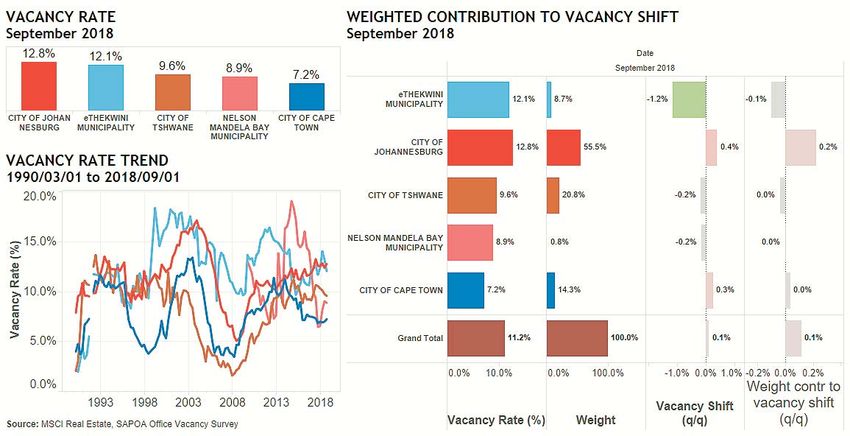
Q3           Office Vacancy Report
             October 2018

HEADLINE RESULTS & DRIVERS
SIDEWAYS TREND REMAINS DESPITE DECLINE
While the level of active new development has been trending down since 2015, the demand for space is
also not growing Ð a situation which is keeping the broad sideways trend in the overall office vacancy rate
in tact. The current cycle is very different to the previous two in that the recovery phase is significantly more
drawn out. From a macroeconomic perspective this is not helped by muted employment growth and negative
business confidence.

To illustrate the level of excess supply present in the market consider that there is currently 2.1 million square
meters available to let in the nodes covered by the OVS - 1.4 million square meters more than in mid-2008

For the overall office vacancy rate to get back to the 5% level (the figure often thought to indicate full
absorption), 1.5m square meters will need to be let given the current gross lettable area of 18.5m sqm.

To put that in perspective, that means letting 325 buildings of 6,400sqm each (the average building size in
the OVS sample) Ð which, given the lack of growth drivers for the sector may see the lacklustre, sideways
trend continue into the medium term.

         Copyright SAPOA. Please refer to Disclaimer on back page.

                               T: (011) 883 0679 F: (011) 883 0684
                               Email: marketingmanager@sapoa.org.za                                              05
                               Web: www.sapoa.org.za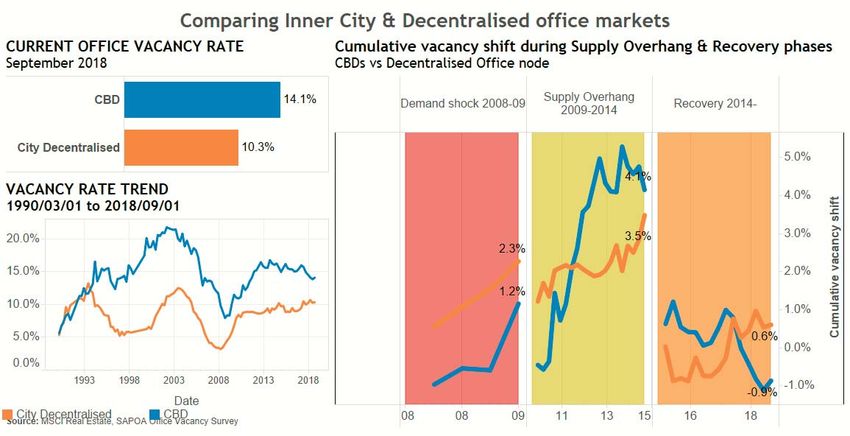
Q3          Office Vacancy Report
            October 2018

HEADLINE RESULTS & DRIVERS
KEY GROWTH DRIVERS NOT ADDING IMPETUS
The recovery of the office sector remains fragile with a lack of growth drivers to stimulate headline improvement.
Absorption of vacant space in one node is seemingly still being offset by vacancies elsewhere with the risk
associated with backfill vacancy still very much present. The fact that inflation-adjusted asking rental growth
has remained negative since 2011 suggests that occupancy gains has likely come at the expense of rental
growth. That said, some nodes remain resilient and are bucking the trend.

Gross fixed capital formation by the business & financial services sector -a key leading indicator for office
occupancy- though only marginally positive, has been positive for five successive quarters which reduces
the probability of near term deterioration in occupancy levels. Business confidence, while off the lows of 2017,
remains below ÒneutralÓ at 38 points- implying an overall negative sentiment among business executives. For
the 40+ quarters starting March 2008, business confidence has only peaked up above 50 for 4 quarters (a
max of 55)- so it would not be unreasonable to assume that industry decision makers are maintaining a
selective approach to capital allocation Ð especially expansionary. A sustained improvement in the office
vacancy rate relies on a strengthening of these macroeconomic drivers so in summary, the office sector still
faces a range of headwinds not least of which is economic growth and job creation.

The graphic below illustrates the cumulative change in real GDP, private sector employment growth and
vacancy rate. The key takeaway from the graphic is that economic growth itself is not enough to drive down
the office vacancy rate. In the absence of jobs growth, vacancy rates tend to drift sideways even during times
of economic expansion as was the case since 2011.

         Copyright SAPOA. Please refer to Disclaimer on back page.

                               T: (011) 883 0679 F: (011) 883 0684
                               Email: marketingmanager@sapoa.org.za                                             06
                               Web: www.sapoa.org.za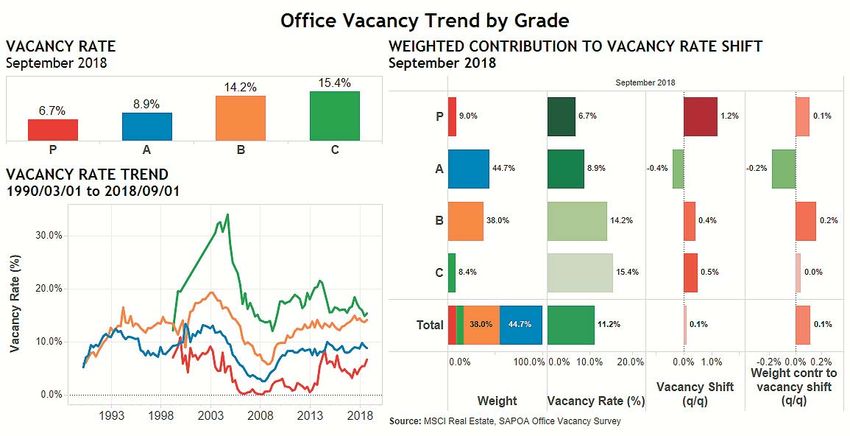
Q3           Office Vacancy Report
             October 2018

HEADLINE RESULTS & DRIVERS
CAPITAL INVESTMENT POSITIVE BUT SLOWING
History suggests that the downward trending financial & business capital investment poses a risk to office
occupancy rates in the short to medium term. Going back to 1990, capital investment has been strongly
correlated to the office vacancy cycle The graphics below illustrates the relationship between business capital
investment, GDP growth and the office vacancy rate (y/y change).

Occupiers choosing not to allocate capital to expansion and effectively adapting a wait-and see approach
allows supply to catch up to demand thus weighing on the vacancy rate and by consequence asking rental
growth and investment returns. Capital investment into financial & business services while still in the low single
digits have been positive for the last six quarters which lowers the probability of any meaningful deterioration
in the vacancy rate.

The previous economic cycle saw a strong recovery in capital investment (period Õ04-Õ07) Ð driven by robust
GDP growth while current GDP growth forecasts suggests at best a more moderate upturn in economic growth
possibly reaching 2% year-on-year growth by 2020. This makes the base case scenario for the current cycle
a more protracted, bumpier office vacancy recovery relative to the 2004-2008 cycle which benefited from a
prolonged streak of a 5% GDP growth.

          Copyright SAPOA. Please refer to Disclaimer on back page.

                                T: (011) 883 0679 F: (011) 883 0684
                                Email: marketingmanager@sapoa.org.za                                           07
                                Web: www.sapoa.org.za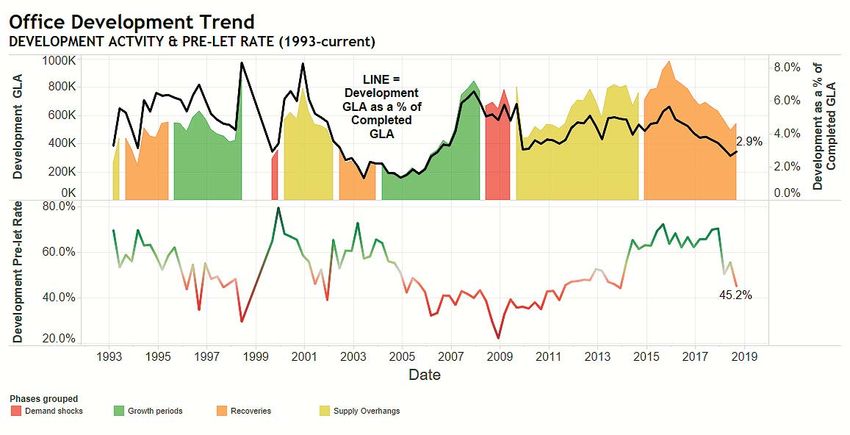
Q3          Office Vacancy Report
            October 2018

OFFICE VACANCY & RENTAL GROWTH
BY GRADE
The quarter ending September 2018, saw vacancy rates increase in the B-grade, C-grade & Prime grade
segments while the A-grade office segment saw occupancy rates improve by 40bps. The largest change
was in the Prime office segment with a quarter on quarter deterioration of 120bps to end the quarter at a 3
year high of 6.7%.

Despite a 50bp vacancy increase in the current quarter, the C-grade office segment remain the most improved
over the past 5 years. This improvement has in part driven by residential conversions Ð a common trend at
this part of the cycle. Over the course of the last 2 cycles, residential conversions have followed similar trends
where a surge in new development speeds up the reclassification of aging B-grade stock to C-grade. The
subsequent supply overhang & recovery periods then sees increased levels of residential conversion as a
result of both lower demand for office space & lower selling prices per square meter making conversion more
feasible.

Notwithstanding the 10bp weakening at an aggregate level, the most recent quarter saw 29 of 54 office
nodes recording flat or improving occupancy rates while 25 nodes saw weakening occupancy. Since 2011,
not many nodes have recorded more than three successive quarters of positive uptake. This suggests that
nodal selection has been getting less important with the focus falling on asset selection.

         Copyright SAPOA. Please refer to Disclaimer on back page.

                               T: (011) 883 0679 F: (011) 883 0684
                               Email: marketingmanager@sapoa.org.za                                             08
                               Web: www.sapoa.org.za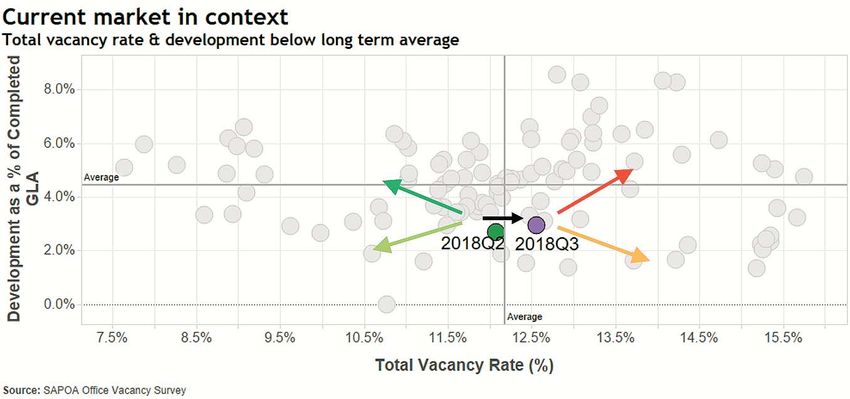
Q3          Office Vacancy Report
            October 2018

GREEN CERTIFIED PROPERTY
OFFICE VACANCY & RENTAL PREMIUM
As at the end of Q3 2018, the SAPOA OVS sample included more than 2m sqm of green certified office
space (~22% of total P & A-grade office GLA). On a regional level, it is interesting to note that 40% of Cape
Town P&A-grade office GLA is Green certified Ð relative to the 19.2% total ex. Cape Town. For the quarter
ending September 2018, Green Certified Prime & A-grade offices had a vacancy rate of 4.6% versus the
9.2% of all P &Ê A-grade offices & a premium on its asking rental of 14% (R171/sqm vs. R150/sqm). Currently,
green certified offices in KZN command the highest asking rental premium above non-certified P & A-grade
stock.

         Copyright SAPOA. Please refer to Disclaimer on back page.

                               T: (011) 883 0679 F: (011) 883 0684
                               Email: marketingmanager@sapoa.org.za                                             9
                               Web: www.sapoa.org.za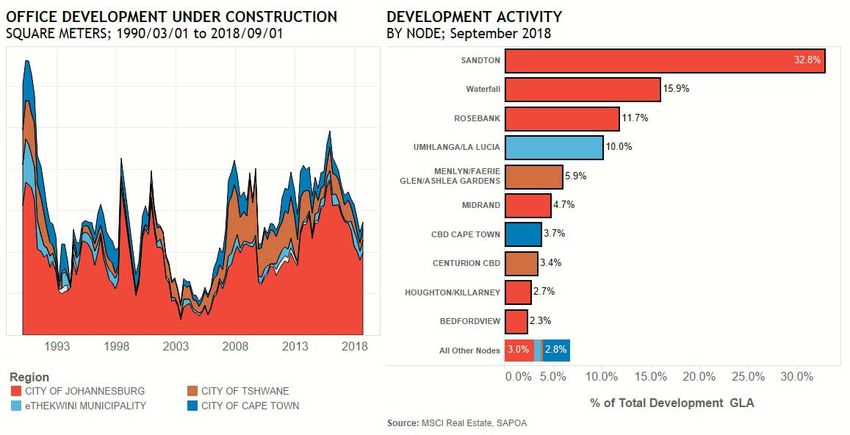
Q3            Office Vacancy Report
              October 2018

OFFICE VACANCY & RENTAL GROWTH
BY REGION
Among the countryÕs five largest metropolitan municipalities, the City of Cape Town still has the lowest overall
office vacancy rate despite a 30bp increase during the quarter. The highest vacancy rate among the larger
metros was the 12.8% recorded for the City of Johannesburg which overtook eThekwini which improved to
12.1% after a 120bp improvement.

ItÕs the first time that the City of Johannesburg has had the highest office vacancy rate among the five largest
metros since 2003 when itÕs aggregate vacancy rate topped out at 17.1%.

While the vacancy rate of the Johannesburg CBD remains high at 16.8%, several decentralised nodes have
office vacancy rates in the same ballpark. Most notable are Sandton (17.3%) and Sunninghill (15.2%). As an
illustration of the pressure the Sandton office market has come under, consider that 2018Q3 is the first quarter
since 1993Q4 that its office vacancy rate is higher than that of the Johannesburg CBD.

The Durban inner city continues to be the main driver of the overall vacancy level improvement with the
eThekwini municipality and ended the latest quarter at 17.5% after a 170bp improvement off positive space
absorption in the A & C-grade segments. The City of Tshwane recorded an aggregate office vacancy rate of
9.6%- down 20bps on the quarter prior. The vacancy rate of offices in the Pretoria CBD ended the quarter at
7.0% while the cityÕs decentralised nodes were spread between 0.5% for Sunnyside and 16.5% in the
Hatfield/Hillcrest node (up 150bps).

           Copyright SAPOA. Please refer to Disclaimer on back page.

                                T: (011) 883 0679 F: (011) 883 0684
                                Email: marketingmanager@sapoa.org.za                                         10
                                Web: www.sapoa.org.za
Q3 Office Vacancy Report
October 2018
OFFICE VACANCY & RENTAL GROWTH
CBD vs. DECENTRALISED
Inner city office vacancy rates, while still higher, have been converging with that of decentralised office nodes
since 2013 Ð a similar situation asÊ the previous two cycles when vacancies were nearing peak levels. The
cause of the convergence seems to be the fact that CBD office vacancy rates typically decline before
decentralised office vacancy rates Ð driven in part by residential conversion.
The figure below illustrates the cumulative shift in inner city and decentralised office vacancy rate during the
different phases of the office vacancy cycle. While the CBD office segment had a noticeably steeper vacancy
increase during the Supply Overhang phase it has recovered faster during the recovery phase (off a higher
base)
During the quarter ending September 2018, the national inner city office vacancy rate was up 20bps to 14.1%
while the countryÕs city decentralized nodes posted an aggregate vacancy rate of 10.3% - up 10bps from the
previous quarter (not withstanding fluctuations in the underlying nodes). The current level of inner city office
vacancies is largely driven by the Durban CBD where the aggregate vacancy rate ended the quarter at 17.5%.
The Durban CBD also recorded the largest decline in vacancy rates with a quarter on quarter move of 180bps.
While the overall City Decentralised segment saw a 10bp increase in vacancy rate, 8 decentralised nodes
recorded increases of 100bps and more over the past quarter. On a weighted basis, Sandton, Braamfontein
and Rosebank contributed a combined +30bp to the overall City Decentralised office vacancy rate decline.
Highveld Technopark, Parktown and Constantia Kloof were the major contributors with a positive impact of
0.2% for the quarter ended September 2018.
Copyright SAPOA. Please refer to Disclaimer on back page.
T: (011) 883 0679 F: (011) 883 0684
Email: marketingmanager@sapoa.org.za 11
Web: www.sapoa.org.zaQ3 Office Vacancy Report
October 2018
MID-SIZED OFFICES DRIVE VACANCY
VACANCY BY BUILDING SIZE & GRADE
An analysis of office vacancy rates by building size produces some interesting insights. The graphic below left
shows the office vacancy rate bracketed by building size with the heat map alongside drilling down further into
grade as well.
Interestingly, vacancy rates are the lowest in office buildings smaller than 1,000sqm (4.7%) and larger than
20,000sqm (7.5%) but significantly higher in the middle tiers. As at Q3 3018, the highest vacancy rates were
recorded for the 2,500-5,000sqm and 5,000-10,000sqm segments Ð 14.1%Ê and 14.9% respectively. Office
buildings sized between 1,000 and 5,000sqm had a vacancy rate of 10.9% across 1,548 properties.
In the A-grade segment, office buildings of between 10,000sqm and 20,000sqm recorded a significantly higher
vacancy rate at 13.2% relative to other size segments which all had vacancy rates of below 10%. The prime
office segment saw its highest vacancy rate being record in the 5,000-10,000sqm bracket at 13.4% suggesting
that prime office occupiers are preferring buildings that are smaller (2.5k sqm-10k sqm) or significantly larger
(>20k sqm).
The secondary grade office segments recorded their highest vacancy rates in the larger building brackets. In
C-grade, a vacancy rate of 23.3% was recorded in the 10,000-20,000sqm bracket suggesting that while this
bracket holds the most opportunity for residential conversion at present the large building size poses a certain
financial barrier to entry which may benefit residential focuses REITs.
Copyright SAPOA. Please refer to Disclaimer on back page.
T: (011) 883 0679 F: (011) 883 0684
Email: marketingmanager@sapoa.org.za 12
Web: www.sapoa.org.zaQ3 Office Vacancy Report
October 2018
WHICH NODES DROVE THE CHANGE
IN VACANCY?
On a nodal level, there is significant variance Ð both in terms of absolute vacancy rate and the direction of
their recent trends up or down. The graphic below illustrates the top 5 nodes in terms of positive & negative
weighted impact on the overall vacancy rate.
The top 5 detractors of total vacancy rate added +30bps while the top 5 positively contributing nodes added
-30bps (the remaining 44 nodes had a net +10bp impact)
During the quarter ending September 2018, Highveld Technopark (PTA), CBD Durban and Parktown (JHB)
had the largest positive weighted impact on the overall vacancy rate.Ê Parktown in particular had a significant
decline in vacancy rate Ð down 330bps to 11.9%. Highveld Technopark saw its overall vacancy rate go from
12.9% to 10.3% (-260bps).
Similar to the previous quarter Sandton, the Johannesburg CBD and Braamfontein had the largest negative
weighted impacts on the overall office vacancy rate contributing a combined ~+30bps to the shift in the national
figure. Rosebank (JHB) and the CBD of Cape Town also had weighted impacts of 10bps each. Braamfontein
and Rosebank experienced the largest quarter on quarter change in vacancy Ð both seeing a 280bp deterioration
in aggregate office vacancy rate.
Copyright SAPOA. Please refer to Disclaimer on back page.
T: (011) 883 0679 F: (011) 883 0684
Email: marketingmanager@sapoa.org.za 13
Web: www.sapoa.org.zaQ3 Office Vacancy Report
October 2018
DEVELOPMENT ACTIVITY DOWN
FEWER SPECULATIVE SCHEMES
At the end of the current quarter, developments under construction totalled 544k sqm. This up from a revised
496k sqm recorded in the previous quarter but down significantly from the Q4 2015 peak of 982k sqm when
numerous large developments were still under construction.
Expressed as a percentage of existing market stock, development activity is currently at 2.9% -off the 6.6%
high of Q4 2007 and the long-term average of 4.4%. One driver of the decline in the total office development
figure is that many development schemes are scaling down speculative building activity and opting to only
phase development on a tenant driven basis.
While the overall level of development has been slowing, Q1 2018 saw the pre-let rate of current developments
dip noticeably to end at 45.2%. This is the lowest level since 2013Q4 which may weigh on asking rental growth
in the short term. The development pre-let rate had been on a gradually improving trend since 2008, however
with several large, single tenanted developments recently coming onto the market and others (including many
speculative) recently breaking ground, the latest decline in the measure could probably be expected.
Copyright SAPOA. Please refer to Disclaimer on back page.
T: (011) 883 0679 F: (011) 883 0684
Email: marketingmanager@sapoa.org.za 14
Web: www.sapoa.org.zaQ3 Office Vacancy Report
October 2018
OFFICE DEVELOPMENT ACTIVITY
CONCENTRATED IN GAUTENG
Development activity continues to be concentrated with 93.2% of office development taking place in 10 nodes.
As at September 2018, 8 of the top 10 development nodes were in Gauteng with Sandton accounting for
32.8% of the total development.
National office development activity is likely to further stabilise in the next year given that many large scale
projects have come to/or nearing completion and given that the overall office development pipeline is slowing
down compared to recent history.
Together with Sandton, the rapidly growing greenfield development node of Waterfall, as well as the more
mature nodes of Rosebank, Umhlanga/La Lucia and Menlyn round out the top 5 with regards to the overall
level of office development under construction.
The 20 largest projects account for 73.2% of total office development GLA in the metros & nodes currently
covered by the survey.Ê This is down from a recent high of 81% emphasising the impact of several large scale
(mostly single tenanted) developments having come on-stream. The top 10 largest development projects
only had a pre-let rate of 40.5% as at Q3 2018 Ð driving down the aggregate national office development
pre-let rate and potentially holding risks to the overall vacancy rate if they remain unlet until completion.
Copyright SAPOA. Please refer to Disclaimer on back page.
T: (011) 883 0679 F: (011) 883 0684
Email: marketingmanager@sapoa.org.za 15
Web: www.sapoa.org.zaQ3 Office Vacancy Report
October 2018
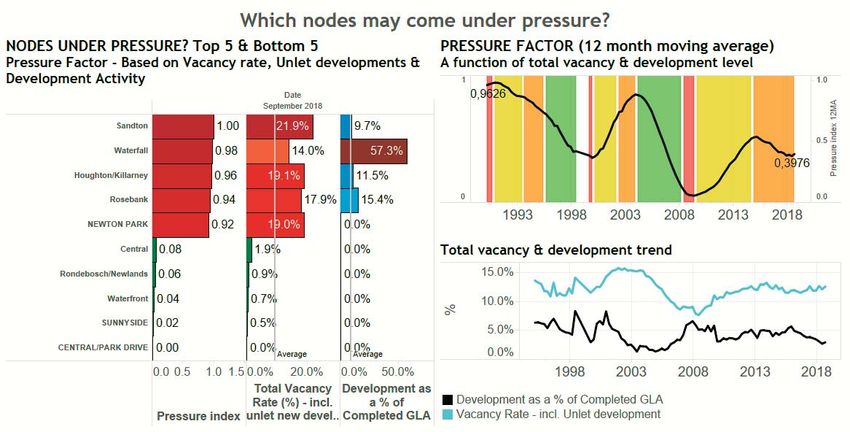
WHICH NODES COULD COME
UNDER PRESSURE?
While the level of development activity has slowed relative to the historical trend itÕs important to form a view
of demand alongside the supply picture. While some nodes may have a high level of development relative
to othersÊ - these might be mostly pre-let which would not impact as negatively on rentals. The graphic below
breaks down the top & bottom 5 nodes based on their current total vacancy rate (incl. unlet developments)
and level of development activity to establish an indicator of short to medium term pressure on rental growth.
On a national level, the pressure index is currently at .40, down from a recent high in 2016 of .54. While
the overall level of vacancy (incl. unlet new developments) have been drifting sideways, a lower level of new
development has had a positive impact.
On a nodal level, Sandton is currently most likely to experience near term rental pressure, based on its high
vacancy rate (17.3% - 21.9% including unlet development property) & relatively high level of speculative
development activity.Ê The Waterfall node has climbed up the Pressure Index after some speculative new
developments broke ground in the node. As at Q3 2018, the total vacancy rate (which includes un-let new
developments) shot up to 14.0% from 1.7% in the quarter before.
On the other side of the pressure spectrum are mature, popular nodes such as the V&A Waterfront, Sunnyside,
Rondebosch/Newlands and the Central Node (Pinelands and the Black River parkway precinct) which all
have a critical mass of large, long-term occupiers and limited opportunities for greenfield developments
which should underpin short to medium term occupancy levels and rental growth.Ê
Copyright SAPOA. Please refer to Disclaimer on back page.
T: (011) 883 0679 F: (011) 883 0684
Email: marketingmanager@sapoa.org.za 16
Web: www.sapoa.org.zaQ3 Office Vacancy Report
October 2018
DIAGNOSING SANDTONÕS
PRESSURE POINTS
Among the major office nodes, Sandton is a particularly interesting case where it has seen the largest amount
of development but also the largest increase in vacancy rate over the past 2 years. Several largeÐscale new
developments have seen the nodeÕs epicenter move away from its ÒHistoric CoreÓ (the older part of the node
around Fredman, West & 5th) towards a new ÒcoreÓ anchored by the Gautrain station.
An analysis of the Sandton node where vacant rate is segmented by Grade, Location and Building Size may
be useful in diagnosing the nodeÕs pressure points and highlight potential opportunities. From the graphic below
it is clear that the driver of the nodeÕs vacancy rate is the 5,000-10,000sqm and 10,000-20,000sqm size brackets
within the Historic Core and peripheral street-level markets (Grayston & Upper Grayston, Sandown Valley,
Wierda Valley).
Segmenting these Òpressure pointsÓ by grade (not shown below due to sample sizes in some segments) reveals
that the B-grade segment in particular is driving the nodeÕs vacancy in the historic core with an overall vacancy
of 75.6%.
While residential conversions in the node have been limited given the high per square meter office valuations
relative to the cost of conversion and potential residential sales value, partial conversions may become more
feasible over time as demand may still lag supply into the foreseeable future.
Copyright SAPOA. Please refer to Disclaimer on back page.
T: (011) 883 0679 F: (011) 883 0684
Email: marketingmanager@sapoa.org.za 17
Web: www.sapoa.org.zaQ3 Office Vacancy Report
October 2018
UNLET NEW DEVELOPMENTS POSE
A RISK TO RENTAL GROWTH
Further analysis of the total vacancy rate on a nodal level reveals that several nodes currently have a fairly
wide spread between their ÔtotalÕ vacancy rate (incl. un-let developments) and the vacancy rate on
completed/existing property. Speculative developments pose a downside risk to rental growth if unlet and a
failure to do so might see the nodeÕs vacancy rate converge on the current Ôtotal vacancy rateÕ.
In the case of Waterfall (JHB) & Rosebank (JHB) particularly-, unlet new developments currently pose a
substantial risk to medium term rental growth. Waterfall currently hasÊ a downside risk to vacancy of 11.7%
as the vacancy rate of completed property is 2.3%, but including unlet developments this figure increases
to 14.0%.
On the other hand, the vacancy rate of nodes like Bedfordview and the Centurion CBD will actually benefit
once current developments come on line as these will reduce the overall vacancy rate by 20bps and 50bps
respectively given that the majority of space under construction is already pre-let.
Copyright SAPOA. Please refer to Disclaimer on back page.
T: (011) 883 0679 F: (011) 883 0684
Email: marketingmanager@sapoa.org.za 18
Web: www.sapoa.org.zaQ3 Office Vacancy Report
October 2018
WHERE ARE WE IN THE OFFICE
PROPERTY CYCLE?
As mentioned earlier in the report, the aggregate vacancy rate has moved broadly sideways since 2011 while
the level of development activity has been trending steadily lower since reaching a peak in 2015Q4. This places
the current quarter roughly midway relative to its long term history in terms of its total vacancy rate and development
as a % of existing stock (graphic below).
Ideally, the next move should be towards the Ônorth westÕ on the graphic belowÐ a situation where demand
exceeds a healthy level of supply. In saying that, the most recent quarter saw a move towards the east given
the higher total vacancy rate and slightly higher development activity.
Asking rental growth has dipped below inflation again after a couple of successive above-inflation periods now
and remains negative in real terms on a 3 & 5-year viewÐ indicative of the low growth environment coupled with
an excess supply in the market. Any future improvement in vacancy rate and asking rental growth depends on
a strengthening of underlying demand drivers most notably financial & business services employment growth
& capital investment.
Capital investment into financial & business services while still in the low single digits have been positive for
five quarters which reduces the probability of another short term deterioration in the vacancy rate.Ê Given the
current trend of economic growth and structural growth constraints it is becoming increasingly hard to imagine
the national office vacancy rate returning to mid-single digits within the next 3 years. That said, renewed business
optimism amid a changing political landscape could well be the much needed catalyst to unlock capital investment
in the sector that could drive employment growth and subsequently the demand for office space.
Copyright SAPOA. Please refer to Disclaimer on back page.
T: (011) 883 0679 F: (011) 883 0684
Email: marketingmanager@sapoa.org.za 19
Web: www.sapoa.org.zaQ3 Office Vacancy Report
October 2018
OFFICE NODE DEFINITIONS
JOHANNESBURG
BEDFORDVIEW / BRUMA: Includes the offices around and adjacent Bruma Lake, Eastgate Shopping
Centre and Bedford Shopping Centre. Also offices adjacent to GilloolyÕs Farm, Skeen Boulevard as
well as along the R22 and R24 in the direction of OR Tambo International Airport.
BRAAMFONTEIN: Bounded by the M1 highway to the west, the railway line to the south, Joubert St
to the east and the Braamfontein Ridge to the north including the Braampark development but excluding
the University campus.
BRYANSTON / EPSOM DOWNS: This area adjacent to the intersection between the Western Bypass
and William Nicol Dr, including Peter Place.
CBD JOHANNESBURG: Bounded by the M2 and M1 highways to the south and west respectively,
the railway to the north and End St to the east.
CONSTANTIA KLOOF BASIN: Includes area either side of Hendrik Potgieter Rd, including Monash
University to the west with the Western bypass to the east.
CRESTA / BLACKHEATH: Includes offices in Cresta, Darrenwood, Blackheath and Northcliff &
extensions and Randpark either side of Beyers Naude bounded by Milner Rd to the east and Christiaan
de Wet/Northumberland to the west, and from Milner in the south up to the N1 in the north.
FOURWAYS: Bounded by Uranium Rd to the north, Main Rd to the east, William Nicol intersection to
the south and Waterford Estate to the west.
GREENSTONE / LONGMEADOW / MODDERFONTEIN / EDENVALE: Bounded by the N3 to the west,
Peace St/Modderfontein Rd to the north, Palliser Rd to the east and Aitken Rd to the south.
HOUGHTON / KILLARNEY: Included are the offices in Killarney and Houghton on either side of the
M1 highway as well as the Houghton Isle development.
HYDE PARK / DUNKELD: The node of the intersection of Jan Smuts Ave and William Nicol Dr including
Dunkeld West, Hyde Park and the upper part of Craighall Park.
ILLOVO: The office node in Rudd Rd, Oxford Rd and Illovo Boulevard areas.
MELROSE / WAVERLEY: The area enclosed by Corlett Dr, Oxford Rd, Glenhove Rd and Atholl-
Oaklands/Scott St as well as the Waverley area across the M1 Highway.
MIDRAND: Includes buildings which are predominantly offices in the Midrand and Halfway House area.
MILPARK: Includes the Richmond/Sunnyside office development node, the Milpark developments west
of Empire Rd, the SABC complex and surrounding offices.
MORNINGSIDE: Includes Morningside, Morningside Manor & Gallo Manor areas bounded by Kelvin
Dr, Bowling Rd, South Rd and the Western Service Rd/M1.
NEWTOWN: Includes the areaÊ enclosed by Commissioner, West, Car and Queen Streets.
PARKTOWN: Includes the Parktown nodes adjacent to Jan Smuts Ave up to the ridge, Central Parktown
and the office area around Anerley Rd and Sunnyside Park Hotel.
Copyright SAPOA. Please refer to Disclaimer on back page.
T: (011) 883 0679 F: (011) 883 0684
Email: marketingmanager@sapoa.org.za 20
Web: www.sapoa.org.zaQ3 Office Vacancy Report
October 2018
OFFICE NODE DEFINITIONS
JOHANNESBURG...continued
RANDBURG: The Randburg CBD and extending into Ferndale, north to Bond St, west to
Malibongwe Dr and east along Bram Fischer Dr into Jan Smuts Ave adjoining Bordeaux, up to
Republic Rd. Also continuing south along both sides of Bram Fischer until Conrad Dr in Blairgowrie.
RANDPARK/RANDPARK RIDGE: Bounded by N1 to the south, Randpark Ridge to the west,
Boskruin/Bromhof to the east and Christiaan de Wet/Northumberland to the north.
RIVONIA: The office node along Rivonia Rd up to 12th Ave, bounded by Summit Rd to the west,
Bowling Rd to the east and Cullinan Place to the south.
ROSEBANK: Bounded by Bolton Rd, Jan Smuts Ave, Oxford Rd and Jellicoe Ave, including sundry
buildings in Parkwood and Parktown North along the major arterial Rds.
SANDTON AND ENVIRONS: The Sandton CBD & adjacent office nodes incl. Wierda Valley, Benmore
& Sandown. Also included are the offices along Katherine Rd travelling towards the M1 highway.
SUNNINGHILL: Centrally contained in the well-defined commercial hub. The North boundary is the
main residential portion of the suburb. The East boundary terminates at Woodmead Dr. The Southern
boundary is all properties that are accessed directly from Witkoppen Rd until it intersects with Millcliff
Rd which then provides its Western boundary. The exclusion in terms of commercial buildings are the
small, owner occupied properties that were constructed at the northern end of Peltier Rd.
WOODMEAD: The node is contained by the M1 highway to the East, Maxwell Dr to the North and
Kelvin Dr to the South. The bulk of the commercial buildings are located in the office parks located
directly to the West of Woodmead Dr, up to and including those on the Country Club Johannesburg
boundary.
PORT ELIZABETH
CENTRAL/PARK DRIVE: The area bounded by Rink St to the East, Park Dr/Cape Rd to the South,
Mount Rd to the west and Westbourne Rd to the North.
GREENACRES: The area bounded by Koningham Rd to the East, Westview Dr to the South, 2nd Ave
to the West and Norvic Dr/Worricker St to the North.
NEWTON PARK: The area bounded by 2nd Ave to the East, Hurd St to the South, 7th Ave and to the
West and King Edward St to the North.
WALMER/FAIRVIEW: The area bounded by 1st Ave to the East, Heugh Rd to the South, William
Moffett Expressway and 17th Ave to the West and Main Rd to the North.
Copyright SAPOA. Please refer to Disclaimer on back page.
T: (011) 883 0679 F: (011) 883 0684
Email: marketingmanager@sapoa.org.za 21
Web: www.sapoa.org.zaQ3 Office Vacancy Report
October 2018
OFFICE NODE DEFINITIONS
CAPE TOWN
BELLVILLE: Jip de Jager/Mike Pienaar to the West, Voortrekker Rd to the South, Old Oak to the East
and Van Riebeeck Rd to the North.
CBD CAPE TOWN: Chiappini St to West, Gardens suburb to South, Tennant St to East and Harbour
Freeway to North.
CENTURY CITY: Properties within the Century City mixed use node; includes offices located either
side of Ratanga Road up to Century Boulevard
CLAREMONT: Highwick/Pine to the South, Protea/Campground Rd to the North, Palmyra to the East
and the M3 to the West.
CENTRAL: Encompasses the Pinelands Office node and the Black River Park precinct. Bounded by
Settlers Way to the South, Jan Smuts to the North and East and Liesbeek Parkway to the West.
RONDEBOSCH / NEWLANDS: Protea/Campground Rd to the South, Woolsack Rd to the North,
Campground Rd to the East and the M3 to the West.
WATERFRONT: Properties within the V&A Waterfront precinct.
DURBAN
BALLITO: The main area of Ballito and surrounds, including Salt Rock and the Dube Tradeport.
BEREA: Offices located in the larger Berea area west of the M4 & R104 and south of the M19.
CBD DURBAN: The area bounded by Victoria Embankment and Winder St to the south, the railway
line, Cross St, First Ave and Stamford Hill Rd to the west, Argyle Rd to the north and Brickhill and Point
Rds to the east.
HILLCREST/GILLITS: The Hillcrest office node can be defined as a triangular shape bounded by King
Cetshwayo Highway (M13) in the south, Kassier Rd to the west and a line from the intersection of
Kassier Rd & the R103 (Main Rd) to the intersection of King Cetshwayo Highway (M13) in the north
east. Also included in this node are offices
UMHLANGA/LA LUCIA: Includes the office properties adjacent to Armstrong Avenue in La Lucia
through to the M41 in Umhlanga. To the west , the node includes the office properties located along
Flanders Drive in Mount Edgecombe while to the north and east, the node includes the New Town
Centre node, Ridgeside and office located along Lighthouse Road to Lagoon Drive.
WESTVILLE: Offices located in the larger Westville area of Durban including those located along The
Boulevard in the south and the N2 to the east.
Copyright SAPOA. Please refer to Disclaimer on back page.
T: (011) 883 0679 F: (011) 883 0684
Email: marketingmanager@sapoa.org.za 22
Web: www.sapoa.org.zaQ3 Office Vacancy Report
October 2018
OFFICE NODE DEFINITIONS
PRETORIA
ARCADIA: Bounded by Du Toit St to the west, Hill St to the east, Schoeman and Park Sts to the south
and Belvedere St to the north.
BROOKLYN/ NIEUW MUCKLENEUK/ GROENKLOOF/WATERKLOOF: Bounded by the Fountains
Circle, Lynnwood Rd, Brooklyn Rd, Dely Rd, Rigel Rd North and Sibelius St.
CBD PRETORIA: Is bounded by Potgieter St to the west, Boom St to the north, Scheiding St to the
south and Du Toit / Van Boeshoten St to the east.
CENTURION CBD:Ê Is bounded by John Vorster extension and Rabie Street to the west, Botha Avenue
to the north and east and Alexandra Road and the N1 highway to the south.
HATFIELD / HILLCREST: Is bounded by Church St to the north, Duncan and Brooklyn Sts to the east,
Festival St to the west and Lynnwood St to the south.
HIGHVELD TECHNOPARK / HIGHVELD EXTENSIONS: The area bounded bu the N1 highway to the
north, Jean Avenue extension to the east, Nellmapius Drive to the south and the Ben Schoeman
highway to the west.
LYNNWOOD/MENLO PARK/HAZELWOOD/PERSEQUOR PARK: Bounded by Brooklyn Rd to the
west, the N4 Freeway to the north, General Louis Botha to the east and Garsfontein Rd to the south.
MENLYN / FAERIE GLEN / ASHLEA GARDENS: Bounded by Dely Rd to the west, Ingersol and Kelvin
Sts to the north, General Louis Botha to the east and Garsfontein Rd to the south.
PRETORIA Ð OTHER SUBURBAN AREAS: Comprises of small office nodes throughout the eastern
suburbs of Pretoria which fall outside the boundries of all the other suburban nodes.
THE WILLOWS / SILVER LAKES / TIJGER VALLEY: The area east of Lynnwood Ridge all along
Lynnwood Road and extension passing through The Willows past Silver Lakes and extending to the
Lombardy Office Park.
SUNNYSIDE: Is bounded by Park St to the north, Johnston St to the east, Walker St to the south and
Du Toit / Van Boeshoten to the west.
Copyright SAPOA. Please refer to Disclaimer on back page.
T: (011) 883 0679 F: (011) 883 0684
Email: marketingmanager@sapoa.org.za 23
Web: www.sapoa.org.zaQ3 Office Vacancy Report
October 2018
OFFICE GRADE DEFINITIONS
P-grade (Prime grade):Ê Top quality, modern space. Prime buildings are often considered iconic and
a flagship in its market and a pace-setter in establishing rentals. ÊEssential features include high
security- both manned and electronic. Includes the latest or recent generation of building services,
ample parking, a prestigious lobby finish. To be considered Prime-grade, an Office should at least
be a 4-star Green Certified building.
A-grade:Ê These buildings are not older than 15 years and have generally undergone major
refurbishments. They feature high quality modern finishes, air conditioning, adequate on-site parking,
with market rentals near the top of the range in the metropolitan areas where they are located.
B-grade:Ê Generally older buildings, but accommodation and finishes are close to modern standards
as a result of refurbishments and renovation from time to time. Air conditioning and on-site parking
can be considered essential.
C-grade:Ê Buildings typically in fair condition but with older style finishes, services and building systems.
Infrastructure generally limited. May or may not be air-conditioned or have on-site parking.Ê
Copyright SAPOA. Please refer to Disclaimer on back page.
T: (011) 883 0679 F: (011) 883 0684
Email: marketingmanager@sapoa.org.za 24
Web: www.sapoa.org.zaNode
& Grade
Copyright SAPOA. Please refer to Disclaimer on back page.
T: (011) 883 0679 F: (011) 883 0684
Email: marketingmanager@sapoa.org.za 25
Web: www.sapoa.org.zaNode
& Grade
Copyright SAPOA. Please refer to Disclaimer on back page.
T: (011) 883 0679 F: (011) 883 0684
Email: marketingmanager@sapoa.org.za 26
Web: www.sapoa.org.zaNode
& Grade
Copyright SAPOA. Please refer to Disclaimer on back page.
T: (011) 883 0679 F: (011) 883 0684
Email: marketingmanager@sapoa.org.za 27
Web: www.sapoa.org.zaQ3 Office Vacancy Report
October 2018
ABOUT MSCI
For more than 40 years, MSCIÕs research-based indexes and analytics have helped
the worldÕs leading investors build and manage better portfolios.Ê
Clients rely on our offerings for deeper insights into the drivers of performance and risk
in their portfolios, broad asset class coverage and innovative research.
Our line of products and services includes indexes, analytical models, data, real estate
benchmarks and ESG research.Ê
MSCI serves 98 of the top 100 largest money managers, according to the most
recent P&I ranking.
For more information, visit us at www.msci.com
Report compiled by:
Copyright SAPOA. Please refer to Disclaimer on back page.
T: (011) 883 0679 F: (011) 883 0684
Email: marketingmanager@sapoa.org.za 28
Web: www.sapoa.org.zaQ3 Office Vacancy Report
October 2018
NOTICE AND DISCLAIMER
This document and all of the information contained in it, including without limitation all text, data, graphs, charts (collectively, the
ÒInformationÓ) is the property of MSCI Inc. or its subsidiaries (collectively, ÒMSCIÓ), or MSCIÕs licensors, direct or indirect suppliers or any
third party involved in making or compiling any Information (collectively, with MSCI, the ÒInformation ProvidersÓ) and is provided for
informational purposes only.Ê The Information may not be modified, reverse-engineered, reproduced or redisseminated in whole or in
part without prior written permission from MSCI.
The Information may not be used to create derivative works or to verify or correct other data or information.ÊÊ For example (but without
limitation), the Information may not be used to create indexes, databases, risk models, analytics, software, or in connection with the
issuing, offering, sponsoring, managing or marketing of any securities, portfolios, financial products or other investment vehicles utilizing
or based on, linked to, tracking or otherwise derived from the Information or any other MSCI data, information, products or services.Ê
The user of the Information assumes the entire risk of any use it may make or permit to be made of the Information.Ê NONE OF THE
INFORMATION PROVIDERS MAKES ANY EXPRESS OR IMPLIED WARRANTIES OR REPRESENTATIONS WITH RESPECT TO
THE INFORMATION (OR THE RESULTS TO BE OBTAINED BY THE USE THEREOF), AND TO THE MAXIMUM EXTENT PERMITTED
BY APPLICABLE LAW, EACH INFORMATION PROVIDER EXPRESSLY DISCLAIMS ALL IMPLIED WARRANTIES (INCLUDING,
WITHOUT LIMITATION, ANY IMPLIED WARRANTIES OF ORIGINALITY, ACCURACY, TIMELINESS, NON-INFRINGEMENT,
COMPLETENESS, MERCHANTABILITY AND FITNESS FOR A PARTICULAR PURPOSE) WITH RESPECT TO ANY OF THE
INFORMATION.
Without limiting any of the foregoing and to the maximum extent permitted by applicable law, in no event shall any Information Provider
have any liability regarding any of the Information for any direct, indirect, special, punitive, consequential (including lost profits) or any
other damages even if notified of the possibility of such damages. The foregoing shall not exclude or limit any liability that may not by
applicable law be excluded or limited, including without limitation (as applicable), any liability for death or personal injury to the extent
that such injury results from the negligence or willful default of itself, its servants, agents or sub-contractors.Ê
Information containing any historical information, data or analysis should not be taken as an indication or guarantee of any future
performance, analysis, forecast or prediction.Ê Past performance does not guarantee future results.Ê
The Information should not be relied on and is not a substitute for the skill, judgment and experience of the user, its management,
employees, advisors and/or clients when making investment and other business decisions.Ê All Information is impersonal and not tailored
to the needs of any person, entity or group of persons.
None of the Information constitutes an offer to sell (or a solicitation of an offer to buy), any security, financial product or other investment
vehicle or any trading strategy.
It is not possible to invest directly in an index.Ê Exposure to an asset class or trading strategy or other category represented by an index
is only available through third party investable instruments (if any) based on that index.ÊÊ MSCI does not issue, sponsor, endorse, market,
offer, review or otherwise express any opinion regarding any fund, ETF, derivative or other security, investment, financial product or
trading strategy that is based on, linked to or seeks to provide an investment return related to the performance of any MSCI index
(collectively, ÒIndex Linked InvestmentsÓ). MSCI makes no assurance that any Index Linked Investments will accurately track index
performance or provide positive investment returns.Ê MSCI Inc. is not an investment adviser or fiduciary and MSCI makes no representation
regarding the advisability of investing in any Index Linked Investments.
Index returns do not represent the results of actual trading of investible assets/securities. MSCI maintains and calculates indexes, but
does not manage actual assets. Index returns do not reflect payment of any sales charges or fees an investor may pay to purchase the
securities underlying the index or Index Linked Investments. The imposition of these fees and charges would cause the performance of
an Index Linked Investment to be different than the MSCI index performance.
The Information may contain back tested data.Ê Back-tested performance is not actual performance, but is hypothetical.Ê There are
frequently material differences between back tested performance results and actual results subsequently achieved by any investment
strategy.Ê
Constituents of MSCI equity indexes are listed companies, which are included in or excluded from the indexes according to the application
of the relevant index methodologies. Accordingly, constituents in MSCI equity indexes may include MSCI Inc., clients of MSCI or suppliers
to MSCI.Ê Inclusion of a security within an MSCI index is not a recommendation by MSCI to buy, sell, or hold such security, nor is it
considered to be investment advice.
Data and information produced by various affiliates of MSCI Inc., including MSCI ESG Research Inc. and Barra LLC, may be used in
calculating certain MSCI indexes.Ê More information can be found in the relevant index methodologies on www.msci.com.
MSCI receives compensation in connection with licensing its indexes to third parties.Ê MSCI Inc.Õs revenue includes fees based on assets
in Index Linked Investments. Information can be found in MSCI Inc.Õs company filings on the Investor Relations section of www.msci.com.
MSCI ESG Research Inc. is a Registered Investment Adviser under the Investment Advisers Act of 1940 and a subsidiary of MSCI Inc.Ê
Except with respect to any applicable products or services from MSCI ESG Research, neither MSCI nor any of its products or services
recommends, endorses, approves or otherwise expresses any opinion regarding any issuer, securities, financial products or instruments
or trading strategies and MSCIÕs products or services are not intended to constitute investment advice or a recommendation to make
(or refrain from making) any kind of investment decision and may not be relied on as such. Issuers mentioned or included in any MSCI
ESG Research materials may include MSCI Inc., clients of MSCI or suppliers to MSCI, and may also purchase research or other products
or services from MSCI ESG Research.Ê MSCI ESG Research materials, including materials utilized in any MSCI ESG Indexes or other
products, have not been submitted to, nor received approval from, the United States Securities and Exchange Commission or any other
regulatory body.
Any use of or access to products, services or information of MSCI requires a license from MSCI.Ê MSCI, Barra, RiskMetrics, IPD, FEA,
InvestorForce, and other MSCI brands and product names are the trademarks, service marks, or registered trademarks of MSCI or its
subsidiaries in the United States and other jurisdictions.Ê The Global Industry Classification Standard (GICS) was developed by and is
the exclusive property of MSCI and Standard & PoorÕs.Ê ÒGlobal Industry Classification Standard (GICS)Ó is a service mark of MSCI and
Standard & PoorÕs.
Copyright SAPOA. Please refer to Disclaimer on back page.
T: (011) 883 0679 F: (011) 883 0684
Email: marketingmanager@sapoa.org.za 29
Web: www.sapoa.org.zaSAPOA - South African Property Owners Association T: (011) 883 0679 - F: (011) 883 0684 Email: marketingmanager@sapoa.org.za Web: www.sapoa.org.za Physical: Paddock View, Hunt's End Office Park, 36 Wierda Road West, Wierda Valley, Sandton Postal: P O Box 78544, Sandton 2146 Report compiled by: DISCLAIMER: The information contained herein (the ÒInformationÓ) may not be reproduced or disseminated in whole or in part for commercial use without prior written permission from SAPOA. Where such permission is granted, SAPOA shall retain the copyright to the Information and must be referenced as such. SAPOA authorizes the user to copy, for non- commercial use only, research documents published on the SAPOA website. In consideration of this authorization, the user agrees that any content copied, reproduced or redisseminated shall retain all copyright and be referenced back to SAPOA. The Information is provided Òas isÓ and the user of the Information assumes the entire risk of any use it may make or permit to be made of the Information.
You can also read