Investor Presentation - March 2020 - South Jersey ...
←
→
Page content transcription
If your browser does not render page correctly, please read the page content below

Investor Presentation
     March 2020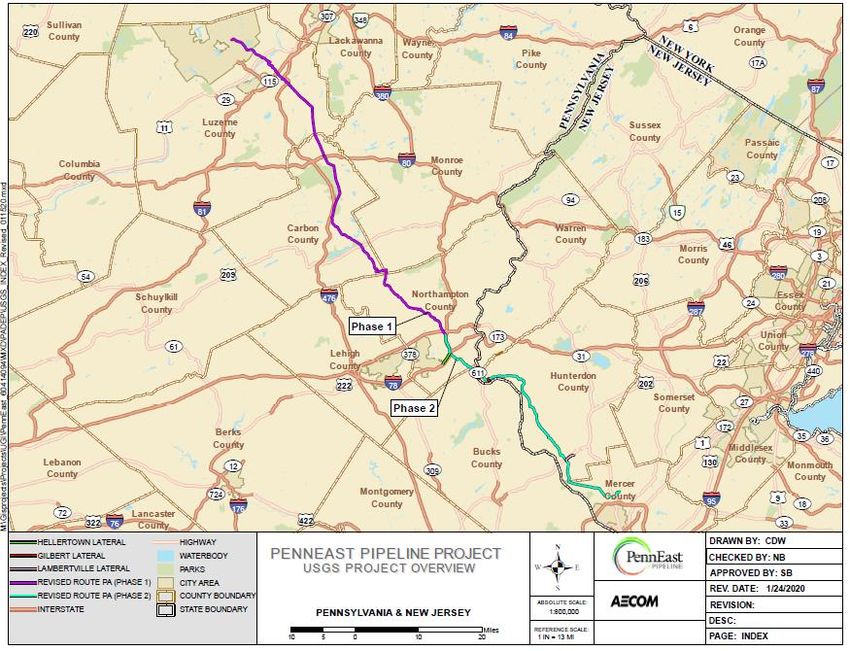
Forward-Looking Statements and Use of Non-GAAP Measures
     Certain statements contained in this presentation may qualify as “forward-looking statements” within the meaning of Section 27A of the Securities Act of
     1933 and Section 21E of the Securities Exchange Act of 1934. All statements other than statements of historical fact should be considered forward-looking
     statements made in good faith and are intended to qualify for the safe harbor from liability established by the Private Securities Litigation Reform Act of
     1995. Words such as “anticipate”, “believe”, “expect”, “estimate”, “forecast”, “goal”, “intend”, “objective”, “plan”, “project”, “seek”, “strategy”, “target”, “will”
     and similar expressions are intended to identify forward-looking statements. Such forward-looking statements are subject to risks and uncertainties that
     could cause actual results to differ materially from those expressed or implied in the statements.

     These risks and uncertainties include, but are not limited to, the following: general economic conditions on an international, national, state and local level;
     weather conditions in our marketing areas; changes in commodity costs; changes in the availability of natural gas; “non-routine” or “extraordinary”
     disruptions in our distribution system; regulatory, legislative and court decisions; competition; the availability and cost of capital; costs and effects of legal
     proceedings and environmental liabilities; the failure of customers or suppliers to fulfill their contractual obligations; and changes in business strategies.
     These cautionary statements should not be construed by you to be exhaustive. While SJI believes these forward-looking statements to be reasonable, there
     can be no assurance that they will approximate actual experience. Further, SJI undertakes no obligation to update or revise any of its forward-looking
     statements, whether as a result of new information, future events or otherwise.

     This presentation includes certain non-GAAP financial measures, which the Company believes are useful in evaluating its performance. You should not
     consider the presentation of this additional information in isolation or as a substitute for results prepared in accordance with GAAP. The Company has
     provided reconciliations of comparable GAAP to non-GAAP measures in tables found later in this presentation.

     Investor Contact:
     Daniel Fidell
     609-561-9000 x7027
     dfidell@sjindustries.com

 2
Overview

3

Overview | SJI Organizational Structure

                           Utility                                                            Non-Utility

                          SJI Utilities                              SJI Midstream              South Jersey Energy Solutions

          South Jersey   Elizabethtown          Elkton                 Pipelines/                Energy                 Energy
              Gas              Gas                Gas                   Storage                   Group                 Services

                                          • ELK (Sale Pending)   • PennEast Pipeline (20%) • Wholesale Operations   • Landfill
                                                                                            • Fuel Management       • Account Services
                                                                                            • Commodity Marketing

 4
Overview | Shareholder Value & Customer Satisfaction

     ❖ Our vision is to drive shareholder value and customer satisfaction
       through investment in expanding and modernizing our utility
       infrastructure and through regulatory innovation that provides
       safety, reliability, value and certainty to our customers.

     ❖ Knowing the criticality of reliable, cost effective supply to our region,
       we also seek investment in long-term contracted energy
       infrastructure that will support a more sustainable environment
       while making the mid-Atlantic region more affordable for families
       and competitive for businesses.

     ❖ Finally, we look to leverage our deep industry expertise and
       relationships, to provide essential services to utilities, power
       generators and industrial customers through our wholesale
       marketing, fuel management and consulting services.

 5
Overview | Environmental, Social and Corporate Governance (ESG)
                   SJI formed an internal ESG Committee to evaluate and monitor our stewardship
                   ESG Committee reports to the Corporate Responsibility Committee of SJI’s Board
                                 of Directors, ensuring the highest level of oversight

                  Environmental                                                      Social                                     Governance
     ✓   Collaborate with DEP and our state                ✓   Unwavering commitment to safety as the organization’s       ✓   30% of SJI’s board
         regulators to support effective                       non-negotiable top priority                                     members are female
         environmental, health and safety standards        ✓   Commitment to supplier diversity                            ✓   90% of board members
         and regulations                                                                                                       are considered
                                                           ✓   52% workforce diversity across 1,100+ employees
     ✓   Design/construct/operate/maintain                                                                                     independent
         infrastructure for efficiency to minimize leaks   ✓   60% of CEO’s direct reports are female
                                                                                                                           ✓   70% of board members
     ✓   Significant capital investment in ongoing         ✓   Significant investment in technology, people and customer       have tenure of 10 years
         remediation efforts as well as infrastructure         communications to drive the Customer Experience                 or less
         replacement                                       ✓   Significant monetary and employee volunteer time            ✓   Mandatory retirement
     ✓   117+ CNG vehicles installed across our fleet          contributions support community investment and over 30          age at 75
         reduce the use of diesel and carbon                   local non-profit organizations
                                                                                                                           ✓   Annual independent
         emissions                                         ✓   Robust intern program, with 28 interns participating from       third-party board
     ✓   Anticipate over 500 tons of carbon emissions          14 universities                                                 evaluation and
         will be reduced at the current pipe               ✓   Health and financial wellness programs to support               compensation
         replacement rate                                      employee engagement                                             evaluation

 6
Overview | Execution of Business Transformation Strategy

           Grow Economic Earnings

           • SJG Rate Case Settled (2017)   Improve Quality of Earnings
           • Customer Growth Driven by
             Gas Conversions and New        • Fuel Management Contracts     Maintain Balance Sheet Strength
             Construction                     Operational (2015-2018)
           • SJG AIRP Infrastructure        • Sharply Reduced Renewable     • Secondary Equity Offerings   Low Risk Profile
             Replacement Program              Development/Investment          (2016, 2018)
             Extended (2016)                  (2016)                        • Settled Equity Forward       • Established Midstream
           • SJG SHARP Infrastructure       • Reduced On-Site Energy          Agreement (2019)
             Replacement Program                                                                             Segment with PennEast
                                              Business Portfolio (2016)     • Deployment of Solar Sale       Pipeline Project (2015)
             Extended (2018)
                                            • Solar Assets Sold (2018)        Proceeds (2018/2019)         • Expanded Fuel Management
           • ETG Infrastructure Program
             Approved (2019)                • Retail Gas Marketing Assets   • Deployment of Retail Gas       Activities (2015-2018)
                                              Sold (2018)                     Marketing Sale Proceeds      • Elizabethtown and Elkton
           • ETG Rate Case Settled (2019)                                     (2018/2019)
                                            • CHP Assets Sold (2020)                                         Acquisitions (2017)
                                                                            • Deployment of Proceeds       • Redundancy Projects (Pending)
                                            • ELK Sale Announced (2019)
                                                                              from Remaining Non-Core
                                                                              Businesses (2019/2020)       • Other Investment
                                                                                                             Opportunities

 7
SJI Utilities

8

SJI Utilities | Overview
                                    Utility

                                  SJI Utilities

                                                                                PA
                                                                                PA
          South Jersey          Elizabethtown             Elkton
              Gas                     Gas                   Gas

                                                    • ELK (Sale Pending)

                                                                                                    NJ
                                                                                                    NJ
     Largest Stand-Alone Natural Gas Utility in New Jersey
     ➢   Three gas distribution utilities – South Jersey Gas (SJG) and
         Elizabethtown Gas (ETG) in NJ; and Elkton Gas (ELK) in MD
     ➢   ~10,000 miles of distribution and transmission pipeline
     ➢   ~700,000 total customers
     ➢   ~$3B combined Rate Base
                                                                           MD
                                                                           MD
     ➢   Growing customer base
     ➢   Mix of new construction and conversions                                     DE
                                                                                     DE
     ➢   Collaborative relationship with NJ regulators
     ➢   NJ ranks #4 in the nation in per capita income and #8 for GDP                    980388_1.wor - NY008P5T

 9
SJI Utilities | South Jersey Gas
➢ Overview
• 397,000+ customers served in southern New Jersey
• Mix of urban, suburban, rural and coastal communities
• Service territory covers more than 2,500 square miles
• ~6,600 miles of distribution pipeline PA
PA
• ~70% gas saturation in service area
• Regulated by the NJ Board of Public Utilities
➢ Regulatory Construct NJ
NJ
• Authorized rate base: $1.6B
• Authorized ROE: 9.6%
• Authorized Equity Component 52.5%
• Authorized Trackers: Decoupling (CIP), AIRP and SHARP, Energy Efficiency
Tracker (EET), Recovery of Environmental Costs (RAC)
➢ Growth Drivers MD
MD
• Customer growth – new home construction and conversions
DE
DE
• Multi-year infrastructure investment programs (AIRP, SHARP)
• Periodic base rate cases
South Jersey Gas
980388_1.wor - NY008P5T
• Reliability and Redundancy Projects
VA
VA
10SJI Utilities | Elizabethtown Gas
➢ Overview
• 297,000+ customers served in northern New Jersey
• Densely populated service area in Union; Sparsely populated in Western service area Elizabethtown
Gas
• ~3,200 miles of distribution pipeline
• Regulated by the NJ Board of Public Utilities PA
PA
➢ Regulatory Construct
• Authorized rate base: ~$1.0B
• Authorized ROE: 9.6%
• Authorized Equity Component: 51.5% NJ
NJ
• Authorized Trackers: Weather Normalization, Infrastructure Investment Plan (IIP),
Energy Efficiency Program (EEP), RAC
• Last Rate Case: $34 million revenue increase effective 11/15/19
➢ Growth Drivers
• Customer growth – new home construction and conversions
• Multi-year infrastructure investment program
MD
MD
• Periodic base rate cases
• Reliability and Redundancy Projects DE
DE
• Tangible growth runway extending well beyond 5-year plan
980388_1.wor - NY008P5T
11
VA
VASJI Utilities | Elkton Gas (Sale Pending)
➢ Overview
• 6,700+ customers served in northeast Maryland
• Lightly populated 64-mile Elkton service area
• ~100 miles of pipeline main
PA
PA
• Throughput: Residential ~30% / Commercial ~70%
• Regulated by the MD Public Service Commission (MPSC)
Elkton Gas
➢ Regulatory Construct
• Authorized Rate Base: $9.2M NJ
NJ
• Authorized ROE: 9.8%
• Authorized Equity: 50.0%
• Authorized Trackers: Revenue Normalization Adjustment
➢ Growth Drivers
• Last Rate Case: $0.09M revenue increase authorized 2/19
• Stay-out for 30 months as per the Acquisition proceeding Final Order MD
MD
• Beyond stay out, will seek to recover investments associated with
DE
DE
Pipeline Remediation Plan
980388_1.wor - NY008P5T
VA
VA
12SJI Utilities | Safety is Our Top Priority
➢ Building A Strong Safety Culture
• Tone at the top
• DuPont Engagement – stand-up of comprehensive safety management system
• Enhanced communication and training
• Improving incident metrics – inclusion of leading indicators
• Leverage best of best
➢ Benefits of Strong Safety Culture
• More engaged workforce
• Increased employee retention
• Better recruiting
• Improved customer experience
• Lower claims costs and insurance premiums
• Fewer lost work days
13SJI Utilities | Focus on Customer Experience
➢ Top JD Power Customer Satisfaction Scores
✓ ETG is #1 in peer group for 5th consecutive year
✓ SJG is #3 in same peer group
➢ Cultural Maturity Curves
• SJG Improvement Initiative - People, Processes and Technology
• ETG/ELK’s advanced stage journey
➢ Benefits of Strong Customer Culture
• Enhanced customer growth
• Self-service options lower labor costs
• Lower un-collectibles
• More engaged workforce
• Increased employee retention
• Reduced customer attrition
• Builds trust, credibility and brand awareness
14Customer Growth 15
Customer Growth | South Jersey Gas
      ➢ Long Track Record of Strong Customer Growth
        • SJG customer base grew 1.5% annually from 2009-2019
        • Above-average growth achieved despite varying local economic conditions                                          South Jersey Gas (SJG)
        • Conversions from alternate fuels, including heating oil and propane, outpacing                                     Customer Growth
          new construction adds for a decade                                                             410
                                                                                                                                                                            397
        • 90%+ of new customers are residential, representing ~65% of utility gross margin               400                                                          391
                                                                                                         390                                                    384
                                                                                                                                                          378
      ➢ Conversion Opportunity                                                                           380                                        373

                                                                                             Thousands
                                                                                                                                              367
                                                                                                         370                            362
         • Residential Conversions (single family homes)                                                                          357
                                                                                                         360                351
           o On Main – ~25,000                                                                                       348
                                                                                                         350   344
           o Off Main – ~35,000                                                                          340
                                                                                                         330
         • Commercial Conversions
                                                                                                         320
           o On Main – ~5,000                                                                                  2009 2010 2011 2012 2013 2014 2015 2016 2017 2018 2019
           o Off Main – ~1,700

      ➢ Future Growth
        • Expected 1.6% annualized growth 2018-2022
        • Innovation, partnerships and strategies position us well for future growth
         • Continuation of successful “off main” approach
         • More robust partnerships with the HVAC contractor network

 16
Customer Growth | Elizabethtown Gas
➢ Track Record of Positive Customer Growth
• ETG customer base grew 0.9% annually from 2009-2019, generally in line Elizabethtown Gas (ETG)
with the peer average Customer Growth
• Balanced mix of new construction and conversions from alternate fuels, 300 297
including heating oil and propane 295
294
292
➢ Conversion/Additional Load Opportunity 290
285
287
285 282
Thousands
• Residential Conversions (single family homes) 280
280 278
o Primary Target: ~35,000 customers have gas service, but not currently 277
275
275 273
using for heating
270
o On Main:
265
• Residential ~26,900
260
• Commercial ~8,500 2009 2010 2011 2012 2013 2014 2015 2016 2017 2018 2019
➢ Future Growth
• Expected 1.4% annualized growth 2018-2022
• Opportunity to significantly increase 5-year customer growth rate closer to
SJG rate (~1.6%) driven by enhanced focus on conversion opportunities
• Identifying and pursuing opportunities to introduce natural gas for
new/different applications
17Regulatory Initiatives 18
Regulatory Initiatives | Infrastructure Modernization
     ➢ SJG: Accelerated Infrastructure Replacement Program (AIRP; 2013-Present)
        •   Authorized program by NJBPU designed to continue efforts to enhance the safety and reliability of SJG’s infrastructure system
        •   AIRP I: $141M from 2013-2016 replaced ~360 miles of bare steel and cast-iron mains
        •   AIRP II: Approved in 2016, $302.5M from 2016-2021 to replace remaining cast iron and bare steel
        •   Timely recovery of investment on an annual basis through a separate rider recovery mechanism, with new rates effective on October 1
        • Current Status: On track to complete replacement of all remaining bare steel and cast iron main by 2021

     ➢ SJG: Storm Hardening and Reliability Program (SHARP; 2014-Present)
        •   Following major storms, authorized program by NJBPU to replace low pressure mains in coastal regions
        •   SHARP I: $103.5M from 2014-2017 replaced 92 miles of coastal infrastructure
        •   SHARP II: Approved in 2018, $100M from 2018-2021 focused on 4 targeted system enhancement projects within the barrier islands
        •   Timely recovery of investment on an annual basis through a separate rider recovery mechanism, with new rates effective on October 1
        • Current Status: On track to complete project queue by 2021

     ➢ ETG: Infrastructure Investment Program (IIP; 2019-2024)
        • Consistent with acquisition approval, SJI was required to develop a plan to address remaining aging infrastructure at ETG
        • ETG system has more than 425 miles of aging cast iron and bare steel pipeline
        • In June 2019, NJBPU authorized $300M, five-year infrastructure replacement program effective July 1, 2019 through June 30, 2024
        • Authorized IIP program includes replacement of up to 250 miles of cast iron and bare steel mains and related services in ETG system, as
          well as installation of excess flow valves on new service lines
        • Timely recovery of investment on annual basis through separate rider recovery mechanism, with new rates effective on October 1
        • Current Status: On track to complete replacement of 250 miles of cast iron and bare steel main by 2024

19
Regulatory Initiatives | Calendar 2019/2020
Company Filing Type Objective Filing/Submitted Date Expected Outcome Date
June 2019 Order/
Elizabethtown Gas Infrastructure Replacement Safety and Modernization Filed October 2018
Effective July 1, 2019
Annual Recovery of
South Jersey Gas Safety and Modernization Filed Q2 2019 Effective October 1, 2019
Infrastructure Programs
Elizabethtown Gas Base Rate Case System Reliability and Growth Filed April 2019 Effective November 15, 2019
Engineering/Route Approval
South Jersey Gas Supply Redundancy Filed December 2019 Q2 2020
For LNG Redundancy Project
South Jersey Gas Base Rate Case * System Reliability and Growth Early 2020 Q4 2020
South Jersey Gas / Annual Recovery of
Safety and Modernization Q2 2020 Q4 2020
Elizabethtown Gas Infrastructure Programs
Extension of Infrastructure
South Jersey Gas Safety and Modernization Q4 2020 Q2 2021
Replacement Program
* Base Rate Case
• Pursuant to the AIRP II Extension Order, SJG is required to file next base rate case no later than November 2020
• Estimated to include more than $300M in incremental plant additions since the last base rate case approval, excluding AIRP II & SHARP II
20Non-Utility
Operations
21Non-Utility Operations | Overview
❖ Complementary, non-utility businesses that support Non-Utility
our utility operations
❖ Provide positive net income while remaining modest SJI Midstream South Jersey Energy Solutions
portion of SJI overall earnings
❖ Energy Group, Energy Services and Midstream Pipelines/ Energy Energy
Storage Group Services
❖ Key earnings drivers include fuel
management/commodity marketing and AFUDC from
ELK (Sale Pending) • PennEast Pipeline (20%) • Wholesale Operations • Landfill
PennEast Pipeline investment • Fuel Management • Account Services
• Commodity Marketing
22Non-Utility Operations | Energy Group and Energy Services
ENERGY GROUP
Fuel Supply Management Contracts
➢ Fuel Supply Management
Capacity Volume Current Term
• Natural gas supply to new and existing merchant generation facilities on multi-year contracts Counterparty Location In Service Start Date End Date
(MW) (Dth/Day) (Yrs)
• Services offered are firm supply of fuel to the plant along with daily and intra-day swing service Starwood Marcus Hook, PA 750 80,000 2004 2035 17
• Portfolio of 9 contracts, with 8 currently operational LS Power West Deptford, NJ 738 76,700 2014 2029 15
• Contract terms range from 4 to >15 years Moxie - Liberty Bradford Co, PA 825 137,655 2016 2021 5
• Average contract value is $1.0 to $1.5 million Moxie - Patriot Lycoming Co, PA 825 137,655 2016 2020 4
Panda - Stonewall Leesburg, VA 750 110,000 2017 2021 4
➢ Commodity Marketing Moxie Freedom Luzerne Co, PA 1,029 157,000 2018 2028 10
• Purchase of natural gas from producers and marketers for sale and delivery to retail Lordstown Trumball County, OH 1,025 160,000 2018 2024 5
aggregators or large consumers such as merchant generators, utilities or other marketers Invenergy Lackawanna, PA 1,480 210,000 2018 2029 10
• Capitalize on growing gas demand, Shale production, changing dynamics of pipeline TYR Energy (Hickory Run) Lawrence Co, PA 1,000 162,000 2020 2025 5
infrastructure, and weather volatility
• Efforts focused in Northeast and Mid-Atlantic regions
• Seek to maximize value of our leased transportation assets through a combination of “index
plus” margin contracts, and the ability to arbitrage (i.e. limited commodity/market risk)
ENERGY SERVICES
➢ Energy Production Assets
• Following non-core asset sales in 2018-2019, remaining assets include landfill-to-electric
assets, legacy solar assets and account services
• 2019 economic earnings of $0.1 million
23Non-Utility | PennEast Pipeline
➢ Project Description
• 20% equity owner in 1.1 Bcf/d, 120-mile interstate pipeline from Marcellus region of
Pennsylvania into New Jersey
• Access to low cost supply; benefits customers and local economies
• $200M+ investment withFERC level returns projected
• 90%+ subscribed; 80%+ capacity under 15-year agreements
➢ Recent Actions
• On January 30, the FERC granted, in part, PennEast’s petition for a Declaratory Order
requesting the Commission’s interpretation of the Natural Gas Act, in light of the Third
Circuit’s decision that PennEast was barred from bringing an eminent domain lawsuit
in federal court against the state of New Jersey or its agencies.
• On January 31, PennEast filed with the FERC a request for an amendment of the
certificate to allow the Project to proceed on a phased basis. Phase One would consist
of 68-miles of 36-inch pipe, constructed entirely within Pennsylvania and ready to
deliver natural gas by November 2021. The Phase Two portion would include the
remaining route in Pennsylvania and New Jersey, with a targeted completion of 2023.
• On February 18, PennEast filed a Petition for Certiorari with the US Supreme Court to
review the Third Circuit’s decision.
➢ Current Status
• The PennEast member companies remain fully committed to the project and the affordable,
reliable service it will bring to the region, including nine million Garden State residents
24New Jersey
Energy Master Plan
25New Jersey Energy Master Plan | New Focus For New Jersey
In January, New Jersey Governor Phil Murphy unveiled
the state’s updated Energy Master Plan (EMP)
• The EMP is intended to set forth a strategic vision for the production, distribution,
consumption, and conservation of energy in the State of New Jersey
• The EMP is updated and revised periodically -- allows for improvements to reflect
changes with technology, energy, and environmental developments and demands
• Updated EMP outlines Murphy administration’s goal of 100% clean energy by 2050
• Updated EMP varies dramatically from the prior EMP in 2015 which was heavily
supportive of natural gas as an abundant, clean and affordable commodity
meriting aggressive expansion to homes and businesses in the state
26New Jersey Energy Master Plan | New Opportunities for SJI
SJI Supports the Clean Energy Goals of the EMP
PAST ACTIONS AND INVESTMENTS
❖ REDUCING ENERGY CONSUMPTION/EMISSIONS
✓ Replacement of aging infrastructure, improving safety and reliability for customers and reducing greenhouse gas emissions
(GHG) from fugitive emissions; On track for expected reduction of 500 tons of carbon emissions at current replacement rate
✓ Conservation incentive program (CIP) severed the tie between volumes and margins, encouraging reductions in consumption
❖ DEPLOYMENT OF RENEWABLE ENERGY
✓ Sizable investments in solar, combined heat-and-power (CHP), and landfill-to-electric generation
❖ MAXIMIZING ENERGY EFFICIENCY
✓ Energy Efficiency program (EE) designed to reduce consumption
❖ MODERNIZING VIA TECHNOLOGY
✓ Developed enterprise level environmental policy and management system
FUTURE INVESTMENT OPPORTUNITIES
❖ REDUCING ENERGY CONSUMPTION/EMISSIONS
• Acceleration/extension of NJBPU-approved infrastructure modernization programs
❖ DEPLOYMENT OF RENEWABLE ENERGY
• Solar Installations: SJI corporate facilities, landfill properties, community solar and other development projects
• Renewable Natural Gas (RNG): Investment opportunities including repurposing existing landfills
❖ MAXIMIZING ENERGY EFFICIENCY
• Expansion of existing NJBPU-approved energy efficiency programs to reduce consumption
❖ MODERNIZING VIA TECHNOLOGY
• Smart Meter pilot program for 700,000 utility customers to reduce consumption
272019 Financial Results 28
2019 Financial Results | Highlights

           FINANCIAL PERFORMANCE
             ✓ GAAP earnings of $0.84 per diluted share compared to $0.21 per diluted share in 2018
             ✓ Economic Earnings of $1.12 per diluted share compared to $1.38 per diluted share in 2018
             ✓ Capital spending of $500+ million; 96% allocated to growth, safety and reliability for SJG and ETG customers

           RATE CASES
             ✓ ETG authorized $34 million increase in base rates effective November 15, 2019
             ✓ SJG rate case on track for 1Q 2020 filing

           CUSTOMER GROWTH
             ✓ 9,500+ new customers added, reflecting 1.4% annualized growth rate; 70%+ converted from heating oil or propane

           INFRASTRUCTURE MODERNIZATION
             ✓ SJG infrastructure modernization programs executed on schedule, with rate true-ups on October 1
             ✓ ETG authorized $300 million, five-year infrastructure modernization program, with rate true-ups on October 1

           SUPPLY/SYSTEM REDUNDANCY
             ✓ Submitted engineering/route filing to NJBPU to advance critical non-pipeline supply solution for SJG
             ✓ Accelerated review of critical supply/system reliability solutions for ETG and SJG customers
          BALANCE SHEET
             ✓ $300+ million deployed toward debt repayment, using proceeds from equity forward, and solar and retail marketing asset sales
             ✓ Refinanced debt via $200 million issuance of junior subordinated notes with 60-year duration, with 50% equity credit from S&P

29
2019 Financial Results | Highlights
GOVERNANCE
✓ Formation of ESG Committee that reports directly to Corporate Responsibility Committee of Board
✓ Extensive shareholder engagement in support of optimal alignment of benefits and TSR
✓ Annual independent third-party board evaluation and compensation evaluation
ENVIRONMENT
✓ Developed enterprise level environmental policy and management system
✓ Replacement of 238 miles of cast iron, bare steel and other aging distribution pipe; 39% reduction in fugitive emissions since 2011
✓ On track for expected reduction of 500 tons of carbon emissions at the current pipe replacement rate
SOCIAL
✓ Unwavering commitment to safety as non-negotiable top priority
✓ 43% female workforce; 39% female leadership; and 50% female Senior Officers
✓ JD Power customer satisfaction scores – ETG #1 in peer group for 5th consecutive year; SJG #3 in same peer group
✓ Monetary and employee volunteer support to more than 30 local non-profit organizations
INTEGRATION
✓ Advanced integration of ETG, embedding best practices for people, processes and technology
✓ On track for wind down of transition-services agreement (TSA) with Southern in early 2020
ASSET SALES
✓ Announced sale of Marina Thermal Facility and Elkton Gas, with $100+ million total proceeds targeted for debt repayment
DIVIDENDS
✓ 2.6% increase in indicated annual dividend to $1.18 per diluted share; 21 consecutive years of rising dividends
302019 Financial Results | Consolidated Fiscal 2019
Twelve months ended December 31, 2019 Twelve months ended December 31, 2018
GAAP GAAP Economic Economic GAAP GAAP Economic Economic
Earnings EPS Earnings EPS Earnings EPS Earnings EPS
Utility $122.2 $1.33 $122.2 $1.33 $77.7 $0.92 $88.8 $1.05
Non-Utility ($3.2) ($0.03) $13.8 $0.15 ($12.4) ($0.15) $45.0 $0.53
Other ($41.8) ($0.45) ($33.0) ($0.36) ($47.4) ($0.56) ($17.7) ($0.21)
Total - Continuing Operations $77.2 $0.84 $103.0 $1.12 $17.9 $0.21 $116.2 $1.38
Average Diluted Shares 92.3 92.3 84.5 84.5
312019 Financial Results | Economic Earnings Bridge - 2018 to 2019
• UTILITY: Variance reflects ETG/ELK contribution of $29.1 million driven by full year of ownership and ETG
incremental rate relief effective 11/15/19; and SJG contribution of $4.4 million primarily reflecting customer
growth and infrastructure modernization investment; partially offset by operation and interest costs
• NON-UTILITY: Variance reflects Energy Group contribution of $(33.1) million driven by tighter wholesale
marketing spreads and milder weather which limited asset optimization opportunities and legacy contract
headwinds; partially offset by contributions from Midstream of $1.1 million reflecting AFUDC for PennEast
Pipeline project and Energy Services contribution of $0.7 million driven by legacy energy production activities
• OTHER: Variance reflects acquisition-related financing costs net of debt repayments from asset sales
322019 Financial Results | Consolidated 4Q 2019
Three months ended December 31, 2019 Three months ended December 31, 2018
GAAP GAAP Economic Economic GAAP GAAP Economic Economic
Earnings EPS Earnings EPS Earnings EPS Earnings EPS
Utility $45.8 $0.49 $45.8 $0.49 $36.6 $0.42 $36.6 $0.42
Non-Utility $3.5 $0.04 $6.4 $0.07 $26.8 $0.31 $6.0 $0.07
Other ($9.9) ($0.11) ($8.7) ($0.09) ($17.3) ($0.20) ($9.1) ($0.11)
Total - Continuing Operations $39.5 $0.43 $43.4 $0.47 $46.1 $0.53 $33.5 $0.39
Average Diluted Shares 92.5 92.5 86.4 86.4
332019 Financial Results | Economic Earnings Bridge - Q4’18 to Q4’19
• UTILITY: Variance reflects SJG contribution of $4.7 million and ETG contribution of $4.5 million driven by
customer growth, infrastructure modernization investment and ETG incremental rate relief effective
11/15/19; partially offset by operation and interest costs
• NON-UTILITY: Variance reflects contributions of $0.4 million from Energy Group driven by fuel supply
management activities
• OTHER: Variance reflects acquisition-related financing costs net of debt repayments from asset sales
342019 Financial Results | Segment Information
Fourth Quarter Ended December 31 Year-to-Date Period Ended December 31
Millions Per Diluted Share Millions Per Diluted Share
GAAP Earnings 2019 2018 +/- 2019 2018 +/- GAAP Earnings 2019 2018 +/- 2019 2018 +/-
UTILITY $45.8 $36.6 $9.2 $0.49 $0.42 $0.07 UTILITY $122.2 $77.7 $44.5 $1.33 $0.92 $0.41
SOUTH JERSEY GAS (SJG) $28.3 $23.6 $4.7 $0.31 $0.27 $0.04 SOUTH JERSEY GAS (SJG) $87.4 $82.9 $4.4 $0.95 $0.98 ($0.03)
ELIZABETHTOWN GAS (ETG) $17.2 $12.8 $4.4 $0.19 $0.15 $0.04 ELIZABETHTOWN GAS (ETG) $34.2 ($5.0) $39.2 $0.37 ($0.06) $0.43
ELKTON GAS (ELK) $0.3 $0.2 $0.1 $0.00 $0.00 $0.00 ELKTON GAS (ELK) $0.6 ($0.2) $0.8 $0.01 ($0.00) $0.01
NON-UTILITY $3.5 $26.8 ($23.3) $0.04 $0.31 ($0.27) NON-UTILITY ($3.2) ($12.4) $9.2 ($0.03) ($0.14) $0.11
MIDSTREAM $1.0 $1.1 ($0.1) $0.01 $0.01 ($0.00) MIDSTREAM $4.2 $3.1 $1.1 $0.05 $0.04 $0.01
ENERGY GROUP $9.9 $21.4 ($11.5) $0.11 $0.25 ($0.14) ENERGY GROUP ($0.7) $60.4 ($61.1) ($0.01) $0.72 ($0.73)
ENERGY SERVICES ($7.4) $4.3 ($11.7) ($0.08) $0.05 ($0.13) ENERGY SERVICES ($6.7) ($75.9) $69.2 ($0.07) ($0.90) $0.83
OTHER ($9.9) ($17.3) $7.4 ($0.11) ($0.20) $0.09 OTHER ($41.8) ($47.4) $5.6 ($0.45) ($0.56) $0.11
$39.4 $46.1 ($6.7) $0.43 $0.53 ($0.10) $77.2 $17.9 $59.3 $0.84 $0.21 $0.63
Fourth Quarter Ended December 31 Year-to-Date Period Ended December 31
Millions Per Diluted Share Millions Per Diluted Share
Economic Earnings 2019 2018 +/- 2019 2018 +/- Economic Earnings 2019 2018 +/- 2019 2018 +/-
UTILITY $45.8 $36.6 $9.2 $0.49 $0.42 $0.07 UTILITY $122.2 $88.8 $33.4 $1.33 $1.05 $0.28
SOUTH JERSEY GAS (SJG) $28.3 $23.6 $4.7 $0.31 ($0.11) $0.42 SOUTH JERSEY GAS (SJG) $87.4 $82.9 $4.5 $0.95 $0.98 ($0.03)
ELIZABETHTOWN GAS (ETG) $17.2 $12.8 $4.4 $0.19 $0.15 $0.04 ELIZABETHTOWN GAS (ETG) $34.2 $5.8 $28.4 $0.37 $0.07 $0.30
ELKTON GAS (ELK) $0.3 $0.2 $0.1 $0.00 $0.00 $0.00 ELKTON GAS (ELK) $0.6 $0.1 $0.5 $0.01 $0.00 $0.01
NON-UTILITY $6.4 $6.0 $0.4 $0.07 $0.07 ($0.00) NON-UTILITY $13.8 $45.0 ($31.3) $0.15 $0.53 ($0.38)
MIDSTREAM $1.0 $1.1 ($0.1) $0.01 $0.01 ($0.00) MIDSTREAM $4.2 $3.1 $1.1 $0.05 $0.04 $0.01
ENERGY GROUP $5.0 $4.5 $0.5 $0.05 $0.05 $0.00 ENERGY GROUP $9.5 $42.6 ($33.1) $0.10 $0.50 ($0.40)
Fuel Supply Management $3.2 $2.3 $0.9 $0.04 $0.03 $0.01 Fuel Supply Management $10.9 $8.6 $2.3 $0.12 $0.10 $0.02
Wholesale Marketing $1.3 $2.1 ($0.8) $0.01 $0.02 ($0.01) Wholesale Marketing ($2.2) $35.0 ($37.2) ($0.02) $0.41 ($0.43)
Retail Marketing $0.2 $0.1 $0.1 $0.00 $0.00 $0.00 Retail Marketing $0.4 ($1.2) $1.6 $0.00 ($0.01) $0.01
Other $0.2 $0.0 $0.2 $0.00 $0.00 $0.00 Other $0.3 $0.2 $0.1 $0.00 $0.00 $0.00
ENERGY SERVICES $0.4 $0.4 $0.0 $0.00 $0.00 ($0.00) ENERGY SERVICES $0.1 ($0.6) $0.7 $0.00 ($0.01) $0.01
Non-GAAP, see "Explanation and CHP $0.8 ($1.9) $2.7 $0.01 ($0.02) $0.03 CHP $2.0 ($2.4) $4.4 $0.02 ($0.03) $0.05
Reconciliation of Non-GAAP
Solar ($0.2) $3.0 ($3.2) ($0.00) $0.03 ($0.04) Solar ($0.3) $3.3 ($3.6) ($0.00) $0.04 ($0.04)
Financial Measures."
Landfill ($1.1) ($1.2) $0.1 ($0.01) ($0.01) $0.00 Landfill ($4.1) ($3.7) ($0.4) ($0.04) ($0.04) ($0.00)
Note: Earnings are in millions.
Account Services $0.8 $0.5 $0.3 $0.01 $0.01 $0.00 Account Services $2.5 $2.1 $0.4 $0.03 $0.03 $0.00
Amounts and/or EPS may not
add due to rounding. OTHER ($8.7) ($9.1) $0.4 ($0.09) ($0.11) $0.02 OTHER ($33.0) ($17.7) ($15.3) ($0.36) ($0.21) ($0.15)
$43.4 $33.5 $9.9 $0.47 $0.39 $0.08 $103.0 $116.2 ($13.2) $1.12 $1.38 ($0.26)
352019 Financial Results | Capital Expenditures
$504 Million Capital Spending in 2019 Consolidated ($millions)
2019A Safety & Annual
CAPEX Reliability Recovery
78% Invested in Safety & Reliability
UTILITY $479
System Growth & Maintenance $247 X
UTILITY Infrastructure Modernization $141 X X
• System Growth & Maintenance includes projects to enhance the safety and New Business $91
reliability of SJG and ETG systems Redundancy Projects $0 X
• Infrastructure Modernization includes the replacement of aging pipeline for SJG NON-UTILITY $25
(AIRP, SHARP) and ETG (IIP), with costs recovered annually on October 1 Midstream $5 X
Energy Group $0
• New Business includes the addition of new customers to our system; 1.4% Energy Services $2
annualized growth rate; 70%+ of 9,500+ new customers converted from alternate Other $18
fuels in 2019
Total Capital Expenditures $504 78% 28%
• Redundancy Projects include investments in support of critical supply and system
reliability for SJG and ETG customers
NON-UTILITY
• Incudes our 20% equity investment in the PennEast Pipeline project; investments
to provide essential services to utilities, power generators and industrial
customers through wholesale marketing, fuel management, consulting and other
services; and legacy energy production assets
362019 Financial Results | Financing Recap
$464 Million Net Financing in 2019 ($millions) 2019A
Cash Flow From Operations $121
Balance Sheet Strengthening Remained Core Focus Cash Flow From Investing, Net of Asset Sales ($478)
Dividends ($107)
NON-CORE ASSET SALES Free Cash Flow ($464)
• $189 million settlement of equity forward, deployed for debt repayment
• $300+ million sale of solar and retail gas marketing, deployed for debt repayment Financing Acitivites
Common Equity $189
REFINANCING Debt Proceeds, Net $271
Other $4
• $194+ million from issuance of 60-yr junior subordinated notes for debt refinancing;
Total Financing Activities $464
S&P assigned equity credit of 50% due to long duration/deep subordination of notes
CAPITALIZATION
• GAAP Equity-to-total capitalization (12/31/19): 29.6%
• GAAP Equity-to-total capitalization (12/31/18): 28.9%
• Conversion of mandatory convertible equity units due 2021 ($287.5 million)
• Non-GAAP Equity-to-total capitalization (12/31/19): 37.5%
• Non-GAAP Equity-to-total capitalization (12/31/18): 35.3%
LIQUIDITY
• Total facilities (12/31/19): $1.06B; $860.0M drawn/$200.0M available
*Note: ST Debt includes current maturities of LT Debt
372020 Financial Outlook 38
2020 Financial Outlook | Priorities

         FINANCIAL PERFORMANCE
           •   Economic Earnings guidance range $1.50 to $1.60 per diluted share, with ~75% from utility operations
           •   Capital spending $600+ million, with $500+ million allocated to growth, safety and reliability and $100+ million
           •   targeted for solar investment in support of updated New Jersey Energy Master Plan (EMP) goals
           •   Increase in indicated annual dividend ~3%, subject to Board approval, continuing trend toward 55-65% payout ratio target

         GENERAL RATE CASES
           • Execute SJG rate case consistent with historic precedent

         CUSTOMER GROWTH
           • 10,000+ new customers, reflecting 1.5% annualized growth rate; 70%+ conversions from oil and propane

         INFRASTRUCTURE MODERNIZATION
           • Execute infrastructure modernization programs for SJG and ETG on schedule, with rate true-ups on October 1
           • File for extension of SJG accelerated replacement program
         SUPPLY/SYSTEM REDUNDANCY
           • Advance critical non-pipeline supply solution for SJG
           • Complete review of critical reliability solutions for ETG
         BALANCE SHEET
           • Strengthening driven by $100+ million debt repayment from pending sale of Marina Thermal Facility and Elkton Gas
           • Equity issuance in support of utility redundancy project

39
2020 Financial Outlook | Economic Earnings Guidance: $1.50-$1.60 Per Diluted Share
Economic Earnings Guidance Primarily Reflects: Consolidated 2019A 2020E
($millions, except EPS) Economic Earnings Economic Earnings
Utility operations ~75% of earnings, excluding acquisition-related interest costs
o ~$500 million capital spending on growth, safety and reliability for SJG/ETG customers UTILITY $122 $130 - $140
o 10,000+ new gas utility customers, reflecting 1.5% customer growth, driven by accelerated pace at ETG NON-UTILITY $14 $45 - $55
o Lower operating costs, driven by business transformation activities OTHER ($33) ($35) - ($45)
o Infrastructure modernization at SJG/ETG under existing programs Total $103 $140 - $150
o Execution of regulatory initiatives, including recovery of utility investment
Average Diluted Shares 92.3 93.3 - 93.7
Non-Utility operations ~25% of earnings, excluding acquisition-related interest costs
o Energy Services: $100+ million on renewable solar installations in support of EMP, and landfill exit Diluted EPS * $1.12 $1.50 - $1.60
o Energy Group: Fuel management contracts, reshaped wholesale portfolio and contract expiration
o Midstream: AFUDC associated with PennEast Pipeline project Capital Expenditures $504 $625 - $655
Balance sheet strengthening, driven by pending asset sales and refinancing activities * Changes in events or other circumstances that the Company cannot currently
anticipate could materially impact earnings and could result in earnings for
2020 significantly above or below this outlook
Equity issuance in support of utility redundancy project
402020 Financial Outlook | Economic Earnings Bridge - 2019 to 2020 Midpoints
• UTILITY: Midpoint variance reflects ETG rate relief; 10,000+ new customers; infrastructure investment under
modernization programs; benefits from business transformation activities and execution of SJG regulatory
initiatives (rate case & redundancy project)
• NON-UTILITY: Midpoint variance reflects Energy Group contribution of $10-15 million driven by fuel
management, reshaped wholesale portfolio and expiration of legacy contracts; Energy Services contribution of
$20-$25 million driven by solar investment in support of NJ Energy Master Plan (EMP) and legacy energy
production activities; and Midstream contribution of $1.0 million driven by AFUDC for PennEast Pipeline project
• OTHER: Midpoint variance reflects acquisition-related financing costs, net of debt repayments from asset sales
412020 Financial Outlook | Updated Guidance Vs. Prior Guidance
• NON-UTILITY: Midpoint variance reflects Energy Services contribution of $18 million primarily from
solar investment in support of NJ Energy Master Plan (EMP) net of Marina Thermal Facility (MTF)
sale; partially offset by Midstream contribution of ($11) million reflecting adjusted timing for
PennEast Pipeline project
• UTILITY: Midpoint variance reflects pending sale of Elkton Gas (ELK) and timing associated with
regulatory initiatives including SJG base rate case and SJG supply redundancy project
• OTHER: Midpoint variance reflects acquisition-related financing costs net of debt repayments
422020 Financial Outlook | Capital Expenditures
$625+ Million Anticipated Capital Spending in 2020 Consolidated ($millions)
2019A
CAPEX
2020E
CAPEX
Safety &
Reliability
Annual
Recovery
67% Targeted for Safety & Reliability UTILITY $479 $480 - $500
System Growth & Maintenance $247 $210 - $215 X
Infrastructure Modernization $141 $165 - $170 X X
UTILITY New Business $91 $85 - $90
Redundancy Projects $0 $20 - $25 X
• System Growth & Maintenance includes myriad projects to enhance the safety and
reliability of SJG and ETG systems; Variance reflects timing of certain projects NON-UTILITY $25 $145 - $155
Midstream $5 $25 - $30 X
Energy Group $0 $10 - $10
• Infrastructure Modernization includes the replacement of aging pipeline for SJG (AIRP,
Energy Services $2 $110 -$115
SHARP) and ETG (IIP), with costs recovered annually on October 1; Variance reflects NJBPU Other $18 $0
authorization of ETG’s IIP in 2019
Total Capital Spending, Net $504 $625 - $655 67% 26%
• New Business includes addition of customers to our system; Variance reflects 10,000+ new
customers, 1.5% growth rate, 70%+ converting from alternate fuels
• Redundancy Projects include investments in support of critical supply and system reliability
for SJG and ETG customers; Variance reflects timing of certain projects
NON-UTILITY
• Non-Utility includes investment in Energy Services, Energy Group and Midstream
• Variance largely reflects solar investments focused on SJI Corporate facilities, landfill
properties, community solar and other development projects in support of the EMP; and
investments in PennEast Pipeline project
432020 Financial Outlook | Redundancy Projects
$20+ Million Anticipated Spending in 2020
on Critical Redundancy Projects
• In response to the NJBPU's call for utilities to evaluate preparedness for supply
interruptions, we have evaluated potential redundancy solutions for SJG and ETG
• These projects are important to ensure service is not interrupted to customers in
the event of a significant outage, either behind our city gate, or on one of the
two interstate pipelines that serve the SJG system
• We have evaluated multiple options including redundant supply feeds and large-
scale storage and liquefaction
• In December 2019, SJG submitted an engineering/route filing to the NJBPU for
approval to construct needed system upgrades in support of a planned 2.0+ Bcf
liquefied natural gas (LNG) facility that would provide 15 days of critical supply
for SJG customers
• Anticipated cost $300+ million; In-service 2023
A resolution from the NJBPU is expected in 2020
442020 Financial Outlook | EMP Projects
$100+ Million Anticipated Spending in 2020
on EMP-Supportive Projects
Solar Investment focused on SJI corporate facilities,
landfill properties, community solar and other development projects
Targeting Additional Utility & Non-Utility Investment Opportunities:
• REDUCING ENERGY CONSUMPTION/EMISSIONS (UTILITY SOLUTION)
o Acceleration/extension of NJBPU-approved infrastructure modernization programs
• ACCELERATING DEPLOYMENT OF RENEWABLE ENERGY (UTILITY/NON-UTILITY SOLUTIONS)
o Renewable Natural Gas (RNG): Investment opportunities including repurposing existing landfills
o Solar: SJI corporate facilities, landfill properties, community solar and other development projects
• MAXIMIZING ENERGY EFFICIENCY (UTILITY SOLUTION)
o Expansion of existing NJBPU-approved energy efficiency programs to reduce consumption
• MODERNIZING VIA TECHNOLOGY (UTILITY SOLUTION)
o Smart Meter pilot program for 700,000 utility customers to reduce consumption
452020 Financial Outlook | Financing Plan
$365+ Million Anticipated Net Financing in 2020 ($millions)
Cash Flow From Operations
2019A
$121
2020E
$255 - $265
Balance Sheet Strengthening Remains Core Focus Cash Flow From Investing, Net of Asset Sales
Dividends
($478)
($107)
($520) - ($550)
($110) - ($112)
Free Cash Flow ($464) ($365) - ($407)
• Committed to a capital structure that supports our regulated-driven capital
Financing Acitivites
spending plan while maintaining a balanced equity-to-total capitalization,
Common Equity $189 $150 - $175
ample liquidity and a solid investment grade credit rating Debt Proceeds, Net $271 $215 - $232
Other $4 $0
• $100+ million in asset sale proceeds anticipated from sale of MTF and ELK, Total Financing Activities $464 $365 - $407
with majority used for debt prepayment
Long-Term Debt Maturities
• $215+ million net debt financing in support of capital spending plan $1,000
$900
• $150+ million equity issuance anticipated in support of planned LNG $800
redundancy project for SJG $700 $418
$600
Millions
$500
Financing plans are reflected in our earnings and EPS growth $400 $28
estimates and are expected to support current credit metrics $300
$468
$200 $405
$100 $31 $40
$40
$66 $40 $65
$0
2020 2021 2022 2023 2024
SJI SJG
Note:
• SJG - 2020 includes $400 million term loan maturing April 26, 2020
• SJI - 2021 includes $289 million Mandatory Convertible Equity Units maturing April 25, 2021
46Non-GAAP Financial Measures
Management uses the non-generally accepted accounting principles (non-GAAP) financial measures of Economic Earnings and Economic Earnings per share when
evaluating its results of operations. These non-GAAP financial measures should not be considered as an alternative to GAAP measures, such as net income, operating
income, earnings per share from continuing operations or any other GAAP measure of liquidity or financial performance.
Economic Earnings is a significant performance metric used by our management to indicate the amount and timing of income from continuing operations that we expect
to earn after taking into account the impact of derivative instruments on the related transactions, those transactions or contractual arrangements where the true
economic impact will be realized primarily in a future period or was realized in a previous period, and other events that management believes make period to period
comparisons of SJI's operations difficult or potentially confusing. Specifically regarding derivatives, we believe that this financial measure indicates to investors the
profitability of the entire derivative-related transaction and not just the portion that is subject to mark-to-market valuation under GAAP. We believe that considering only
the change in market value on the derivative side of the transaction can produce a false sense as to the ultimate profitability of the total transaction as no change in value
is reflected for the non-derivative portion of the transaction.
We define Economic Earnings as: Income from continuing operations, (i) less the change in unrealized gains and plus the change in unrealized losses on all derivative
transactions; (ii) less realized gains and plus realized losses on all commodity derivative transactions attributed to expected purchases of gas in storage to match the
recognition of these gains and losses with the recognition of the related cost of the gas in storage in the period of withdrawal; (iii) less the impact of transactions or
contractual arrangements where the true economic impact will be realized in a future period, along with other events that management believes make period to period
comparisons of SJI's operations difficult or potentially confusing.
Please refer to our annual report on form 10-k and other SEC filings where the reconciliations to GAAP earnings can be found.
47You can also read


