LOW-CARBON DEVELOPMENT FOR MEXICO - LOW CARBON GROWTH COUNTRY STUDIES PROGRAM MITIGATING CLIMATE CHANGE THROUGH DEVELOPMENT

Page created by Douglas French
 
CONTINUE READING
LOW-CARBON DEVELOPMENT FOR MEXICO - LOW CARBON GROWTH COUNTRY STUDIES PROGRAM MITIGATING CLIMATE CHANGE THROUGH DEVELOPMENT
Briefing Note 003/10

                                   Low-Carbon
                         Development for Mexico

Low C a r b o n G r ow t h Co u n t ry St u d i e s P r o g r a m

            Mitigating Climate Change THROUGH DEVELOPMENT

                                      Mitigating Climate Change in Mexico   |   a
LOW-CARBON DEVELOPMENT FOR MEXICO - LOW CARBON GROWTH COUNTRY STUDIES PROGRAM MITIGATING CLIMATE CHANGE THROUGH DEVELOPMENT
Mitigating Climate Change in Mexico

                                                                    LOW-CARBON DEVELOPMENT IS POSSIBLE
                                                                    FOR MEXICO

                                                                    M
                                                                               exico has the potential to rapidly move towards a low-carbon
                                                                               future. Currently, there are a broad number of cost-effective mea-
                                                                               sures for reducing greenhouse gas (GHG) emissions, such as energy
                                                                    efficiency and sustainable transport interventions, being implemented in
                                                                    Mexico. At the same time, barriers exist to expanding many low-carbon
                                                                    interventions, ranging from information gaps to regulatory and policy bar-
                                                                    riers. By undertaking selective interventions, Mexico can benefit its national
Low C a r b o n G r ow t h Co u n t ry St u d i e s P r o g r a m   economy, demonstrating to the world the importance of low-carbon devel-
                                                                    opment to avoid the negative impacts of climate change.
                                                                        Mexico is Latin America’s largest fossil fuel-consuming country. The
                                                                    majority of the country’s GHG emissions come from energy production and
                                                                    consumption. Low-Carbon Development for Mexico provides an analysis of
Table of Contents                                                   how the country could significantly reduce its GHG emissions without hin-
                                                                    dering economic growth (Box 1). Beyond Mexico, the report provides useful
Low-Carbon Development is Possible for Mexico    1                  lessons on low-cost interventions commonly employed in a variety of devel-
                                                                    oping and industrial countries. With climate change at the forefront of global
Mitigation Options for Mexico   2                                   policy, low-carbon development is no longer an option for developing coun-
                                                                    tries and middle-income nations like Mexico.
A Low-Carbon Scenario for Mexico     13                                 Climate change is a central part of Mexico’s national development policy as
                                                                    established in the National Climate Change Strategy (Estrategia Nacional de
Acronyms and Abbreviations      20                                  Cambio Climático, 2007), which outlines medium- to long-term goals for
                                                                    adaptation and mitigation. Mexico has taken a committed stance to reducing
                                                                    GHG emissions, as seen in its targets announced at the United Nations Climate
                                                                    Change Conference in Poznan, Poland, in 2008, and its recently published
                                                                    Programa Especial de Cambio Climatico, which sets out a broad program to
                                                                    address climate change.
                                                                        This overview highlights the main findings of Low-Carbon Development
                                                                    for Mexico, specifically the logic of low-carbon growth within the country’s
                                                                    development goals and priorities, GHG mitigation opportunities, and the
                                                                    additional costs and benefits of lower carbon growth.

 b | Low-Carbon Growth Country Studies Program
LOW-CARBON DEVELOPMENT FOR MEXICO - LOW CARBON GROWTH COUNTRY STUDIES PROGRAM MITIGATING CLIMATE CHANGE THROUGH DEVELOPMENT
Box 1       |   Getting Started                                                                                       Box 2         |   Mexico’s Low-Carbon Intervention Analysis: Criteria to Prioritize Options

   Low-Carbon Development for Mexico or México: Estudio Sobre la Disminución de Emisiones                                   In Mexico, 40 near-term priority mitigation measures have been identified using 3 principal criteria to
   de Carbono (MEDEC)1, was two years in the making based on a study by the World Bank                                      rank options to 2030:
   for the Mexican government, with the help of the Energy Sector Management Assistance                                     1. CO2 emission reduction potential. An intervention must generate 5 million tons of CO2 equivalent
   Program (ESMAP). It evaluates the potential for GHG reduction in Mexico over the coming                                     (CO2e) emission reductions from 2009 to 2030.
   decades. A common methodology is used to evaluate low-carbon interventions across key                                    2. Low cost per ton of CO2e reduced. Only interventions with positive economic and social rates of
   emission sectors that form the basis for a low-carbon scenario to the year 2030. Analysis                                   return (at a given discount rate or cost of capital) and an abatement cost of US$25 per ton CO2e
                                                                                                                               reduced or less were considered. Interventions with positive net benefits are “no-regrets” measures
   is presented using reader-friendly charts, graphs, and annotations organized in chapters
                                                                                                                               since the financial and economic benefits more than cover the costs.
   according to the key emission sectors, allowing for a quick overview of priority issues.
                                                                                                                            3. Feasibility of implementation. Determined by sector experts who considered technical potential,
      This volume is the work of an international team of economists and researchers. It was
                                                                                                                               market development, and institutional needs; and by government officials who considered the politi-
   prepared by Todd M. Johnson, an energy specialist in the Sustainable Development Depart-                                    cal and institutional feasibility of scaling up interventions across the economy. Before adopting an
   ment of the Latin American and the Caribbean Region; Claudio Alatorre, a consultant with                                    intervention, public discussion with sector experts, government officials, the private sector, and
   expertise in energy transition programs; Zayra Romo, a power specialist in the Africa Energy                                civil society will take place. All selected interventions have already been implemented, at least on
   Unit; and Feng Liu, an energy specialist with the Energy Sector Management Assistance                                       a pilot level, in Mexico or in other countries in similar conditions. Some interventions face barriers
                                                                                                                               in the short term (next five years) but it is considered that these barriers can be removed in the
   Program.
                                                                                                                               medium term.
   English Paperback 7 x 10
   January 2010 | World Bank
   ISBN: 0-8213-8122-9 | ISBN-13: 978-0-8213-8122-9                                                                                        Step 1.             Step 2.                Step 3.
                                                                                                                                         Potential            Net Cost             Feasibility of
   1
       Johnson, T. M., C Alatorre, Z. Romo, and F. Liu. 2010. México: Estudio Sobre la Disminución de Emisiones                           for GHG             of GHG              Implementation
       de Carbono (MEDEC). The World Bank, Washington, DC.                                                                               Reduction           Reduction                                     MEDEC
                                                                                                                                                                                                        Interventions

                           MITIGATION OPTIONS FOR MEXICO
                                                                                                                   Figure 1: Mexico’s GHG Emissions Inventory, 1990, 1996, 2002, and 2006*
                           Current GHG emissions and trends in Mexico indicate future potential for reduc-         Excluding Land-Use, Land-Use Change, and Forestry (LULUCF)
                           tion. Energy consumption currently dominates Mexico’s GHG emissions,
                           accounting for 61 percent of GHG emissions in 2002; followed by land-use,                        700.00
                           forestry, and agriculture (21 percent) and wastes—solid and liquid (10 percent;
                                                                                                                            600.00
                           Figure 1).
                                                                                                                                                                                                              Waste
                               Low-Carbon Development for Mexico evaluates low-carbon interventions in
                                                                                                                            500.00
                           five principal sectors:                                                                                                                                                            Agriculture

                                                                                                                   MtCO2e
                           • Electric Power—the production and distribution of electricity                                  400.00                                                                            Industrial
                           • Oil and Gas—the extraction, processing, and distribution of oil and gas                                                                                                          Processes
                           • Energy End-Use—the potential for energy efficiency in the manufacturing                        300.00
                                                                                                                                                                                                              Energy Production
                             and construction industries, and the residential, commercial, and public                                                                                                         & Consumption
                             sectors                                                                                        200.00
                           • Transport—primarily road transportation
                                                                                                                            100.00
                           • Agriculture and Forestry—crop and timber production, forest land manage-
                             ment, and biomass energy
                           It uses a cost analysis to look at interventions projected to 2030 and also considers
                                                                                                                                               1990          1996          2002          2006*
                           immediate changes that can be implemented and operational within 5 to 10
                           years (Box 2).
                                                                                                                   Source: National Greenhouse Gas Inventory, 1990-2002
                                                                                                                   *Preliminary data from the National Ecology Institute

2 | Low-Carbon Growth Country Studies Program                                                                                                                                                Mitigating Climate Change in Mexico        |   3
LOW-CARBON DEVELOPMENT FOR MEXICO - LOW CARBON GROWTH COUNTRY STUDIES PROGRAM MITIGATING CLIMATE CHANGE THROUGH DEVELOPMENT
Electric Power | Supply Efficiency and Renewables

                   Demand for electric power has been growing faster than gross domestic product (GDP) in
                   recent decades and is likely to continue for the foreseeable future with associated growth in
                   electricity use across the economy. In a business-as-usual (BAU) scenario, total carbon
                   dioxide equivalent (CO2e) emissions from power generation would increase by 230 percent
                   between 2008 and 2030—from 138 to 312 Mt CO2e—to meet the increasing demand for
                   power. In this scenario, the use of fossil fuel-fired power generation would increase—
                   because they are least-cost without considering global environmental externalities—with
                   coal accounting for 37 percent of new installed capacity, and natural gas 25 percent.
                      If the net cost of CO2e is set at US$10/ton, additional low carbon energy technologies—
                   small hydropower, wind, biomass, geothermal, cogeneration—could replace much of the
                   fossil fuel generation, principally coal, but also natural gas, in the BAU scenario. Then,
                   power generation would look very different in 2030 (Figure 2). Under the low-carbon sce-
                   nario, cogeneration (i.e., the combined generation of heat and electricity in the same facility)
                   could provide 13 percent of new power capacity at net costs1 that are less than current
                   marginal costs of power generation in Mexico.
                      Expanding renewable energy and energy efficiency in the power sector would require
                   several policy and regulatory changes (Table 1). For example, the cost of wind power gen-
                   eration is among the lowest in the world due to high-quality wind resources in the Isthmus
                   of Tehuantepec. Unfortunately, excessively low planning prices that do not account for
                   fossil-fuel power generation, a lack of recognition of the portfolio effect in power planning,
                   and ill-fitting procurement procedures hamper the development of wind and other renew-
                   able energy projects.

                   Figure 2: Power Generation in 2030: BAU vs. Low Carbon Scenario

                                          700                                          Efficiency

                                          600                                          Biomass

                                                                                       Wind
                 Power generation [TWh]

                                          500
                                                                                       Hydro
                                          400                                          Geothermal

                                          300                                          Nuclear

                                                                                       Natural gas cogeneration
                                          200
                                                                                       Natural gas
                                          100                                          Fuel Oil + other fossil fuels

                                           0                                           Coal and coke
                                                2008    2030       2030
                                                       Baseline   Medec

            1.
                  osts were calculated by comparing the net costs (including capital, energy, operations, and mainte-
                 C
                 nance) of each low-carbon technology with the costs of the displaced coal and natural gas capacity.

4 | Low-Carbon Growth Country Studies Program                                                                            Mitigating Climate Change in Mexico   |   5
LOW-CARBON DEVELOPMENT FOR MEXICO - LOW CARBON GROWTH COUNTRY STUDIES PROGRAM MITIGATING CLIMATE CHANGE THROUGH DEVELOPMENT
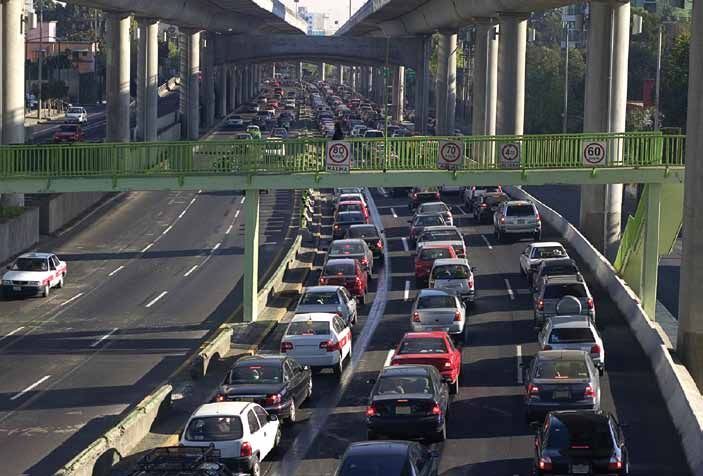
Table 1: Barriers to Low Carbon Development in the Mexican Power Sector
BARRIERS                                       CORRECTIVE ACTIONS
  Large-Scale Projects
 Power sector planning is based on             se appropriate fuel price scenarios for electricity planning
                                              U
 low fuel price scenarios                     (not necessarily the same scenarios used for oil sector planning)
 Power sector planning seeks least cost        odify the planning procedures to assess and consider, in addition
                                              M
 technology and does not consider             to costs, volatility risks associated with the different technologies, and
 portfolio approach                           to minimize the overall risk and cost of the portfolio in the long term
Power sector planning does not
	                                     Include other benefits, such as local environmental externalities,
consider ex-plant infrastructure costs all infrastructure costs (e.g., ports, pipelines, transmission lines),
and co-benefits                        and possible carbon mitigation revenues
 Only large-scale projects can                 llow small-scale renewable energy and cogeneration projects to
                                              A
 participate in bidding processes             offer partial capacity in bidding processes
 Social conflicts for large hydropower         ut in place better negotiation mechanisms for the planning,
                                              P
 projects                                     construction, and operation of hydropower plants, such as those
                                              proposed by the World Commission on Dams2
SMALL-Scale Projects
 No predefined contracting                    Develop small power purchase agreements
 procedures to allow renewable energy
 and cogeneration projects
 to sell electricity to the grid
 Renewable energy generators are               evelop payment systems that reward all benefits, including capacity,
                                              D
 only paid short-term marginal costs          risk reduction, and externalities (including carbon payments)                Table 2: Low-Carbon Interventions in the Oil and Gas Sector
 and capacity                                                                                                                                              Maximum annual emission                       Net cost or benefit of
 No capacity payments for                                                                                                    Interventions                 CORRECTIVE ACTIONS (MtCO2e/year)              mitigation (US$/tCO2e)
 cogeneration projects                                                                                                      Cogeneration in PEMEX                       26.7                                    28.6 (benefit)
 Difficulties in obtaining local and          Implement streamlined licensing procedures
                                                                                                                            Gas leakage reduction                       0.8                                     4.4 (benefit)
 federal licenses
                                                                                                                            Refinery efficiency                         2.5                                       16.6 (cost)
 Transmission bottlenecks                     Expand transmission capacity in areas with large renewable
                                              energy potential

                                                                                                                               Allowing the private sector to tap cogeneration potential and reduce gas flaring and
                Oil and Gas | Increase Efficiency and Gas Production                                                       leakage could lower the need for “public” investment. The low-carbon scenario already
                                                                                                                           envisions a major increase in the absolute amount of natural gas consumption. Successful
                GHG emissions can be reduced in the oil and gas sector (Table 2) through no-regrets and                    implementation of the Government’s plan to expand natural gas production is extremely
                low-cost interventions, such as reducing gas distribution leakage; improving the efficiency                important. Recent measures to expand natural gas production (29 percent between 2000
                in PEMEX oil, gas, and refining facilities; and introducing cogeneration in six PEMEX                      and 2007) have lagged compared to rising demand (38 percent in the same period), resulting
                refineries and four petrochemical plants (representing more than 6 percent of Mexico’s                     in significant gas imports, mainly from the U.S.
                current installed power capacity). Developing this potential will require a regulatory
                framework that enables and encourages the sale of excess energy and capacity to the
                electricity grid.                                                                                          Energy End-Use | Available Low-Cost Interventions
                    From PEMEX’s perspective, while having excellent rates of return, investments in cogen-
                eration and reductions in gas leakage, for example, are less attractive than oil exploration               Electricity demand is rapidly growing–over 4 percent per year since 1995. Energy efficiency
                and development. Financing of investment is also difficult due to PEMEX’s high debt and                    measures will be critical for the management of electricity and fuel demand growth, and
                oil revenues that account for over one-third of Mexico’s federal budget—but the oil industry               mitigation of GHG emissions.
                only accounts for around three percent of GDP—which constrains the Government from                            Over half of industrial energy use occurs in the cement; iron and steel; and chemicals
                taking measures that reduce tax payments from PEMEX in the short term.                                     and petrochemicals industries. Some of the large-scale basic materials industries in Mexico,
                                                                                                                           such as iron and steel and cement, are among the most efficient internationally. At the same
                                                                                                                           time, a great portion of Mexico’s industrial sector is made up of small and medium enterprises
                                                                                                                           that have relatively high energy intensity, often using old equipment and lacking access to
                2.
                     “Dams and Development. A New Framework for Decision-Making.” The Report of the World Commission
                     on Dams. Available from www.dams.org.
                                                                                                                           technical know-how and financing for upgrades. The main sources of energy savings in the

6 | Low-Carbon Growth Country Studies Program                                                                                                                                                 Mitigating Climate Change in Mexico   |   7
LOW-CARBON DEVELOPMENT FOR MEXICO - LOW CARBON GROWTH COUNTRY STUDIES PROGRAM MITIGATING CLIMATE CHANGE THROUGH DEVELOPMENT
industrial sector come from energy efficiency improvements in motor and steam systems,
                kilns and furnaces, as well as from cogeneration. More than 80 percent of Mexico’s indus-
                trial cogeneration potential has not been utilized.
                    Air conditioning, refrigeration, and electronics are expected to be the main growth areas
                of residential electricity demand and thus are prominently featured in the low-carbon inter-
                ventions in the sector (Table 3). Air conditioner (AC) saturation rates are about 20 percent
                (2005), compared with about 95 percent in regions of the U.S. with similar cooling-degree
                days. The saturation rate of refrigerators is relatively high at 82 percent (2006), but is still
                expected to grow considerably. Notwithstanding recent efforts to promote compact fluores-
                cent lamps (CFLs), incandescent lamps still account for about 80 percent of the in-use
                residential light bulbs in country, indicating large potential for scaling up. There is also a
                significant mitigation potential in thermal applications, by means of solar water heating in
                urban areas and improved fuelwood cookstoves in rural areas (Box 3). Although currently
                small (4 percent of total energy use and 11 percent of electricity), energy use by the com-
                mercial and public sectors is expected to grow significantly in the future.
                    Policies to improve efficiency in the residential, commercial, and public sectors—
                including tightening and enforcing efficiency standards for lighting, air conditioning, refrig-     Box 3 | Improved Cookstoves—Time Savings and Health Benefits
                eration, and buildings—will be critical to limit future GHG emissions. The investment
                required in all electricity efficiency interventions is significantly less than the investment in    Improved cookstoves provide major benefits to households and society.
                power plants that would otherwise be needed. In other words, “negawatts” from energy                 Not only are they a cost effective tool for reducing GHG emissions,
                efficiency are almost always cheaper than megawatts.                                                 improved cookstoves are of major benefit to households and society:
                                                                                                                     saving time—family members do not have to collect as much fuelwood;
                                                                                                                     and improving health—reduces exposure to fine particulate matter
                Transport | Enhance Public Transport and Vehicle Fleet Efficiency                                    (PM2.5) and carbon monoxide (CO). The net benefit of the intervention
                                                                                                                     is increased from essentially 0 to US$2.34 when time savings are includ-
                Transport is the largest and fastest growth area for both energy consumption and GHG                 ed and to US$18.90 when both time and health benefits are included.
                emissions in Mexico; around 90 percent of these emissions result from road transport. In             With approximately 80 percent of the rural population in Mexico depen-
                the past 10 years, the country’s vehicle fleet has nearly tripled (from 8 to 21 million vehicles     dent on wood for cooking and heating (reported in Armendáriz et al.,
                in 1996-2006), while energy use by road transport has increased over four fold since 1973.           2008), the GHG mitigation potential of widespread introduction of
                The import of used American vehicles is an important factor behind the surge, increasing             improved cookstoves is substantial.
                the average age of the vehicle fleet and raising concerns about low gas mileage and increased
                GHG emissions.
                                                                                                                                                       Per Ton Mitigation Costs of Improved Cookstoves (US$/ton)

                                                                                                                         Net benefits   Net costs
                                                                                                                                                                 Without       With time          With time
Table 3. Low Carbon Interventions in the Energy End-Use Sector
                                                                                                                                                            time savings and savings and         savings and
                                                              MAXIMUM ANNUAL             NET COST OR                                                           local health   without local      local health

                                                                                                                                (US$/ton CO2e
                                                             EMISSION REDUCTION      BENEFIT OF MITIGATION                                                       impacts     health impacts        impacts
INTERVENTIONS                                                  (MTCO2E/YEAR)              (US$/TCO2E                                                    5       $0.07
Electricity end-use       Residential air conditioning               2.6                    3.7 (benefit)                                               0
efficiency                Residential lighting                       5.7                   22.6 (benefit)                                               5                    $2.34 (benefit)
                          Residential refrigeration                  3.3                    6.7 (benefit)                                             10
                          Non-residential lighting                   4.7                   19.8 (benefit)
                                                                                                                                                       15
                          Non-residential air conditioning           1.7                    9.6 (benefit)
                                                                                                                                                      20
                          Street lighting                            0.9                   24.2 (benefit)                                                                                      $18.9 (benefit)
                          Industrial motors                          6.0                   19.5 (benefit)
Cogeneration              Cogeneration in industry                   6.5                    15.0 (benefit)
                          Bagasse cogeneration                       6.0                     4.9 (cost)
Renewable heat supply     Solar water heating                       18.9                    13.8 (benefit)
                          Improved cookstoves                       19.4                     2.3 (benefit)

8 | Low-Carbon Growth Country Studies Program                                                                                                                                                            Mitigating Climate Change in Mexico   |   9
LOW-CARBON DEVELOPMENT FOR MEXICO - LOW CARBON GROWTH COUNTRY STUDIES PROGRAM MITIGATING CLIMATE CHANGE THROUGH DEVELOPMENT
Figure 5: Low Carbon Emissions Scenario for Transport
                                         400

                                         350

                                         300
                            - 2e/year)

                                                                         nario
                                                                     sce
                                                               eline
                                         250             bas
             Emissions (Mt CO

                                                                                               Fuel Consumption
                                         200                                                   per Vehicle
                                                                                               Freight Transportation
                                         150                                                   Urban Transportation
                                                                                               MEDEC Emissions
                                         100                  MEDEC emissions

                                         50

                                          0
                                           2008 2010   2015         2020         2025   2030
                                                                   Year

                 Given historical and future urbanization patterns in Mexico, integrated urban transport
              and land-use planning will be critical factors in overall energy use and emissions (Figure 5).
              The most cost-effective ways to reduce emissions are through increased use of public trans-
              port and improvements in vehicle efficiency. Increasing the use of public transportation—
              including through private concessions—will require the development of mechanisms that
              integrate public transport and urban development efforts by both federal and municipal
              governments. The co-benefits would be less traffic congestion, time-savings, and public
              health improvements due to lower air pollution.

10 | Low-Carbon Growth Country Studies Program                                                                          Mitigating Climate Change in Mexico   |   11
LOW-CARBON DEVELOPMENT FOR MEXICO - LOW CARBON GROWTH COUNTRY STUDIES PROGRAM MITIGATING CLIMATE CHANGE THROUGH DEVELOPMENT
Figure 4: Territorial Distribution of Agriculture and Forestry Intervention*

                                                                                                                 *Sustainable forest management includes all interventions that involve a productive use of biomass
                                                                                                                   (biomass electricity, fuelwood co-firing, charcoal production, and forest management). The areas
             Agriculture and Forestry | Significant Potential with Large Co-Benefits                               suitable for reforestation and restoration or for zero tillage maize are not included in this map. The
                                                                                                                   area depicted here for afforestation assumes eucalyptus plantations. Jatropha biodiesel, an inter-
             Measures to reduce emissions from agriculture and forestry are among the largest GHG                  vention not included in the MEDEC scenario due to its high net cost of mitigation, is included here.
                                                                                                                   Authors: Ghilardi, A. & Guerrero G. (Red Mexicana de Bioenergía and Centro de Investigaciones
             mitigation options in Mexico. Eighty-five percent of this potential resides in forestry—refores-      en Ecosistemas; National University of Mexico). Based on: REMBIO 2008; INEGI 1995, 2000, 2002.
             tation, commercial plantations, and measures to reduce emissions from deforestation and               Created in ArcGIS 9.2 using ArcMap.
             forest degradation (REDD). The most beneficial interventions are those that achieve both
             (i) the substitution of fossil fuel use via the sustainable production of biomass energy and (ii)
             reduce deforestation and forest degradation. Many of these measures bring environmental             A LOW-CARBON SCENARIO FOR MEXICO
             co-benefits, such as soil conservation, water quality, and ecosystem preservation, as well as
             income generation and employment for rural communities. To successfully harness this                A key objective of Low-Carbon Development for Mexico is to build a low-carbon scenario
             potential, there must be institutional changes in forest management, improved public financ-        for Mexico to the year 2030. The above low-carbon interventions outline options to reduce
             ing mechanisms, and the development of a market for sustainable forest products.                    GHG emissions. The BAU scenario was generated with the Long-range Energy Alterna-
                 Opportunities for cost-effective mitigation in agriculture are more limited, partly due to      tives Planning (LEAP) model using macroeconomic assumptions for GDP, population
             a lack of research and development of low-carbon measures. Minimum tillage for maize                growth, and fuel prices in line with Mexican government estimates. In the BAU scenario,
             production appears to aid soil carbon sequestration and could be a promising technology             overall CO2e emissions are estimated to grow from 660 Mt in 2008 to 1,137 Mt in 2030.
             for Mexico due to lower energy requirements.                                                           Implementing 40 cross-sectoral interventions that meet the criteria explained in Box 2
                 The production of liquid biofuels is another possibility. Sugarcane ethanol has significant     would reduce emissions by around 477 million tons of CO2e in year 2030 (Figure 7).
             GHG reduction potential, although the productivity of sugarcane production in Mexico is             Mexico’s GHG emissions would be virtually the same in 2030 as they are today but with
             currently low and production costs are significantly above world market prices for sugar.           significant GDP and per capita income growth. Emission reductions (Mt CO2e) in 2030
             Other liquid biofuels interventions—ethanol from sorghum, and biodiesel from palm and               would come from agriculture and forestry (150 Mt), transport (131 Mt), power generation
             jatropha—have limited GHG emission reduction potential without impinging on land-use                (129 Mt), energy end-use (38 Mt), and oil and gas (30 Mt).
             for food crops, forests, or conservation lands. All liquid biofuel options have positive net           This low-carbon scenario is conservative in that only 40 interventions were considered
             economic costs when compared with the opportunity cost of selling the feedstocks for food           and the analysis did not assume any major changes in technology.
             or other non-fuel uses.

12 | Low-Carbon Growth Country Studies Program                                                                                                                                             Mitigating Climate Change in Mexico   |   13
LOW-CARBON DEVELOPMENT FOR MEXICO - LOW CARBON GROWTH COUNTRY STUDIES PROGRAM MITIGATING CLIMATE CHANGE THROUGH DEVELOPMENT
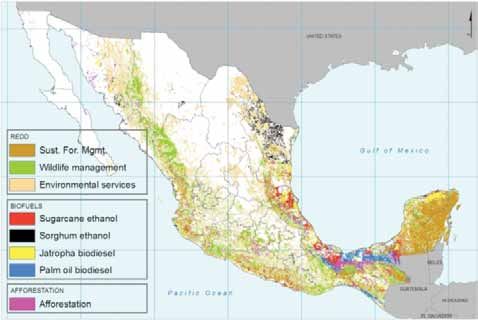
Figure 5. Low-Carbon Scenario                                                                         Figure 6. Marginal Abatement Cost Curve

                                       1200                                                                                                             100

                                                                                                                Net Mitigation Costs

                                                                                                                                                                                                                                                                                                                                                                                                                                                                                                                         environmental services
                                       1000

                                                                                                                                                                                                                                                                                                                                                                                                                                  reforestation & restoration

                                                                                                                                                                                                                                                                                                                                                                                                                                                                                                   wildlife management
                                                                        Agriculture and forestry

                                                                                                                                                                                                                                                                                                                                                                                                         fuelwood cfiring (20%)

                                                                                                                                                                                                                                                                                                                                                                                                                                                                             refinery efficiency
                                                                                                                                                                                                              border vehicle inspection
             Emissions [MtCO2e/year]

                                                                                                                                                                                                                                                                                                                        cogeneration in industry
                                                                                                                                                                  bus system optimization

                                                                                                                                                                                                                                                                                                                                                                                                       bagasse cogeneration

                                                                                                                                                                                                                                                                                                                                                                                                                                   sugarcane ethanol
                                                                                                                                                                                                                                                                                                                                                   fuel economy standards
                                                                                                                                                                                                                                          nonmotorized transport

                                                                                                                                                                                                                                                                                                                                                   residential refrigeration
                                                                                                                                                                                                                                                                    cogeneration in Pemex

                                                                                                                                                                                                                                                                                             nonresidential lighting

                                                                                                                                                                                                                                                                                                                                                   gas leakage reduction
                                        800

                                                                                                                                                                                                                                                                                                                                                                               improved cookstoves
                                                                        Oil and gas

                                                                                                                                                                                                                                                                                                                                                                                                        palm oil biodiesel
                                                                                                                                                                                                                                          road freight logistics

                                                                                                                                                                                                                                                                                             charcoal production

                                                                                                                                                                                                                                                                                                                                                                                                        sorghum ethanol
                                                                                                                                                                                                                                                                                                                       forest management
                                                                                                                                                                                                                                          urban densification

                                                                                                                                                                                                                                                                                                                       solar water heating
                                                                                                                                                        50

                                                                                                                                                                                                                                                                                                                                                   biomass electricity
                                                                                                                                                                                                                                                                                            residential lighting

                                                                                                                                                                                                                                                                                                                       zero-tillage maize

                                                                                                                                                                                                                                                                                                                                                   nonresidential AC

                                                                                                                                                                                                                                                                                                                                                                                                                                                                geothermal
                                                                                                                                                                                                                                                                                                                       industrial motors

                                                                                                                                                                                                                                                                                                                                                                                                          afforestation
                                                                                                                                                                                                                                          bus rapid transit

                                                                                                                                                                                                                                                                                                                                                                                                                                  small hydro
                                                                                                                                                                                                                                                                                                                       utility efficiency

                                                                                                                                                                                                                                                                                                                       I&M in 21 cities
                                                                        Stationary energy end-use

                                                                                                                                                                                            railway freight

                                                                                                                                                                                                                                                                                                                                                   residential AC
                                                                                                                                                                                                                                                                                            street lighting

                                                                                                                                                                                                                                                                                                                                                                                                      windpower
                                        600
                                                                        Transport

                                                                                                                                                                                                                                                                                                                                                                                                     biogas
                                        400                             Electricity

                                                                                                                                           ($/t CO2e)
                                                                        MEDEC emissions                                                                  0
                                        200

                                                                                                               Net Mitigation Benefits 
                                          0
                                           2008                2030

                                                                                                                                                        50

               How Much Would Low Carbon Development Cost? How Do Costs
               Compare Across Sectors?
                                                                                                                                                        100
               The combined net marginal abatement cost curve (Figure 8) shows that nearly half of the
                                                                                                                                                              0                                                                              1,000                                                                 2,000                                    3,000                                                   4,000                                                    5,000
               total potential for emissions reduction—26 interventions—have positive net benefits (or
               “negative costs,” meaning that their overall cost is less than their respective high-carbon                                                                                                                                                         Cumulative Mitigation 2009–30 (Mt CO 2e)
               alternative). Those with both high potential and low cost are public transport and vehicle
               efficiency, the majority of energy efficiency measures (including electricity supply improve-
               ments, lighting, refrigeration, air conditioning, and improved cookstoves), and a number
               of low-cost electricity supply options (including industrial and PEMEX cogeneration, and
                                                                                                                                             efficiency, for example as offset by fuel savings or savings in new generating capacity.
               solar water heating).
                                                                                                                                             But even if the discounted life-cycle costs are lower, higher upfront investment costs
                   If the value of one ton of carbon avoided is set at US$10/t CO2e, then more interven-
                                                                                                                                             generally inhibit investment. The overall new investment required to achieve the low
               tions yield positive benefits, including reforestation and restoration, and afforestation.
                                                                                                                                             carbon scenario is around US$64 billion between 2009-30, or around US$3 billion per
               Fully 80 percent of the GHG reduction potential in this low-carbon scenario lies below the
                                                                                                                                             year, equivalent to about 0.4 percent of Mexico’s GDP in 2008 (Tables 4, 5).
               US$10/t CO2e threshold. Raising the cost threshold to US$25/t CO2e allows over 5 billion
               tons of CO2e to be avoided in the period to 2030.                                                     (2) Policies and programs to overcome barriers. There is considerable room to involve the
                                                                                                                         private sector in financing investments in energy efficiency, renewable energy, and
                                                                                                                         sustainable transport. Since the mid-1990s, the number of independent power producers
               Implementing a Low-Carbon Program in Mexico
                                                                                                                         for natural gas power plants has risen dramatically, which could be improved and
                                                                                                                         extended to promote investment in energy efficiency, cogeneration, and renewable
               High-priority interventions with low or negative net costs exist in the transport, electric
                                                                                                                         energy generation. Recent oil and gas industry reforms support greater efficiency
               power, energy efficiency, and forestry sectors but barriers to implementation prevent many
                                                                                                                         and private sector investment.
               from occurring rapidly or on a large scale.
                                                                                                                        Examples of important policies for low carbon development include, but are not
               Policies and Investments Required for Low-Carbon Development                                          limited to:
               Regulatory, institutional, and market development barriers inhibit low-carbon interven-
                                                                                                                     • Electric Power­—reforming energy prices, specifically residential electricity tariffs,
               tions from being undertaken on a larger scale today. Two of the biggest challenges facing
                                                                                                                       and increasing the price of petroleum products (gasoline, diesel, LPG, fuel oil) and
               Mexico in moving to a low-carbon economy are:
                                                                                                                       natural gas
               (1) Financing the generally higher upfront costs of low-carbon investments. Many projects
                                                                                                                     • Oil and Gas—changing the rules that limit PEMEX from tapping its cogeneration
                   identified require higher upfront investment in plants and equipment despite positive
                                                                                                                       potential and providing substantial electricity production to the grid
                   net present values. Renewable energy investments generally have higher first costs,
                   which are often compensated by lower operating costs. Initial investments in energy

14 | Low-Carbon Growth Country Studies Program                                                                                                                                                                                                                                                                                                                                                         Mitigating Climate Change in Mexico                                                                                                        |   15
LOW-CARBON DEVELOPMENT FOR MEXICO - LOW CARBON GROWTH COUNTRY STUDIES PROGRAM MITIGATING CLIMATE CHANGE THROUGH DEVELOPMENT
• Energy End-Use—changing public procurement rules to facilitate energy efficiency
                                                   investments in schools, hospitals, government buildings, and municipal services
                                                 • Transport—increasing energy efficiency standards for both new and used vehicles;
                                                   improving coordination between federal, state, and municipal governments, and
                                                   between sector agencies at all levels of government for urban land-use planning and
                                                   public transport; improving fuel quality and enforcing air quality standards
                                                 • Agriculture and Forestry—expanding forest management programs

                                                    Almost all of the MEDEC low-carbon interventions have been implemented in Mexico
                                                 as commercial-scale investments projects or as pilot programs, thus, demonstrating their
                                                 near-term feasibility. For many interventions, new policies, incremental investment
                                                 financing, and other institutional and behavioral changes are needed to support the scale-up
                                                 from an individual project to a wider program. Carbon market mechanisms could support
                                                 some low-carbon interventions, however, most interventions would require new rules—
                                                 a reformed Clean Development Mechanism or new mechanisms—to qualify for support.

                                                 Near-Term Actions
                                                 As the government of Mexico moves forward with its climate change mitigation program,
                                                 it is important to prioritize near-term interventions. This study recommends that priority
                                                 be given to interventions with the following characteristics:
                                                 • Significant emissions reduction potential
                                                 • Positive economic rates of return, including large co-benefits
                                                 • Successful demonstration at commercial scale in Mexico or internationally
                                                 • Low investment costs and the ability to obtain financing

                                                 Table 4: MEDEC Investment Requirements to 2030 (in US$ millions)
                                                   SECTOR                             NEW INVESTMENT               FOREGONE INVESTMENT                   NET INVESTMENT
                                                  Electric Power                                21,406                       10,933                            10,473
                                                  Oil and Gas                                   4,637                            1,482                           3,155
                                                  Energy End-use                                15,771                           9,898                          5,873
                                                  Transport                                     1 1,729                      36,249                           –24,520*
                                                  Agriculture and Forestry                      10,928                           3,699                          7,230
                                                  Total                                         64,471                       62,261                              2,210
                                                 *Negative net investment implies that new investments under the low carbon scenario are less than the avoided invest-
                                                  ment under the baseline.

                                                 Table 5: Sources of Financing for Low-Carbon Interventions
                                                   PRIVATE SECTOR                           HOUSEHOLDS                                   PUBLIC SECTOR*
                                                  • Commercial energy efficiency            •    Residential energy efficiency           •   Street lighting
                                                  • Industrial energy efficiency            •    Solar water heating                     •   Public services efficiency
                                                  • Industrial cogeneration                 •    Zero tillage maize                      •   Reforestation and restoration
                                                  • IPPs for renewables (wind, biomass)     •    New vehicles                            •   Transport infrastructure
                                                  • Buses                                   •    Vehicle inspection and                  •   Geothermal power
                                                  • Sugarcane bagasse cogeneration               maintenance                             •   Oil and gas investments
                                                  • Liquid biofuels

                                                 *Worldwide, many public sector investments are financed through concession schemes with private contractors or operators,
                                                  including for power generation, oil and gas, public transportation, and other public utilities (water and sanitation).

16 | Low-Carbon Growth Country Studies Program                                                                              Mitigating Climate Change in Mexico              |   17
Based on these criteria, the high-priority actions with significant scale-up potential over
                    the next five years include:
                    • Electric Power—wind farm development in Oaxaca and elsewhere based on CFE’s pilots
                    • Oil and Gas—cogeneration in PEMEX facilities based on the project at Nuevo PEMEX
                    • Energy End-Use—an expansion of the efficient lighting and appliances programs
                      developed by FIDE and SENER
                    • Transport—bus rapid transit based on projects in Mexico and piloted in other parts of
                      Latin America
                    • Forestry—avoided deforestation based on the Los Tuxtlas project in Veracruz
                    In all cases Mexico will need to experiment and gain experience, especially with new
                    investment mechanisms and regulatory policies. In prioritizing actions, Mexico should
                    select measures that have positive economic rates of return, and social and environmental
                    benefits (Table 6).

Table 6: MEDEC Investment Requirements to 2030 (in US$ millions)
                                                       TOTAL     MAXIMum ANNUAL   MITIGATION
                                    TOTAL NEW        EMISSIONS     EMISSIONS       COST OR
                                   INVESTMENT        REDUCTION     REDUCTION        BENEFIT
  INTERVENTION                   (IN US$ MILLIONS)   (MT CO2E)      (MT CO2E)     (US$/T CO2E)   IMPLEMENTATION

 Border vehicle inspection              0               166            11         69 (benefit)        ST
 Bus rapid transit                     2333             47             4          51 (benefit)        ST
 Residential lighting                  237              100            6          23 (benefit)        ST
 Nonresidential lighting               420              47             5          20 (benefit)        ST
 Utility efficiency                    286              103            6          19 (benefit)        ST
 I&M in 21 cities                       0               109            11         14 (benefit)        ST
 Forest management                     148              92             8          13 (benefit)        ST
 Improved cookstoves                   434              222            19         2 (benefit)         ST
 Bus system optimization                0              360             32         97 (benefit)       ST/MT
 Nonmotorized transport                2252             51             6          50 (benefit)       ST/MT
 Road freight logistics                 0               157            14         46 (benefit)       ST/MT
 Cogeneration in PEMEX                3068              387            27         29 (benefit)       ST/MT
 Fuel economy standards                7145             195            20         12 (benefit)       ST/MT
 Wind power                           5549             240             23           3 (cost)         ST/MT
 Afforestation                         1084             153            14           8 (cost)         ST/MT
 Reforestation & restoration           2229             169            22           9 (cost)         ST/MT
 Solar water heating                  4464              169            19         14 (benefit)       ST/MT
 TOTAL                                29,648           2,767          247

18 | Low-Carbon Growth Country Studies Program                                                                    Mitigating Climate Change in Mexico   |   19
ACRONYMS AND ABBREVIATIONS

             AC           Air conditioner
             BAU          Business-as-usual
             CFE          Federal Electricity Commission (Comisión Federal de Electricidad)
             CFL          Compact fluorescent lamp
             CO           Carbon monoxide
             CO2e         Carbon dioxide equivalent
             ESMAP        Energy Sector Management Assistance Program
             FIDE         Fund for Electricity Savings (Fideicomiso para el Ahorro de Energía Eléctrica)
             GDP          Gross domestic product
             GHG          Greenhouse gas
             I&M          Inspection and maintenance
             IPP          Independent power producer
             LEAP         Long-range Energy Alternative Planning model
             LPG          Liquefied petroleum gas
             LULUCF       Land-use, land-use change, and forestry
             MEDEC        México: Estudio sobre la Disminución de Emisiones de Carbono
             Mt           million tons
             MT           Medium-term
             PEMEX        Mexican National Oil Company (Petróleos Mexicanos)
             PM2.5        Particulate matter < 2.5 microns
             REDD         Reducing emissions from deforestation and forest degradation
             SENER        Ministry of Energy (Secretaría de Energía)
             ST           Short-term
             t            ton                                                                              Photo Credits
             TWh          terawatt-hour                                                                    Cover: Andres Balcazar, © istockphoto.com/abalcazar
                                                                                                           Page 5: stock.xchng
             US$          United States dollar
                                                                                                           Page 7: stock.xchng
                                                                                                           Page 9: stock.xchng
                                                                                                           Page 10: stock.xchng
                                                                                                           Page 11: stock.xchng
                                                                                                           Page 12: stock.xchng
                                                                                                           Page 16: stock.xchng
                                                                                                           Page 19: stock.xchng

                                                                                                           Production Credits
                                                                                                           Design: Naylor Design, Inc.
                                                                                                           Production: Automated Graphic Systems, Inc.

                                                                                                           Copyright © May 2010
                                                                                                           The International Bank for Reconstruction
                                                                                                           and Development/THE WORLD BANK GROUP
                                                                                                           1818 H Street, NW, Washington, D.C. 20433, USA

                                                                                                           The text of this publication may be reproduced in whole or in part and in any
                                                                                                           form for educational or nonprofit uses, without special permission provided
                                                                                                           acknowledgement of the source is made. Requests for permission to repro-
                                                                                                           duce portions for resale or commercial purposes should be sent to the ESMAP
                                                                                                           Manager at the address above. ESMAP encourages dissemination of its work
                                                                                                           and normally gives permission promptly. The ESMAP Manager would appreciate
                                                                                                           receiving a copy of the publication that uses this publication for its source
                                                                                                           sent in care of the address above.

                                                                                                           All images remain the sole property of their source and may not be used for
                                                                                                           any purpose without written permission from the source.

20 | Low-Carbon Growth Country Studies Program                                                                                                                            Mitigating Climate Change in Mexico   |   21
The Energy Sector Management Assistance Pro-       The primary developmental objective of Car-
gram (ESMAP) is a global knowledge and tech-       bon Finance-Assist (CF-Assist) is to ensure that
nical assistance program administered by the       developing countries and economies in transi-
World Bank that assists low- and middle-income     tion are able to fully participate in the flexible
countries to increase know how and institutional   mechanisms defined under the Kyoto Protocol,
capacity to achieve environmentally sustainable    and benefit from the sustainable development
energy solutions for poverty reduction and eco-    gains associated with such projects.
nomic growth.
                                                   CF-Assist is a cosponsor of the Low Carbon
For more information on the Low Carbon             Growth Country Studies knowledge program.
Growth Country Studies Program or about ES-
MAP’s climate change work, please visit us at
www.esmap.org or write to us at:

Energy Sector Management Assistance Program        Carbon Finance-Assist Program
The World Bank                                     World Bank Institute
                                                   1818 H Street, NW
1818 H Street, NW
                                                   Washington, DC 20433 USA
Washington, DC 20433 USA                           email: cfassist@worldbank.org
email: esmap@worldbank.org                         web: www.cfassist.org
web: www.esmap.org
You can also read