THE ECONOMIC OUTLOOK FOR WASHTENAW COUNTY IN 2021-2023
←
→
Page content transcription
If your browser does not render page correctly, please read the page content below
THE ECONOMIC OUTLOOK FOR
               WASHTENAW COUNTY IN 2021–2023
                                                                           Prepared by
                                                                       Jacob T. Burton
                                                                        Tina Dhariwal
                                                                   Gabriel M. Ehrlich
                                                                    Donald R. Grimes
                                                                             Owen Kay
                                                             Michael R. McWilliams

                                    Prepared for

                                  March 25, 2021

This report was prepared in connection with a presentation to the Washtenaw Economic
Club. The report is available online at https://lsa.umich.edu/econ/rsqe.html.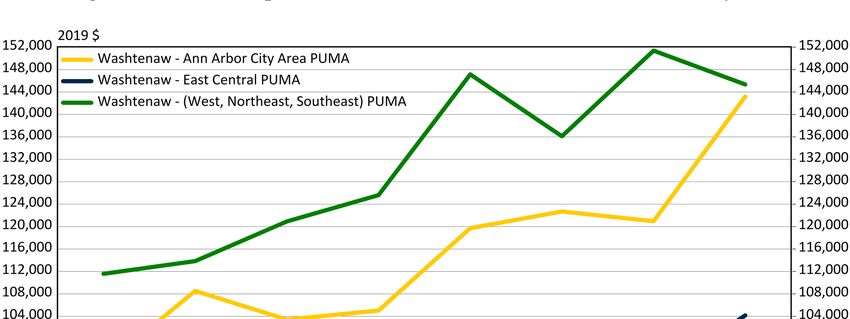
1

Introduction: the Current State of Washtenaw County’s Economy

         Washtenaw County’s economy has recovered substantial ground from the losses it suffered

at the beginning of the COVID-19 recession, but there is more work to be done. The county’s

economy held up better than the state of Michigan’s at the start of the recession: the number of

jobs in Washtenaw County declined by 16 percent from February to April 2020, whereas the

number of jobs in Michigan fell 23 percent in that time.1 The state, however, rebounded more

quickly than Washtenaw in the early stages of the recovery. By the fourth quarter of 2020 the

decline in jobs in the state from the first quarter was only slightly worse than in Washtenaw (9.8

percent compared to 8.3 percent).2 The dominant role that higher education plays in Washtenaw’s

economy tempered the impact of the recession on the way down, but the pandemic’s disruptions

to in-person education have slowed the county’s rebound on the way back up. Looking forward

our forecast attempts to answer two questions: First, how long will it take for Washtenaw County’s

economy to recover from the COVID-19 recession? Second, what will Washtenaw’s economy

look like in the post-COVID era?

         The future path of the pandemic will play the most important role in determining how

quickly the economy recovers. Figure 1 shows that the seven-day moving average of new

confirmed cases of COVID-19 in Washtenaw has plummeted from 165 new cases on November

23rd to 18 new cases as of March 6th. Although the pandemic’s second local wave started to recede

before vaccinations began to be administered, we believe that vaccinations will reinforce and

expedite the decline in new cases and prevent future waves. Unfortunately, the county’s pace of

1
  Unless otherwise noted, all monthly and quarterly data in this report is reported on a seasonally adjusted basis. When
the data is not published in a seasonally adjusted format, we have seasonally adjusted it ourselves to facilitate
comparisons over time and across series.
2
  The December 2020 household employment count in Washtenaw County remained 7.4 percent below its February
level, relative to a gap of 6.8 percent for the state overall.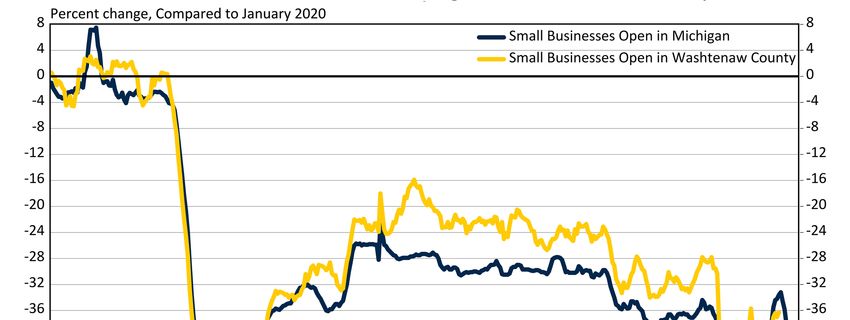
2

vaccinations decelerated throughout February, with only 11,868 doses administered in the final

week of February after 15,752 doses were administered in the last full week of January. We believe

this slowdown is only temporary, and that the pace of vaccinations will increase in the near future

with the authorization of Johnson & Johnson’s single-shot vaccine. The new vaccine should help

alleviate some of the supply constraints that the state of Michigan and Washtenaw County have

been facing.

                                        Figure 1
                       New Cases of COVID-19 in Washtenaw County

       Figure 2 shows the seasonally adjusted monthly unemployment rates in Michigan and

Washtenaw County. The unemployment rate in the county peaked at 14.7 percent in April 2020 as

private precautions and statewide restrictions forced the economy into a deep recession amid the

first wave of COVID-19. As the first wave began to recede and the public health situation

improved, employment among Washtenaw residents recovered briskly in the late spring and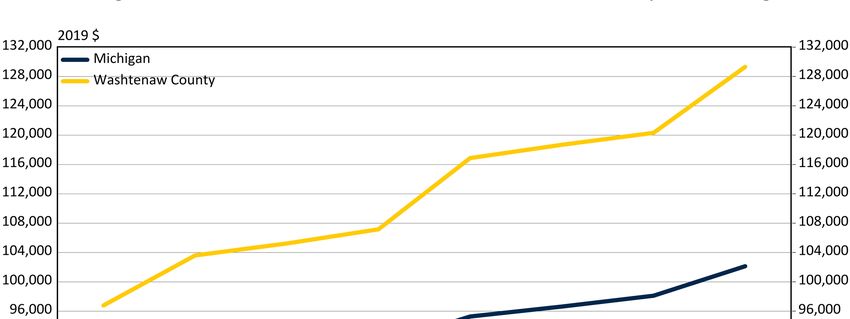
3

summer. Although the recovery slowed down last fall, by December 2020 the county’s

unemployment rate had fallen to 5 percent.

                                     Figure 2
            Monthly Unemployment Rates in Michigan and Washtenaw County

       Figure 3 compares the proportion of small business locations in Michigan and Washtenaw

County that were closed on any given day, relative to the January 2020 average. The small business

closure rate in the county stabilized around 24 percent in September and October 2020, but as the

severity of the second wave increased in November, the small business closure rate rose by 6

percentage points. It is important to note that the closure rate began to rise prior to the Pause to

Save Lives that took effect November 18th. As of early February, Washtenaw’s small business

closure rate was in the 36–37 percent range. However, we anticipate the strong economic recovery

from last summer to resume this spring as the public health situation continues to improve,

vaccinations accelerate, and the warmer weather lures people outdoors.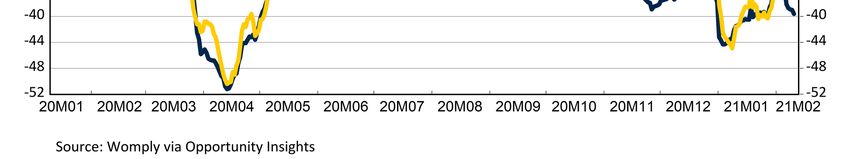
4

                                          Figure 3
                Small Business Closures in Michigan and Washtenaw County

       We expect progress against the COVID-19 pandemic to allow economic activity to return

largely to normal by this summer and fall, leading to a vigorous economic recovery. We forecast

that Washtenaw County’s unemployment rate will decline to an average of 2.7 percent in 2023,

which would be 0.2 percentage points lower than its level in 2019. There are several reasons for

our relatively optimistic forecast. Our first, and most important, reason is the rapid improvement

in the public health situation. Our second reason is the aggressive economic policy response to the

recession. The $900 billion fiscal relief package that Congress passed in December 2020, together

with the $1.9 trillion American Rescue Plan passed this month should also jumpstart the recovery.

We suspect many people will be surprised by the strength of the economic recovery after the

COVID-19 pandemic subsides.
5

         Before examining our forecast for Washtenaw County’s economy over the next three years,

we first turn our focus to how Washtenaw County’s pre-COVID-19 prosperity was distributed

geographically and demographically throughout the county.3

Shared Prosperity in Washtenaw County

         Figure 4 shows average household income for residents of Washtenaw County compared

to residents in Michigan for the years 2012 to 2019. The average income measure shown is

adjusted for household size and differences in cost of living in different parts of the state as

described in our report for the Southeast Michigan Council of Governments, Evaluating Shared

Prosperity in Southeast Michigan, 2012–2018.4 All income figures have also been adjusted to be

expressed in 2019 inflation-adjusted dollars.

         Washtenaw County’s affluence relative to Michigan overall is readily apparent. Despite

Washtenaw’s high cost of living, the average adjusted income in Washtenaw County is

significantly higher than in the rest of the state. Furthermore, between 2012 and 2019, the real

income of Washtenaw County residents grew at a faster rate than the real income of Michigan

residents overall. Between 2012 and 2019, the average annual, inflation adjusted, three-person

equivalent household income grew from $97,000 to $129,000, an increase of one-third. Over the

same time, the average annual, inflation adjusted, three-person equivalent household income of

Michigan residents increased by nearly one-quarter, from $83,000 to $102,000.

3
  We have included our longstanding review of how our forecast from last year fared as Appendix A to this report.
4
  We made two modifications to our methodology from the methodology used in the Evaluating Shared Prosperity
report. First, to adjust for cost of living, we use the BEA’s Regional Price Parity index but do not adjust for differences
in PUMA-level housing costs within the same Metropolitan Statistical Area (MSA). Second, we classify lower-,
middle-, and upper- income households based on the national median cost-of-living and household-size adjusted
income rather than the national median income of three person households.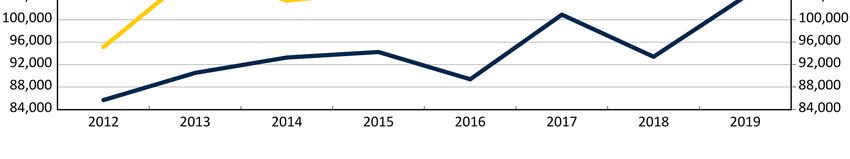
6
Figure 4
Average Three-Person Household Income in Washtenaw County and Michigan
Despite the relative prosperity of Washtenaw County, large disparities exist across the
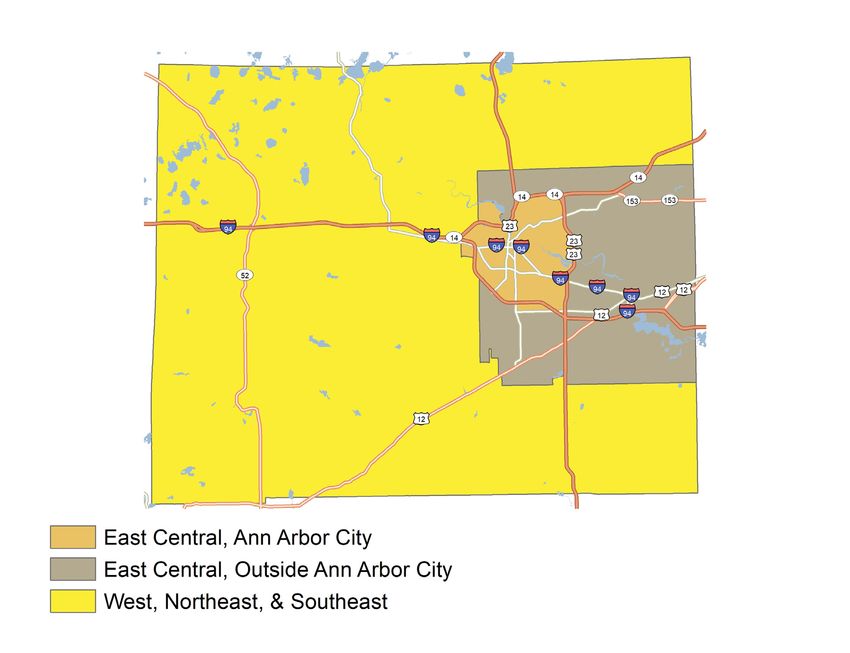
county’s geographical regions. Figure 5 shows household income for residents of the three
geographic regions of Washtenaw County designated by the Census Bureau (Public Use Microdata
Areas, or PUMAs).5 Those areas are the East Central (Ann Arbor City Area) PUMA, which we
will call the Ann Arbor PUMA; the West, Northeast, and Southeast PUMA, which we will call the
Western PUMA; and the East Central (Outside Ann Arbor City) PUMA, which we will call the
East Central PUMA. Three-person household incomes are much higher in the Ann Arbor PUMA
and the Western PUMA as compared to the East Central PUMA. In addition, Figure 5 shows that
the disparities in incomes between the different parts of the county have been increasing since
2012. While real incomes in the relatively more affluent parts of the county have been growing
rapidly, 50 percent in Ann Arbor City Area and 30 percent in the Western PUMA, real three-
5
Appendix B displays a map of these three PUMA areas within the county.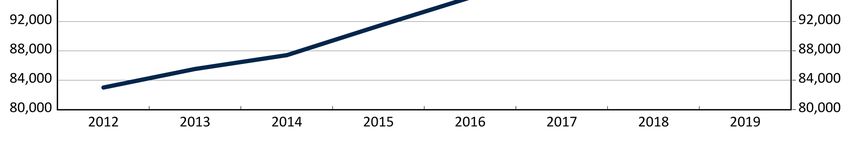
7

person equivalent household income in the eastern part of the county outside of Ann Arbor have

grown only 22 percent over this time period.

                                      Figure 5
    Average Three-Person Equivalent Household Income in Washtenaw County PUMAs

        The economic disparities in Washtenaw County are also visible across demographic

groups. Table 1 shows the proportions of Washtenaw County residents living in lower-, middle-,

and upper-income households broken down by race and ethnicity.6 Although only 20 percent of

non-Hispanic White and 25 percent of non-Hispanic Asian county residents live in lower-income

households, that proportion was 35 percent for non-Hispanic Black and Hispanic residents. By

comparison, 39 percent of non-Hispanic Asian and 35 percent non-Hispanic White residents live

in higher-income households, versus 18 percent of non-Hispanic Black and 21 percent of Hispanic

residents. Although the disparity in the income distribution between White and Asian households

6
  We define the threshold between lower- and middle- income households to be two-thirds the median three-person
equivalent household income in the United States, adjusted for local cost of living and household-size. We define the
threshold between middle- and upper- income households to be twice the adjusted national median income. Those
thresholds were $51,000 and $153,000 for a three-person household in 2019. The thresholds were $41,600 and
$124,900 for a two-person household and $29,400 and $88,300 for a single-person household.
8
and Black and Hispanic households is wide in Washtenaw County, the gap is much wider in the
state and nation overall. For instance, in 2019, 23.1 percent of non-Hispanic White residents of
Michigan lived in lower-income households and 20.4 percent lived in higher-income households;
those proportions were 47.2 percent and 10.6 percent, respectively, for non-Hispanic Black
residents.
Thus, although real household income grew rapidly in Washtenaw County in the years
prior to the pandemic and was high relative to Michigan overall, there were large economic
disparities within the county, along both geographic as well as racial and ethnic lines even prior to
COVID-19.
Table 1
Population in Lower-, Middle-, and Upper- Income Households by Race and Ethnicity,
Washtenaw County, 2019
Lower Income Population Middle Income Population Upper Income Population
All Race/Ethnicity 24% 45% 32%
Hispanic 35% 44% 21%
Non-Hispanic Asian 25% 37% 39%
Non-Hispanic Black 35% 47% 18%
Non-Hispanic White 20% 46% 35%
National Outlook 2021–2023
Figure 6 displays our baseline forecast for the level of U.S. real GDP through 2023.7
Perhaps surprisingly, the pandemic-related turmoil led to an annual real GDP decline of only 3.5
percent in 2020, as unprecedented federal fiscal support insulated the economy from a more severe
contraction. We expect real GDP to return to its pre-pandemic level by mid-2021 as the pandemic
continues to subside and the $1.9 trillion spending package in the recently passed American Rescue
7
Gross Domestic Product (GDP) comprises all of the goods, services, and structures produced in the economy. Real
GDP is adjusted for price inflation to be expressed in chained 2012 dollars.9
Plan helps to support the economy. Our forecast translates to annual real GDP growth of 4.8
percent in 2021. Real GDP growth moderates to 3.9 percent in 2022 and 2.6 percent in 2023 as the
effects of the federal spending and stimulus wear off.
Figure 6
Real Gross Domestic Product
Figure 7 shows our forecast for national and Detroit Three light vehicle annual sales. Total
vehicle sales fell from 17 million in 2019 to 14.4 million in 2020, with the bulk of that loss
occurring in the second quarter of last year. We are forecasting light vehicle sales to rebound to
16.5 million units this year, 16.8 million units in 2022, and 17.2 million units in 2023. Although
our projected sales pace for 2021 remains 2.5 percent below pre-pandemic levels, we consider our
forecast to lean a bit toward the optimistic side in light of the many uncertainties surrounding the
automotive industry such as the ongoing semiconductor shortage.
Our baseline forecast assumes that the shortage of semiconductors will have a limited effect
on Michigan’s recovery, but the shortage does pose a serious downside risk to the state’s auto10
industry. The shortage has already caused slowdowns at the Detroit Three automakers, but we
expect production in Michigan to be less affected than elsewhere. We believe the Detroit Three
automakers will prioritize truck and large SUV production at the expense of smaller vehicles, both
because the larger vehicles are more profitable and because it will be more difficult to make up
production for those models in the future. That logic should favor production in Michigan,
although if the shortages intensify, there is a risk that the state’s auto industry could suffer more
than we are forecasting.
Figure 7
Total U.S. vs. Detroit Three Light Vehicle Sales
Detroit Three sales fell from just under 7 million units in 2019 to 5.9 million units in 2020,
and we do not expect a full recovery during our forecast period. As the pandemic subsides and
consumers regain their confidence, we are predicting sales to nudge up to 6.6 million units this
year, to 6.7 million units in 2022, and to 6.8 million units in 2023. Despite those gains, we expect11
the Detroit Three’s share of total national sales to continue its downward trend from the past
decade, falling from 40.5 percent in 2020 to 39.4 percent by 2023.
Washtenaw County Outlook: 2021–2023
Our economic outlook for Washtenaw County through 2023 encompasses unemployment,
employment, inflation, and real wages. As described above, 2019 was, in aggregate, a great year
for household income in Washtenaw County and in the state of Michigan. It was also a great year
in the labor market. From the bottom of the Great Recession in the summer of 2009, Washtenaw
County had enjoyed over ten years of economic growth, cumulating to 37,300 job additions from
calendar year 2009 to 2019. The county’s employment growth rate of 1.9 percent per year
substantially exceeded the U.S. and Michigan average rates of 1.4 percent per year over the same
period.
Unemployment Rate
Perhaps the best way to visualize the benefits from Washtenaw’s pre-pandemic economic
expansion is to look at the unemployment rate in Washtenaw County and Michigan since 2001 as
shown in Figure 8. Michigan’s unemployment rate fell from 14.4 percent in the summer of 2009
to 3.9 percent in the fall of 2019, while the unemployment rate in Washtenaw County declined
from a peak of 9.2 percent in the fall of 2009 to a low of 2.4 percent in the first quarter of 2020.
Then came the COVID-19 recession, which caused an unprecedented jump in the
unemployment rate in the second quarter of 2020, to 20.0 percent statewide and 13.4 percent in
the county. The recovery from the recession started vigorously in the summer of 2020, before
retrenching in the fall in response to a resurgence of COVID-19 cases. By the fourth quarter of
2020, the unemployment rate had fallen to 4.8 percent in Washtenaw County and 8.2 percent12
statewide.8 We are forecasting that the unemployment rate in both the state and county will flatten
out in the first quarter of 2021.
Figure 8
Seasonally Adjusted Unemployment Rate in Michigan and Washtenaw County
The economic recovery is forecast to resume in the second quarter of 2021, driving the
unemployment rate down to 4.1 percent in Washtenaw County and 6.2 percent in Michigan by the
end of 2021. By the end of our forecast, in the fourth quarter of 2023, the unemployment rate in
the state of Michigan is forecast to be 3.9 percent, exactly equal to the rate in the fourth quarter of
2019. We are forecasting that Washtenaw County’s unemployment rate in the fourth quarter of
2023 will be 2.5 percent, 0.1 percentage points below the level reached in the fourth quarter of
2019. Thus, measured by the unemployment rate, both Washtenaw County and the state of
Michigan are expected to recover to their pre-pandemic levels by the end of 2023.
8
This report was prepared prior to the March 2021 benchmark revisions to the state and county unemployment data.
Figure 8 presents the historical data as it informed our forecast.13
Employment in Washtenaw compared to Michigan
Figure 9 shows the impact of the COVID-19 recession and subsequent recovery on
employment in the county and state. In this figure, seasonally adjusted total wage and salary
employment in both Washtenaw County and the state of Michigan are indexed to be equal to 100
in the first quarter of 2020. This technique allows us to compare the movements of employment
over time between two geographic areas of vastly different scale.
Figure 9
Seasonally Adjusted Employment in Michigan and Washtenaw County
Payroll employment declined by 19 percent in Michigan and 15 percent in Washtenaw
County in the second quarter of 2020 amid the first wave of the COVID-19 pandemic. The county
recovered 41 percent of its job losses in the third quarter of 2020 and the state recovered 45 percent
of the losses, but the jobs recovery largely stalled in the fourth quarter amid the pandemic’s second
wave.14
We expect the jobs recovery to resume vigorously in the spring of 2021. By the second
quarter of 2023, Washtenaw County will have recovered all the jobs lost during the recession and
then some. Employment in the county ends our forecast period at a record high level, 1.7 percent
higher than in the first quarter of 2020. The jobs recovery in the state overall lags slightly behind
Washtenaw County; by the end of 2023 we expect that total employment in the state will remain
about 0.3 percent below the first quarter of 2020 level.
Employment by Industry
Table 2 divides the total job movements we project over our forecast period among twenty-
four major industries.9 The table includes, for each industry, our preliminary estimates of the level
of employment in 2020; the estimated change from 2019 to 2020; the forecast change for each of
2021, 2022, and 2023; and the cumulative change over the three-year period 2020–23. The table
also includes the average annual wage for each industry category in 2019.10 Total employment is
forecast to grow by 4,270 jobs, or 2.1 percent, in 2021. Job growth will then accelerate to 4.8
percent in 2022 (9,880 jobs) and 2.3 percent in 2023 (4,910). Cumulative job growth over the next
three years is almost 3,000 jobs greater than the number of jobs the county lost in 2020.
The government sector is expected to lose 170 jobs this year; it is the only major industry
that we expect to see a job decline this year. Government then rebounds strongly, surpassing its
2019 employment level in 2022. Government adds an additional 1,560 jobs in 2023, so that
government employment is 1,690 jobs higher in 2023 than it was in 2019. Almost all of those job
gains are in state government, reflecting the resilience of the University of Michigan and Michigan
Medicine.
9
The appendix divides the job movements into 111 industries including 82 detailed industries.
10
The historical employment data are from the Bureau of Labor Statistics Quarterly Census of Employment and Wages.
The average annual wage includes both full- and part-time workers, weighted equally. Consequently, the average
wages for industries that employ a disproportionately large number of part-time workers, such as retail trade and
leisure and hospitality, are much lower than they would be if the wages were calculated only for full-time workers.15
The private sector industries shown in Table 2 have been organized into two categories: 12
“full-recovery industries” in which employment in 2023 exceeds employment in 2019 and 7
“incomplete-recovery industries”, in which 2023 employment continues to run behind 2019 levels.
Four of the full-recovery industries (information, corporate headquarters, transportation
and warehousing, and utilities) actually gained jobs in 2020. Three of these industries paid the
highest average wages in the county in 2019, and the other (transportation and warehousing) paid
an average wage that was 10 percent above the county average. Transportation and warehousing
is expected to see the fourth-fastest job growth of all major industries between 2020 and 2023 (710
jobs or 19.2 percent), with most of these job gains occurring in warehousing. Employment at
corporate headquarters is forecast to grow by 169 jobs or 12.1 percent over the forecast period.
Job gains in the relatively small utility industry are minor, while gains in information are also
modest because continued job losses at newspapers and telecommunications offset gains in
software publishing, data processing, and internet-based companies.
Of the eight full-recovery industries that lost jobs in 2020, six had relatively small
employment losses in 2020, and two suffered job losses that exceeded the county’s average
proportional loss in 2020. Four of these eight industries paid wages that exceeded the countywide
average while four paid relatively low wages.
Professional and technical services is the industry that is probably most closely identified
with the knowledge economy, and it is the fourth-highest paying major industry in the county. The
industry lost relatively few jobs in 2020 (-410), and we expect it to enjoy some of the largest job
gains between 2020 and 2023 (1,800 or 10.4 percent). Within this aggregate industry, the largest
job gains between 2020 and 2023 are in computer systems design (750 or 23.1 percent) and16
engineering and architectural services (350 or 7.4 percent). Accounting services are forecast to
lose 4 jobs while legal services are forecast to gain a relatively modest 58 jobs over this period.
The finance and insurance industry is forecast to see relatively small job gains between
2020 and 2023 (79), following relatively small job losses in 2020 (-62). Wholesale trade is forecast
to grow by 499 jobs over the next three years.
In contrast to its behavior during prior recessions, the construction industry lost 290 jobs
in 2020, or 6.7 percent. We expect construction to add 340 jobs in 2021 and maintain roughly that
pace over the following two years. In fact, over the three-year period 2020 to 2023, the construction
industry is forecast to grow by 1,030 jobs or 23.4 percent. This would be the fastest growth seen
by any major industry in the county. The need for additional trained skilled trade workers will be
acute over the next three years.
Employment in private health and social services is forecast to grow by 2,250 jobs, or 9.5
percent, between 2020 and 2023. Most of the job gains will be in physician’s offices (740), private
hospitals and some other small health care industries (350), and individual and family social
services (320). Home health care services is forecast to lose 25 jobs over the next three years.
Employment in real estate and rental services is forecast to grow by 270 jobs, or 11.7
percent, over the next three years, following the loss of 185 jobs in 2020.11 Natural resources and
mining, a very small industry locally, is forecast to gain 32 jobs over the next three years, following
the loss of 29 jobs in 2020.
11
Note that these job gains do not show all of the improvement in the local residential real estate industry, because
real estate agents are predominantly self-employed, and thus are not counted in the data on establishment employment
shown here.17
Table 2
Forecast of Employment in Washtenaw County by Major Industry Division
Employment Change
Forecast
Average
Estimate Annual
2020 19–'20 20–'21 21–'22 22–'23 20–'23 Wage 2019
Total Jobs (Number of jobs) 202,269 -16,207 4,266 9,882 4,907 19,056 $61,276
(Annual percent change) (-7.4%) (2.1%) (4.8%) (2.3%)
Private Sector 122,409 -13,694 4,434 7,100 3,320 14,853 $58,795
Total Government 79,861 -2,512 -168 2,783 1,588 4,203 $65,375
State Government 64,574 -1,960 -10 2,279 1,362 3,631 $66,408
Full-Recovery Industries
Management of Companies and Enterprises 1,397 67 22 101 46 169 $166,914
Utilities 428 5 5 3 2 9 $155,132
Information 5,033 247 35 77 49 162 $105,829
Transportation & Warehousing 3,683 159 297 211 200 709 $67,704
Professional & Technical services 17,226 -415 595 694 510 1,799 $99,532
Finance & Insurance 3,632 -62 24 31 24 79 $92,911
Wholesale Trade 5,685 -191 220 158 121 499 $79,257
Construction 4,382 -294 345 491 191 1,026 $65,965
Private Health & Social services 23,593 -1,251 664 1,118 467 2,248 $56,997
Real Estate & Rental 2,327 -185 65 133 75 272 $52,246
Natural Resources & Mining 255 -29 12 14 6 32 $32,078
Arts & Recreation 1,682 -833 312 595 296 1,203 $23,021
Incomplete-Recovery Industries
Accomodation & Food Services 11,124 -4,461 476 2,099 735 3,309 $21,008
Retail Trade 14,129 -1,657 335 225 80 639 $32,476
Other Services 4,346 -783 242 156 69 467 $33,846
Private Education 2,808 -458 148 223 48 419 $36,761
Administrative Support & Waste Management 8,327 -946 245 347 112 703 $38,039
Transportation Equipment Manufacturing 3,604 -1,080 193 206 142 541 $66,126
Other Manufacturing 8,395 -1,530 201 219 148 568 $67,216
Unallocated 355 3 0 0 0 0 $53,27918
Employment in arts and recreation fell by 33.1 percent in 2020 (-830 jobs), one of the
largest percentage declines in all industries in the county. Employment in this relatively low-wage
industry is expected to rebound sharply over the next three years (1,200 jobs), so that employment
in 2023 is comfortably above 2019 levels.
We will now turn to the incomplete-recovery industries. The first five industries listed in
this group near the bottom of Table 2 all pay relatively low wages. The lowest-paying major
industry group is accommodations and food services. The average pay in this industry, which
includes a high-proportion of part-time workers, was only $21,000 in 2019. Employment in
accommodations and food services fell by 4,460 or 28.6 percent, in 2020. The greatest percentage
of job losses were in accommodations (39.3 percent or 520 jobs), and full-service restaurants (37.5
percent or 2,340 jobs). Limited-service (more commonly known as fast food) restaurants fared
better, with a decline of 830 jobs, or 15.7 percent. All of these industries are expected to see
relatively large employment gains over the next three years, but none of them will return to 2019
levels.
Retail trade lost 1,660 jobs in 2020, and we are forecasting that this sector will recover
only 38.6 percent of these jobs (640) over the next three years. There is a wide variance in
performance among individual retail trade industries. Electronic and appliance stores, clothing
stores, sporting goods and book stores, and department stores are all forecast to continue to lose
jobs over the next three years, following large job losses in 2020. On the other hand, food stores,
pharmacies and personal care stores, non-store retailers, and miscellaneous retail stores are all
expected to enjoy employment gains sufficient to send employment in 2023 above 2019 levels.
The miscellaneous other services sector includes a grab bag of individual industries such
as repair services, including motor vehicle repair shops; personal services, such as hair salons and19
dry cleaners; membership organizations; and private household services. Collectively, these
industries lost 780 jobs in 2020 and regain 470 jobs over the next three years. Private education,
which includes private colleges as well as private K-12 education, lost 460 jobs in 2020. This
industry is forecast to regain almost all of those job losses by 2023.
The manufacturing sector lost 2,610 jobs in 2020, or a decline of 17.9 percent. That was a
much bigger fall than in Michigan overall, where the decline was 10.7 percent. The decline in local
motor vehicle and parts manufacturing was especially acute in Washtenaw County, with a loss of
1,080 jobs (-23.1 percent). Over the next three years, we expect the local motor vehicle
manufacturing industry to recover about one-half of those job losses (541). While last year’s
employment decline in the other local manufacturing industries was less severe (-15.4 percent),
the recovery over the next three years will also be weaker, coming to only one out of every three
jobs lost in 2020 (570 out of 1,530). Machinery manufacturing and computer and electronic parts
manufacturing add more jobs between 2020 and 2023 then they lost in 2020, while printing is
forecast to lose 14 jobs from 2020 to 2023 in addition to its loss of 240 jobs in 2020.
Detailed industries with the largest employment gains
In this section, we briefly discuss our forecast for 75 unique private sector industries. The
15 detailed private sector industries with the greatest job gains between 2015 and 2019 or between
2020 and 2023 are shown in Table 3. The table shows the change in jobs between 2015 and 2019
and our expected gain between 2020 and 2023, as well as the average annual pay in the industry
in 2019. We also rank these 75 industries in terms of their job gains in these two periods. Of the
15 private sector industries with the greatest job gains between 2015 and 2019, 11 also rank in the
top 15 industries in employment growth between 2020 and 2023. Of the four industries that rank
in the top 15 between 2020 and 2023, but are not in the top 15 between 2015 and 2019 (shown at
the bottom of the table), three are still among the top half of all industries in terms of job gains.20
The exception is employment services, which predominately consists of the temporary help
industry. This industry lost 630 jobs between 2015 and 2019, ranking 74th out of 75 industries. We
expect it will add 395 jobs between 2020 and 2023, which will rank it 12th among detailed
industries.
The most striking pattern in Table 3 is that the industries that gained the most jobs between
2015 and 2019 are also expected to be among the largest job gaining industries during our forecast
period. We expect Washtenaw County’s pattern of job creation over the next three years to look a
lot like it did in the pre-pandemic recent past.21
Table 3
Detailed Private-Sector Industries with the Greatest Job Gains in Washtenaw County
Historical Job Projected Job
Growth from Growth from Historical Projected Average Annual
2015–2019 2020–2023 Rank Rank Wage 2019
Total Payroll Jobs 16,028 19,056 $61,276
Government 7,247 4,203 $65,375
Private Sector 8,781 14,853 $58,795
Detailed Private Sector Industries*
Wholesale Trade Durable Goods 997 362 1 13 $84,645
Architectural & Engineering Services 850 354 2 14 $122,105
Offices of Physicians 829 745 3 5 $108,529
Air, Ground passenger, Support for Transportation Services, & Warehousing 711 550 4 7 $75,073
Limited-Service Restaurants 651 810 5 3 $17,243
Outpatient Care Clinics, Medical Laboratories, Offices except Physicans &
607 308 6 17 $55,408
Dentists
Computer Systems Design & Related Services 590 750 7 4 $101,382
Private Hospitals, Emergency & Vocational Rehabilitation Social Assistance 581 348 8 15 $52,777
Transportation Equipment Manufacturing 522 541 9 8 $66,126
Residenital & Nonresidential Building Construction 514 406 10 10 $58,866
Management & Technical Consulting Services 489 215 11 21 $103,805
Specialty Trade Contractors 407 606 12 6 $66,519
Individual & Family Social Assistance 365 165 13 30 $25,251
Arts, Entertainment & Recreation Services 302 1,203 14 2 $23,021
Specialized Design, Advertising, and Other Professional & Technical
297 209 15 22 $54,484
Services
Full-Service Restaurants 255 1,567 20 1 $22,831
Private Education Services 144 419 28 9 $36,761
Accomodations 248 399 21 11 $27,182
Employment Services (626) 395 74 12 $26,044
*A ranking of 1 is the highest job growth observed in a given period, while a ranking of 75 is the lowest job growth observed over that period. The
historical rank is based on job gains from 2015–2019, while the projected rank is based on our forecast of job growth from 2020–2023.22
Inflation
Figure 10 shows that we expect price inflation to rebound in 2021 to 2.3 percent in the U.S.
and 2.4 percent in the Detroit region following a period of very low inflation in 2020 (1.3 percent
in the U.S. and 1.0 percent locally).12 We think inflation will fall back to about 2.0 percent in 2022
before returning to a rate just north of 2.0 percent in 2023. Our forecast translates into the highest
three-year rate of local price inflation since the 2010 to 2013 period, but despite some supply chain
bottlenecks and a historical fiscal stimulus, we do not expect high inflation to be a major problem
over the next three years, although one of risk to our forecast is that inflation could turn out higher
than we are forecasting.
Figure 10
Inflation Rate, National and Detroit CPI
12
We measure local price inflation using the Consumer Price Index for Detroit region because the Bureau of Labor
Statistics does not publish a local inflation measure for Washtenaw County.23
Real Wage
Figure 11 shows the average real wages for all workers in Washtenaw County and
Michigan from 2001 to 2023, expressed in 2019 dollars.13 The first thing to notice in this figure is
that the average wage is consistently about 10 percent higher in the county than in the state of
Michigan overall. Real wage growth for all workers in the county averaged 1.2 percent per year
between 2001 and 2007, with average real wages in the county reaching a peak of $59,400 in that
year. They then began to fall during and after the Great Recession, reaching a low of $55,700 in
2011 (a decline of 6.2 percent over that four-year period). The average real wage in Michigan
peaked in 2003, and then slowly declined to a low of $51,300 in 2009. The average real wage in
the state then remained fairly constant until 2013.
The average real wage started growing in Washtenaw County in 2012 and in the state of
Michigan in 2014. Between 2011 and 2019, the average real wage in Washtenaw County increased
by 1.2 percent per year, reaching a record high of $61,300. The average real wage in Michigan
increased by 1.3 percent per year between 2013 and 2019, also reaching a record high of $55,700.
Thus, the 2010s were a period of relatively rapid average real wage growth both in Washtenaw
County and in the state of Michigan.
13
The wage series are averages per worker. The nominal series is from the Bureau of Labor Statistics Quarterly Census
of Employment and Wages and does not include variations in hours worked, a measure that is not available to us in
the necessary detail. This consideration is likely less problematic over the longer term than at the business cycle
frequency. That said, these data include all payroll income, including profit sharing bonuses, overtime and holiday
pay, and other irregular income, which is not included in the more commonly cited Bureau of Labor Statistics Current
Employment Statistics hourly and weekly wage data. Wages are adjusted for inflation using the U.S. Personal
Consumption Expenditure Price Index.24
Figure 11
Average Real Wage for Michigan and Washtenaw
The COVID-19 recession generated what many people will see as a very surprising change
in the average wage between calendar years 2019 and 2020. The average real wage jumped by 6.1
percent in Washtenaw County and 4.9 percent in the state of Michigan. Part of that growth came
from the unexpected slowdown in inflation, but the biggest reason that real wages skyrocketed
during 2020 was the changing mix of employment. The country, state, and county all saw a
disproportionate loss of lower-paying jobs relative to higher-paying jobs. Indeed, as we discussed
above, some high-paying industries actually saw employment levels increase. This change in the
mix of jobs is one of the most unique characteristics of the COVID-19 recession from a
macroeconomic perspective.
Figure 12 shows the average real wage from 2001 to 2023 for three industry group
combinations. The first group comprises traditional blue-collar industries; the second is service-
providing industries that tend to employ highly-educated workers, which we call higher-education25
service industries; and the third are service-providing industries that tend to employ less well-
educated workers, which we call lower-education service industries.14
Figure 12
Average Real Wage for Washtenaw by Industry Groupings
Figure 12 shows several historical trends, which appear to have remained intact during and
following the COVID-19 recession. First, prior to the Great Recession and the turmoil it caused in
the motor vehicle manufacturing industry, average wages in the blue-collar industries substantially
exceeded average wages in the higher-education services industries. Since the Great Recession,
average wages in the blue-collar industries have fallen, while average wages in the higher-
education service industries have risen. By 2019, the average pay in the higher-education industries
14
Blue-collar industries include natural resources and mining, construction, manufacturing, and transportation
and warehousing. Higher-education service industries include government except for the post office, education,
ambulatory health care services except for home health care services, hospitals, professional services,
corporate headquarters, wholesale trade, utilities, finance and insurance, and information services except for
telecommunications. Lower-education service industries include retail trade, leisure and hospitality services,
real estate and rental services, business support services such as temporary help services, telecommunication services,
home health care services, residential care services, day care services, and the miscellaneous other services category,
which includes repair and personal services.26
was 10.5 percent above average pay in blue-collar industries. Second, both the blue-collar and
higher-education services industries pay at least twice as much as the lower-education services
industries, which we note again feature a higher proportion of part-time jobs than the other two
categories.
The 2020 recession caused a spike in average wages in all three industry groups: 4.9 percent
in blue-collar; 3.9 percent in higher-education services; and 6.6 percent in lower-education
services. The relatively big jump in lower-education services reflects the fact that even in this
generally lower paying industry group it was the lowest-paid industries (arts and recreation and
accommodations and food services) that lost the greatest share of jobs in 2020.
The real average wage in all three of these industry groups declines in 2021 and 2022 as
inflation picks up and lower-wage workers return to the job. By 2023, real wages are expected to
be 2.9 percent higher than their 2019 levels in blue-collar industries; 3.7 percent higher in higher-
education service industries; and 2.0 percent higher in lower-education service industries.
Employment by type of industry
Figure 13 shows how we expect employment in the above-mentioned three industry groups
to evolve between 2019 and 2023. Employment in higher-education services industries declined
by 3.3 percent in 2020, less than one-half the overall rate of job loss in the county. Employment in
blue-collar industries declined by 12 percent in 2020, with manufacturing accounting for almost
all of that loss. Finally, employment in lower-education services industries declined by 15.3
percent in 2020.
All three industry groups are expected to regain some of the lost jobs in 2021 but to remain
below their 2019 employment levels. The number of jobs in the higher-education attainment
services industries recovers to above 2019 levels in 2022, while employment in the other two
groups takes longer to recover. By 2023, the number of jobs in higher-education services industries27
is forecast to average 3.5 percent above its 2019 levels, while the number of jobs in the blue-collar
industries is expected to average 0.5 percent higher than its 2019 levels, driven by strong growth
in construction and transportation and warehousing. We expect that the number of jobs in lower-
educational attainment industries during 2023 will remain 3.4 percent lower than the 2019 level
owing to the large job losses these industries experienced during the pandemic.
Figure 13
Washtenaw County Employment by Industry Groupings
Conclusion
Our expectations for the Washtenaw economy rely on a national economic forecast that
delivers solid growth throughout 2023. While we do not expect a national or statewide shutdown
from another wave of COVID-19, the pandemic remains in the driver seat of Washtenaw’s
economic outlook, and it remains our largest risk. As the public health situation improves, we
expect another risk to the Washtenaw economy to emerge: labor shortages are bound to return as28
the labor market tightens. We believe labor shortages will turn into a growing problem as
Washtenaw County moves into the post-COVID era. As the populace ages, the county will need
to continue to draw workers in from elsewhere to maintain its historical growth pace. That being
said, we always like to emphasize that a labor shortage is a much better problem for a local
economy to face than a jobs shortage.
Our view continues to be that the economy of 2019 was fundamentally a healthy one, and
we expect those fundamentals to return once the pandemic subsides. Despite the downside risks,
our baseline forecast for Washtenaw County is that it will enjoy three years of economic growth
as it recovers from the pandemic. We forecast that the county will recover all the jobs it has lost
due to the COVID-19 recession, and that by 2023, the county’s payroll job count will stand 2,800
jobs higher than its 2019 level. While we expect average real wages to decline over the next two
years, we believe that they will decline for an encouraging good reason, the return of lower-paid
workers to the job.
Although we remain optimistic about Washtenaw’s future, the path moving forward will
not be an easy one. The COVID-19 pandemic has caused a sharp contraction in economic activity
throughout the nation, and Washtenaw County has not been exempt. The pandemic took an
especially heavy toll on job opportunities for less-educated workers. We predict that Washtenaw
County will restore many of those jobs in the recovery, but we anticipate a challenging few years
for those seeking lower-education service jobs.29
Appendix A: Review of the Forecast for 2020
Last May, we forecast that the COVID-19 pandemic would cause payroll employment in
Washtenaw County to decline by 14,300 payroll jobs in 2020, for a decline of 6.5 percent. The
preliminary data indicates that the county lost 16,200 jobs, for a decline of 7.4 percent. Our forecast
of job growth was therefore 0.9 percentage points too high, an underestimate of about 1,900 jobs
lost due to the pandemic. As shown in Table 4, that miss is about 0.2 percentage points larger than
our absolute forecast error over the past 33 years of 0.7 percentage points.
Last year, Washtenaw County’s job count contracted the most in a single year in recorded
history—an unfortunate distinction that also applied statewide. We are satisfied with last year’s
forecast error in light of the difficult forecasting environment caused by the pandemic.
The bottom of Table 4 shows the forecast and actual values for the unemployment rate and
the local consumer price inflation rate in 2020. We had forecast an average unemployment rate of
8.4 percent for the year, 1.9 percentage points higher than the actual rate of 6.5 percent. In our
forecast of the local consumer inflation rate for 2020, we estimated a rate of 0.5 percent for the
year, one-half of a percentage point lower than the realized rate of 1 percent.30
Table 4
Report Card: Track Record over the Years
Percentage Percentage
forecast error forecast error
Year of forecast for total jobs1 Year of forecast for total jobs1
1986 -1.4 2003 +1.0
1987 -0.8 2004 +0.2
1988 -1.2 2005 +0.42
1989 -0.6 2006 +0.7
1990 +0.8 2007 0
1991 +1.4 2008 +0.6
1992 +0.5 2009 +1.0
1993 +1.3 2010 -2.3
1994 n.a. 2011 -0.6
1995 +0.2 2012 -0.4
1996 +0.3 2013 0
1997 +0.4 2014 +1.1
1998 -0.5 2015 +0.2
1999 0 2016 -0.3
2000 0 2017 -0.3
2001 +0.3 2018 +0.4
2002 +0.3 2019 -1.8
2003 +1.0 2020 +0.9
2004 +0.2
1
Positive numbers indicate that the forecast was too high; negative, too low.
2
Estimate.
Average absolute forecast error 1986–2020: 0.7%
Forecast Actual
2020 2020
Unemployment rate 8.4% 6.5%
Consumer inflation rate 0.5% 1.0%31 Appendix B: Washtenaw County PUMA Regions
32

Appendix C: Forecast of Jobs in Washtenaw County by Detailed Industry
                                                               Estimated             Forecast              Average Wage
                                                                 2020           2021      2022      2023       2019
Total wage and salary employment                                   202,269   206,535 216,417     221,325      $61,276
Total government                                                    79,861    79,693    82,475    84,063        65,375
 Federal government                                                  4,028     4,015     4,040     4,055        87,367
   Post office                                                         521       502       489       472        61,119
   Hospital                                                          2,640     2,669     2,703     2,733        87,561
   Other federal government                                            868       844       848       850      103,671
 State government                                                   64,574    64,563    66,842    68,204        66,408
 Local government                                                   11,258    11,115    11,593    11,804        52,267
   Education and health services                                     7,087     6,993     7,328     7,498        50,544
   Public administration                                             3,459     3,410     3,524     3,551        55,845
   Other local government                                              712       711       741       754        51,194
Total private                                                      122,409   126,842 133,942     137,262        58,795
 Goods-producing                                                    16,636    17,386    18,315    18,802        66,146
   Farming, forestry, fishing and mining                               255       267       281       287        32,078
   Construction                                                      4,382     4,727     5,218     5,408        65,965
      Buildings                                                      1,348     1,471     1,669     1,754        58,866
      Heavy and civil engineering construction                         454       470       481       467        86,201
      Specialty trade contractors                                    2,580     2,786     3,068     3,186        66,519
   Manufacturing                                                    11,998    12,392    12,816    13,107        66,867
      Food                                                             830       843       859       872        49,178
      Printing and related support activities                        1,063     1,033     1,053     1,049        44,841
      Chemicals                                                        604       617       634       647        75,986
      Plastics and rubber products                                     662       695       720       739        76,800
      Fabricated metal products                                      1,049     1,082     1,106     1,118        59,812
      Machinery                                                        919       965     1,007     1,041        71,443
      Computer and electronic products                               1,193     1,243     1,277     1,305        80,851
      Transportation equipment                                       3,604     3,796     4,002     4,144        66,126
      Miscellaneous manufacturing                                    1,246     1,255     1,268     1,276        81,402
      Other manufacturing                                              828       862       891       915        61,243
 Private service-providing                                         105,773   109,456 115,627     118,460        57,561
   Trade, transportation, and utilities                             23,925    24,782    25,379    25,781        50,083
      Wholesale trade                                                5,685     5,905     6,063     6,184        79,257
        Merchant wholesalers, durable goods                          3,395     3,552     3,667     3,757        84,645
        Merchant wholesalers, nondurable goods                       1,751     1,805     1,846     1,876        68,409
        Electronic markets and agents and brokers                      539       548       550       550        81,702
33
Appendix C (Continued): Forecast of Jobs in Washtenaw County by Detailed Industry
Estimated Forecast Average Wage
2020 2021 2022 2023 2019
Retail trade 14,129 14,464 14,689 14,769 32,476
Motor vehicles 1,497 1,537 1,579 1,586 60,005
Furniture and home furnishings 450 484 505 514 40,200
Electronics and appliances 699 689 689 682 46,621
Building materials and garden supplies 1,256 1,269 1,264 1,256 40,372
Food and beverages 3,121 3,213 3,259 3,300 25,292
Health and personal care stores 988 1,043 1,062 1,078 34,945
Gasoline stations 515 529 536 540 21,305
Clothing and accessories 704 651 685 686 20,088
Sporting goods, hobby, book, music stores 468 442 434 415 20,916
General merchandise 2,848 2,915 2,884 2,847 26,326
Miscellaneous store retailers 1,017 1,092 1,165 1,213 24,781
Nonstore retailers 568 601 625 650 40,177
Transportation and warehousing 3,683 3,980 4,191 4,392 67,704
Truck transportation 725 796 827 850 61,878
Couriers and messangers 561 575 585 594 44,048
Other transportation and warehousing 2,397 2,609 2,780 2,947 75,073
Utilities 428 433 436 437 155,132
Information 5,033 5,068 5,146 5,195 $105,829
Publishing industries, except Internet 1,735 1,735 1,740 1,738 94,710
Newspaper, book, and directory publishers 257 248 241 232 75,075
Software publishers 1,479 1,487 1,499 1,506 98,869
Telecommunications 549 500 462 425 74,500
Data processing, hosting, and related services 1,257 1,291 1,343 1,377 95,575
Other information 1,492 1,541 1,600 1,654 134,831
Financial activities 5,959 6,048 6,212 6,310 76,453
Finance and insurance 3,632 3,656 3,687 3,711 92,911
Credit intermediation and related activities 1,890 1,842 1,800 1,750 79,851
Insurance carriers and related activities 900 903 909 911 75,444
Other finance 842 911 977 1,051 137,548
Real estate and rental and leasing 2,327 2,392 2,525 2,599 52,24634
Appendix C (Continued): Forecast of Jobs in Washtenaw County by Detailed Industry
Estimated Forecast Average Wage
2020 2021 2022 2023 2019
Professional and business services 26,949 27,810 28,952 29,620 82,516
Professional and technical services 17,226 17,820 18,514 19,025 99,532
Legal services 966 983 1,011 1,024 87,782
Accounting and bookkeeping 554 554 552 550 68,240
Architectural and engineering 4,751 4,854 5,010 5,105 122,105
Computer systems design and related services 3,243 3,504 3,756 3,993 101,382
Management and technical consulting 2,532 2,605 2,689 2,748 103,805
Scientific research and development 3,272 3,359 3,432 3,489 99,660
Other professional and technical services 1,907 1,961 2,064 2,116 54,484
Management of companies and enterprises 1,397 1,418 1,519 1,565 166,914
Administrative and waste services 8,327 8,571 8,918 9,030 38,039
Administrative and support services 7,631 7,859 8,179 8,275 35,402
Employment services 4,016 4,144 4,348 4,411 26,044
Services to buildings and dwellings 1,980 2,050 2,126 2,149 33,349
Other administrative and support services 1,635 1,665 1,705 1,715 63,252
Waste management and remediation services 696 712 739 756 68,757
Private education and health services 26,401 27,212 28,553 29,068 54,646
Private educational services 2,808 2,955 3,178 3,226 36,761
Private health care and social assistance 23,593 24,257 25,375 25,842 56,997
Ambulatory health care services 10,061 10,426 11,020 11,272 77,663
Offices of physicians 4,996 5,232 5,555 5,740 108,529
Offices of dentists 906 943 1,068 1,090 55,625
Home health care services 1,673 1,668 1,673 1,648 43,137
Other ambulatory health care services 2,486 2,583 2,724 2,793 55,408
Nursing and residential care facilities 4,266 4,313 4,406 4,431 32,430
Individual and family services 1,397 1,485 1,627 1,718 25,251
Child day care services 1,029 1,071 1,192 1,230 22,443
Hospitals, emergency relief, and vocational rehabilitation 6,841 6,961 7,131 7,190 52,77735
Appendix C (Continued): Forecast of Jobs in Washtenaw County by Detailed Industry
Estimated Forecast Average Wage
2020 2021 2022 2023 2019
Leisure and hospitality 12,806 13,593 16,287 17,318 21,288
Arts, entertainment, and recreation 1,682 1,993 2,589 2,885 23,021
Accommodation and food services 11,124 11,600 13,699 14,433 21,008
Accommodation 810 865 1,114 1,209 27,182
Food services and drinking places 10,314 10,734 12,585 13,225 20,430
Special food services 787 836 976 1,017 24,632
Drinking places, alcoholic beverages 528 520 656 692 22,633
Restaurants and other eating places 8,999 9,378 10,953 11,516 19,894
Full-service restaurants 3,897 4,079 5,114 5,464 22,831
Limited-service restaurants 4,452 4,623 5,089 5,262 17,243
Cafeterias and nonalcoholic beverage bars 650 676 750 789 13,993
Other services 4,346 4,588 4,744 4,812 33,846
Repair and maintenance 816 851 873 877 43,364
Personal laundry services 1,022 1,117 1,152 1,155 27,677
Membership associations and organizations 1,888 1,962 1,993 2,010 40,880
Private households 620 658 726 770 18,357
Unallocated private services 355 355 355 355 53,279
Addendum
Unemployment rate 6.5 4.3 3.4 2.7You can also read