Structural Study on Fat Crystallization Process Heterogeneously Induced by Graphite Surfaces - MDPI
←
→
Page content transcription
If your browser does not render page correctly, please read the page content below
molecules
Article
Structural Study on Fat Crystallization Process
Heterogeneously Induced by Graphite Surfaces
Fumitoshi Kaneko 1, * , Yoshinori Yamamoto 1 and Shinichi Yoshikawa 2
 1   Graduate School of Science, Osaka University, Toyonaka 560-0044, Japan;
     yamamotoy16@chem.sci.osaka-u.ac.jp
 2   Research Institute for Creating the Future, Fuji Oil Holdings Inc., Izumisano 598-8540, Japan;
     yoshikawa.shinichi@so.fujioil.co.jp
 *   Correspondence: toshi@chem.sci.osaka-u.ac.jp; Tel.: +81-6-6850-5453

 Academic Editors: Sato Kiyotaka and Borislav Angelov

 Received: 22 September 2020; Accepted: 13 October 2020; Published: 19 October 2020

 Abstract: Some inorganic and organic crystals have been recently found to promote fat crystallization
 in thermodynamically stable polymorphs, though they lack long hydrocarbon chains. The novel
 promoters are talc, carbon nanotube, graphite, theobromine, ellagic acid dihydrate, and terephthalic
 acid, among which graphite surpasses the others in the promotion effect. To elucidate the mechanism,
 we investigated the influence of graphite surfaces on the crystallization manner of trilaurin in
 terms of crystal morphology, molecular orientation, and crystallographic features. Polarized optical
 microscopy, cryo-scanning electron microscopy, synchrotron X-ray diffractometry, and polarized
 Fourier-transform infrared spectroscopy combined with the attenuated total reflection sampling
 method were employed for the analyses. All the results suggested that the carbon hexagonal network
 plane of graphite surfaces have a high potential to facilitate the clustering of fat molecules against
 high thermal fluctuations in fat melt, the fat molecules form a layer structure parallel to the graphite
 surface, and the clusters tend to grow into thin plate crystals of the β phase at the temperatures
 corresponding to low supercooling. The β0 phase also has a larger chance to grow on the graphite
 surface as supercooling increases.

 Keywords: fat crystallization; heterogeneous nucleation; crystal polymorph; molecular orientation;
 trilaurin; graphite

1. Introduction
     Surfactants and materials having long hydrocarbon chains have been used as additives to promote
fat crystallization [1]. The alkyl chains of these compounds are considered to act as templates for
the heterogeneous nucleation by interacting with the hydrocarbon-chain moieties of fat molecules
and supporting their ordering processes [2,3]. In contrast, recent studies found that some inorganic
and organic crystals (i.e., talc, carbon nanotube, graphite, theobromine, ellagic acid dihydrate,
and terephthalic acid) promoted fat crystallization in thermodynamically stable polymorphs [4,5].
These additives are sparingly soluble in lipids and possess no long hydrocarbon chains in their chemical
structure, which implies that the additive surfaces attract fat molecules strongly and urge them to form
crystal nuclei.
     The novel promoters have a great potential to be applied to the production and separation
processes in the oleochemical industry. Information about the structural relationship between the
surface of the novel promoters and the heterogeneously nucleating fat crystals thereon, as well as
the resultant changes in the fat crystallization process, is crucial to understand the role of the novel
promoters and to develop more effective promoters.

Molecules 2020, 25, 4786; doi:10.3390/molecules25204786                          www.mdpi.com/journal/molecules
Molecules 2020, 25, 4786                                                                                                2 of 14

     Triacylglycerols (TAGs) are the main components of natural lipids, such as vegetable oil and
animal fats, and exhibit polymorphism of crystals [6,7]. Since TAGs are essential ingredients in a
wide variety of industrial products and their polymorphism and solid-state structures often exert a
significant influence on the quality and properties of the final products, we have been particularly
interested in how the novel promoters interact with TAG molecules, and how the crystallization
behavior of TAGs changes under their influence.
     In this study, we have investigated the influence of graphite surfaces on the crystallization
manner of trilaurin (LLL), since graphite powder promoted crystallization of LLL more effectively
than the other new promoters [4]. LLL is a saturated monoacid TAG having three dodecanoic acid
molecules ester-bonded to one glycerol. LLL shows three crystal polymorphs of the α, β0 and β phases,
differing in thermodynamic stability and crystal structure [8]. Melting points and structural features of
LLL polymorphs are summarized in Table 1.

                      Table 1. Melting points and structural features of trilaurin (LLL) crystals.

                                          Previous Study [8]                         Present Study 1
              Polymorphs              α           β0           β        β0 (0 ◦ C)      β (36 ◦ C)      β (50 ◦ C)
           Sub-cell Structure         H          O⊥           T//          O⊥               T//             T//
            Melting point/◦ C        15.0        35.0        46.5          —                —               —
           Long spacing/nm           3.5         3.2          3.1         3.25             3.15            3.13
           Short spacings/nm         0.42        0.42        0.46       0.421 (s)       0.536 (m)       0.538 (m)
                                                 0.38        0.39       0.384 (s)       0.522 (w)       0.525 (w)
                                                             0.38                       0.493 (w)       0.522 (w)
                                                                                        0.458 (s)       0.494 (w)
                                                                                        0.437 (w)       0.462 (s)
                                                                                        0.413 (w)       0.456 (s)
                                                                                        0.391 (s)       0.441 (m)
                                                                                        0.380 (s)       0.409 (w)
                                                                                        0.364 (w)       0.386 (s)
                                                                                                        0.376 (s)
                                                                                                        0.362 (w)
                                                                                                        0.359 (w)
      1 001 long spacing and characteristic short spacings are determined for LLL β0 and β crystals occurring at specific
      temperatures on heating after melt crystallization (Figure 2a). Roman letters following short-spacing values mean
      relative peak intensity: s, strong; m, middle; and w, weak.

     Graphite features a stacked structure of carbon hexagonal-network planes [9], and therefore,
the graphite surface with the network would play a crucial role in the promotion effects on fat
crystallization. To tackle this issue, we have conducted an elaborate examination on the crystallization
of LLL at surfaces of highly oriented pyrolytic graphite (HOPG). Furthermore, to approach this issue
from different points of view, we have employed the following methodologies: polarized optical
microscopy (POM), cryo-scanning electron microscopy (Cryo-SEM), synchrotron X-ray diffractometry
(SR-XRD), and polarized Fourier-transform infrared spectroscopy combined with the attenuated total
reflection sampling method (polarized FTIR ATR).
     Morphological observations using POM and Cryo-SEM provide information about how the
growth behavior of LLL crystals change with the crystallization conditions at the HOPG surfaces.
SR-XRD, which combines a highly bright X-ray source and high-sensitively detectors, allows us
to detect microstructural changes during the crystallization process of LLL [10–12]. Furthermore,
polarized FTIR ATR helps us to analyze the molecular-level structure and orientation of LLL crystals
grown on the HOPG surfaces.
     In this paper, we will describe the characteristics of fat crystallization induced by the HOPG
surfaces based on the experimental data acquired, and discuss how graphite effectively facilitates
the heterogeneous nucleation of fat crystals in the stable polymorphs at the surfaces with carbon
hexagonal networks.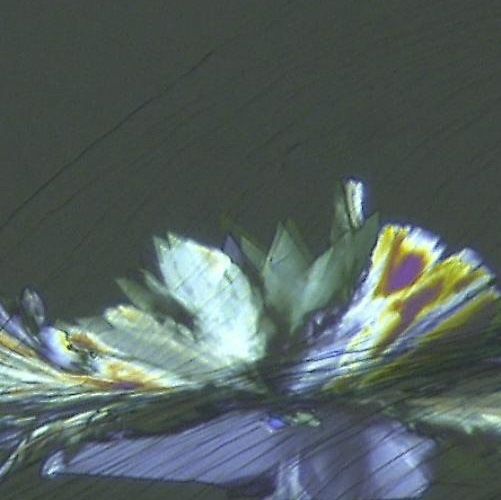
Molecules 2020, 25, 4786                                                                                                          3 of 14

2. Results and Discussion

2.1. Microscopic Observation of LLL Crystals on HOPG Sheets
     We haveMolecules
               followed      the
                      2020, 25,     morphological
                                x FOR PEER REVIEW       change of LLL crystals growing on the HOPG    surface using
                                                                                                3 of 14

POM. Two kinds of melt-crystallization procedures with constant-rate cooling or isothermal cooling
              2. Results and Discussion
were employed. The POM images acquired clearly displayed that the morphology of LLL crystals
significantly 2.1. Microscopic
              depends       onObservation    of LLL Crystalsconditions.
                                  the crystallization        on HOPG Sheets
                      We have followed the morphological change of LLL crystals growing on the HOPG surface
2.1.1. Melt-Crystallization withofConstant-Rate
             using POM. Two kinds                     Cooling
                                   melt-crystallization procedures with constant-rate cooling or isothermal
                 cooling were employed. The POM images acquired clearly displayed that the morphology of LLL
     Figure crystals
             1a shows         POMdepends
                      significantly    images on theof   LLL crystals
                                                      crystallization          developing on the HOPG sheet in the
                                                                      conditions.
melt-crystallization process with a constant cooling rate of 1 ◦ C/min. In this figure, dark lines
             2.1.1. Melt-Crystallization with Constant-Rate Cooling
running diagonally correspond to layered steps of the HOPG surface, which were made in preparing
                  Figure 1a shows POM images of LLL crystals developing               on the HOPG sheet in the melt-
the HOPG sheet      by cleavage before the observation. At 32 ◦ C, LLL crystals growing in a thin plate
             crystallization process with a constant cooling rate of 1 °C/min. In this figure, dark lines running
shape were observed        in the vicinity
             diagonally correspond    to layeredof     theofsteps.
                                                    steps    the HOPG  With     further
                                                                           surface, which cooling,
                                                                                           were made newly       occurring
                                                                                                        in preparing  the     crystals
grew radiallyHOPG
               fromsheet
                       theby   cleavage
                            edges    of before the observation. crystals
                                        the plate-shaped           At 32 °C, LLL
                                                                               to crystals growing in crystals
                                                                                   form globular       a thin plate(31 ◦ C and 30 ◦ C).
                                                                                                                    shape
             were observed in the vicinity of the steps. With further cooling, newly occurring crystals grew
The globularradially
               crystals
                      fromgrew      fast,
                            the edges      then
                                       of the      finally crystals
                                              plate-shaped    overwhelmed           the previously
                                                                       to form globular                   occurring
                                                                                         crystals (31 °C and            plate-shaped
                                                                                                              30 °C). The
crystals; meanwhile,     needle-shaped
             globular crystals  grew fast, thencrystals     protruded
                                                finally overwhelmed     the from    theoccurring
                                                                             previously  peripheries      of thecrystals;
                                                                                                   plate-shaped     globular crystals,
             meanwhile,
as indicated by  arrowsneedle-shaped
                            in Figure 1a.   crystals protruded from the peripheries of the globular crystals, as
                 indicated by arrows in Figure 1a.

                                                32ºC                      31ºC                      30ºC

                                                                                                 50 μm

                                                                   (a)

                 Molecules 2020, 25, x FOR PEER REVIEW                                                              4 of 14

                                                                   (b)

                                         36ºC 6 min               36ºC 7 min                  36ºC 8 min

                                 31.9
                                  ºC

                                                                                                50 μm

                                                                    (c)
                    Figure 1. Morphology of LLL crystals growing on highly oriented pyrolytic graphite (HOPG) sheets.
      Figure 1. Morphology       of LLL crystals growing on highly oriented pyrolytic graphite (HOPG) sheets.
                    (a) Polarized optical microscope (POM) images taken in the melt-crystallization process with a
      (a) Polarized optical
                    constant cooling rate of 1(POM)
                              microscope        °C/min, images    taken inelectron
                                                        (b) a cryo-scanning  the melt-crystallization
                                                                                    microscope (Cryo-SEM)   process  with a constant
                                                                                                             image taken
      cooling rate of
                    after ◦
                       1 theC/min,    (b) a process,
                              stabilization  cryo-scanning
                                                     and (c) POM electron   microscope
                                                                    images taken           (Cryo-SEM) process
                                                                                 in the melt-crystallization imagewith
                                                                                                                     taken after the
                    isothermal cooling
      stabilization process,    and (c)  at 36
                                            POM°C. images taken in the melt-crystallization process with isothermal

      cooling at 36 ◦The
                      C. same morphologies of LLL crystals were confirmed also by the Cryo-SEM observation.
                 Figure 1b shows a Cryo-SEM image of the grown LLL crystals on the HOPG surface, which was taken
                 after the cooling to 0 °C and the subsequent stabilization process with heating at 35 °C for 10 min
                 followed by cooling down to 20 °C. The globular crystals with a diameter of ~100 μm sat on the HOPG
                 surface. The needle-shaped crystals streaked along the HOPG surface and seemed to have radiated
                 out from the centers locating under the globular crystals. The plate-shaped crystals were not found,
                 probably because of being covered completely by the globular crystals.
Molecules 2020, 25, 4786                                                                            4 of 14

     The same morphologies of LLL crystals were confirmed also by the Cryo-SEM observation.
Figure 1b shows a Cryo-SEM image of the grown LLL crystals on the HOPG surface, which was taken
after the cooling to 0 ◦ C and the subsequent stabilization process with heating at 35 ◦ C for 10 min
followed by cooling down to 20 ◦ C. The globular crystals with a diameter of ~100 µm sat on the HOPG
surface. The needle-shaped crystals streaked along the HOPG surface and seemed to have radiated
out from the centers locating under the globular crystals. The plate-shaped crystals were not found,
probably because of being covered completely by the globular crystals.

2.1.2. Melt-Crystallization with Isothermal Cooling
     Figure 1c shows POM images of LLL crystals developing on the HOPG sheet in the
melt-crystallization process with isothermal cooling at 36 ◦ C. When the cooling time passed ~4 min,
flake-shaped crystals occurred first in the vicinity of layered steps of the HOPG surface. These crystals
grew away from the steps along the smooth surface of HOPG and, shortly afterward, dendritic crystals
grew from the peripheries to disturb the growth direction of the flake-shaped crystals. However,
no globular crystals were observed in this isothermal condition.

2.2. Structural Changes during Crystallization
     The above microscopic observation suggests that steps of the HOPG surface acted as the
heterogeneous nucleation sites for LLL crystals and that at least two kinds of crystal polymorphs were
involved in the crystallization of LLL on HOPG sheets. To study the polymorphic phase transition of
LLL crystals occurring in the different crystallization conditions, we conducted time-resolved SR-XRD
measurements using neat LLL and LLL in contact with a HOPG sheet (LLL/HOPG).

2.2.1. Crystallization of Neat LLL with Constant-Rate Cooling and Heating
       Figure 2a shows the SR-XRD profiles of neat LLL during crystallization with a constant cooling
rate of 1 ◦ C/min and the subsequent heating at a rate of 5 ◦ C/min. The crystallization started at about
23 ◦ C with the occurrence of the β0 phase, which is identified from a small-angle X-ray scattering
(SAXS) peak at a scattering vector |s| = 0.309 nm−1 (lattice spacing d = 3.24 nm) and wide-angle X-ray
scattering (WAXS) peaks at |s| = 2.37 and 2.58 nm−1 (d = 0.423 nm and 0.387 nm). No essential changes
took place during the further cooling. In the heating process, these β0 peaks disappeared at ~30 ◦ C
and the peaks of the β phase characterized by the following peaks appeared instead: a SAXS peak
at |s| = 0.318 nm−1 (d = 3.15 nm) and major WAXS peaks at |s| = 2.18, 2.56, and 2.63 nm−1 (d = 0.459,
0.390, and 0.380 nm). Based on the results of our previous study with DSC, POM, and XRD [4],
this phenomenon is attributed to the polymorphic phase transition from the meta-stable β0 phase
to the stable β phase. Further heating caused only minor changes in the SAXS and WAXS profiles:
the SAXS peak slightly shifted to the wider-angle direction at ~40 ◦ C, and the main WAXS peak at
|s| = 2.18 nm−1 (d = 4.59 nm) split into two peaks at |s| = 2.17 and 2.19 nm−1 (d = 4.61 and 4.57 nm) as
pointed out by the arrows in Figure 2a.
       To summarize, neat LLL melt crystallized in the β0 phase in the cooling at a constant rate, and the
β phase emerged only in the subsequent heating through the phase transition from the β0 phase.

2.2.2. Crystallization of LLL/HOPG with Cooling and Heating at Constant Rates
     Figure 2b shows the SR-XRD profiles of LLL/HOPG during crystallization with a constant cooling
rate of 1 ◦ C/min and the subsequent heating at a rate of 5 ◦ C/min. In the cooling process, a SAXS
peak at |s| = 0.319 nm−1 (d = 3.13 nm) appeared first at ~30 ◦ C and grew slowly during cooling from
30 to 20 ◦ C. Immediately after this, another SAXS peak at |s| = 0.309 nm−1 (d = 0.324 nm) appeared
at ~26 ◦ C, increased its intensity during cooling from 26 to 23 ◦ C, then attenuated to a certain level.
These changes in the SAXS profile indicate the sequential crystallization events of LLL/HOPG as
follows: crystallization in the stable β phase, crystallization in the metastable β0 , and partial phase
transition from β0 to β. With further cooling, the SAXS profile did not change any more. In the heating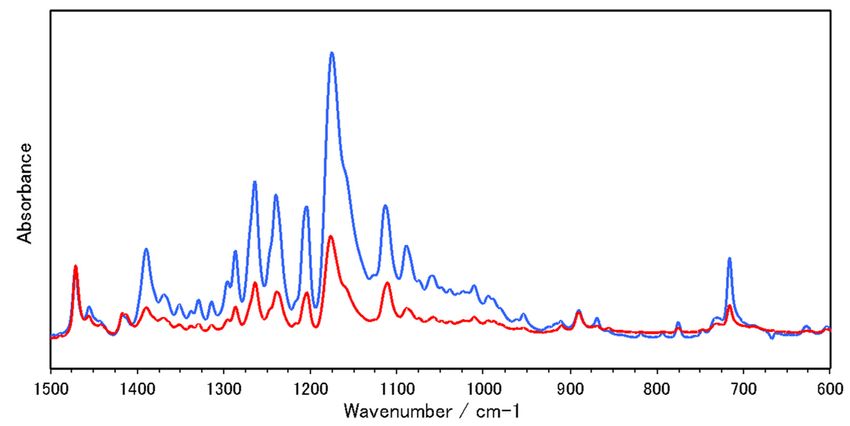
Molecules 2020, 25, x FOR PEER REVIEW                                                                           5 of 14

phenomenon is attributed to the polymorphic phase transition from the meta-stable β′ phase to the
stable β phase. Further heating caused only minor changes in the SAXS and WAXS profiles: the SAXS
peak slightly
Molecules 2020, 25,shifted
                    4786    to the wider-angle direction at ~40 °C, and the main WAXS peak at |s| =5 of           2.18
                                                                                                                    14
nm−1 (d = 4.59 nm) split into two peaks at |s| = 2.17 and 2.19 nm−1 (d = 4.61 and 4.57 nm) as pointed
out by the arrows in Figure 2a.
process,   the peak of the
     To summarize,        neatβ phase   increased
                                 LLL melt         its intensity
                                            crystallized  in theagain  at the
                                                                  β′ phase  inexpense   of the
                                                                               the cooling   at peak        β0 phase,
                                                                                                     of the rate,
                                                                                                a constant        and
which   started           ◦
                  at ~30 only
                            C. The                0                               ◦
the β phase     emerged           in peak of the β phase
                                     the subsequent         disappeared
                                                       heating            at ~33
                                                                through the   phase C,transition
                                                                                       and then that
                                                                                                  fromofthe
                                                                                                         theβ′βphase.
                                                                                                                phase
disappeared completely at ~50 ◦ C.

                                                         (a)

                                                         (b)

                                                         (c)

     Figure 2. Time-dependent changes of synchrotron X-ray diffraction (SR-XRD) profiles in small-angle
     X-ray scattering (SAXS) and wide-angle X-ray scattering (WAXS)(WAXS) regions.
                                                                             regions. (a) Crystallization
                                                                                          Crystallization of neat
                                             ◦
     LLL with a constant cooling rate of 1 °C/min,
                                               C/min, (b) crystallization of LLL/HOPG with the same cooling
                              crystallization at
     rate, and (c) isothermal crystallization     36 ◦°C
                                               at 36        LLL/HOPG.
                                                       C of LLL/HOPG.

     The WAXS profile showed corresponding changes, though the occurrence of the β phase in the
cooling was not detected because of its small intensity. In the cooling process, the peak at |s| = 2.58 nm−1
(d = 0.391 nm) for the β0 phase appeared at ~25 ◦ C, and the peaks at |s| = 2.19, 2.21, 2.61, and 2.69 nm−1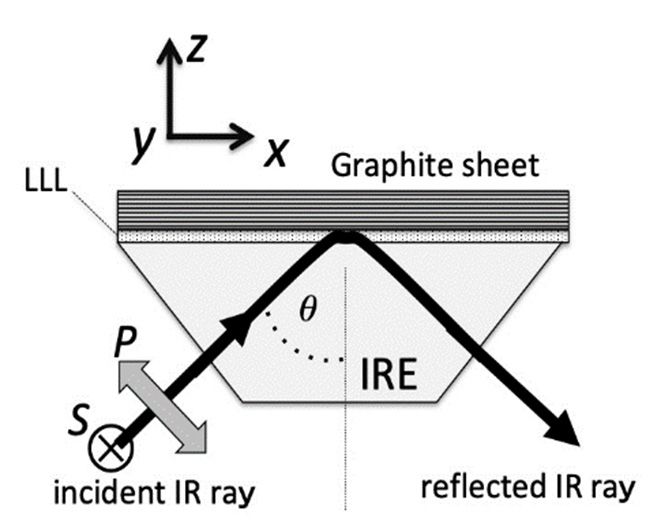
Molecules 2020, 25, 4786                                                                             6 of 14

(d = 0.457, 0.452, 0.383, and 0.372 nm) for the β phase appeared at ~23 ◦ C. In the subsequent heating
process, the peaks of the β phase disappeared at ~50 ◦ C after the peak of the β0 phase faded.
     A comparison of the SR-XRD profiles between neat LLL and LLL/HOPG shows that the HOPG
surface has the following influence on crystallization of LLL: (1) The HOPG surface preferentially
promoted crystallization of LLL in the β phase, so that the β phase appeared ahead of the β0 phase,
and (2) crystallization of LLL in the β0 phase was promoted to a small extent, indicating the direct or
indirect interactions with the HOPG surface.

2.2.3. Crystallization of LLL/HOPG with Isothermal Cooling
     Figure 2c shows the SR-XRD profiles of LLL/HOPG during crystallization with the isothermal
cooling at 36 ◦ C for 60 min. No peaks due to crystalline phases appeared for about half an hour, both in
the SAXS and WAXS regions. After ~35 min, the peaks due to the β phase appeared; specifically,
a SAXS peak at |s| = 0.315 nm−1 (d = 3.17 nm) and WAXS peaks at |s| = 2.17, 2.21, 2.55, and 2.57 nm−1
(d = 0.461, 0.452, 0.392, and 0.389 nm, respectively). These peaks gradually increased in intensity over
time. No peaks due to the β0 phase appeared at this temperature.

2.2.4. Structural Changes of LLL Crystals on a HOPG Sheet
     By combining the information obtained by the morphological observation and the SR-XRD
measurements, the following conclusions can be drawn about the crystallization process of LLL on a
HOPG sheet:
     1. A neat LLL melt tends to crystallize into the β0 phase in the constant-rate cooling. However,
the β phase appears on the hexagon network of graphite as thin plate crystals in the constant-rate
cooling. Since the growth rate of the β phase is low, the surrounding melt keeps its liquid state during
further cooling.
     2. When the supercooling of the remaining LLL melt reaches to a certain level, the β0 phase occurs
as globular crystals on the thin plate crystals of the β phase. The globular crystals grow faster than the
plate crystals of the β phase. The temperature for the β0 phase to appear is clearly higher than that in
the crystallization of neat LLL. The crystal face of β would support the nucleation of the β0 phase.
     3. The β phase is thermodynamically more stable than the β0 phase, and therefore, the β0 → β
solid-state phase transition takes place spontaneously when thermally activated, as can be seen in the
heating process of neat LLL.
     4. Within the globular crystals on the HOPG sheet, the β0 → β phase transition proceeds, since they
start to grow around 30 ◦ C. It is a striking contrast to the β0 phase generated in the neat LLL melt;
the β0 phase, which appears around 23 ◦ C, practically has no chance to start the solid-state transition.
     There are some differences in timing for structural changes between morphological observation
and XRD experiments. We will deal with this issue in a later section.

2.3. Polymorph and Orientation of LLL Crystal on a Graphite Sheet
      As described above, thin plate crystals of LLL in the β phase start to grow on the HOPG sheet.
Similarly, plate crystals of LLL in the β phase can be obtained also by solution crystallization. Since the
flat surface of the solution-grown crystal corresponds to the lamellar plane covered with methyl
groups, it can be inferred that the carbon hexagon network of graphite facilitates the formation of the
double-chain layer structure parallel to it.
      To confirm this expectation, we have studied the crystalline state of LLL generated on a graphite
sheet by polarized FTIR ATR method [13], which can probe organic layers on an opaque substrate
efficiently. Figure 3a shows the experimental conditions used and Figure 3b shows the spectra taken
for LLL crystal generated on a graphite sheet. The characteristics of polarized ATR spectroscopy are
summarized in Appendix A.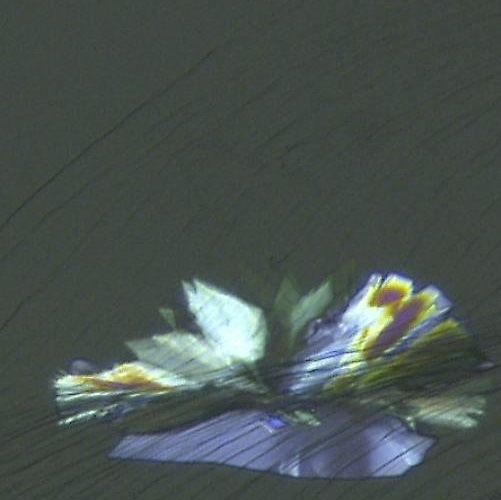
double-chain layer structure parallel to it.
      To confirm this expectation, we have studied the crystalline state of LLL generated on a graphite
sheet by polarized FTIR ATR method [13], which can probe organic layers on an opaque substrate
efficiently. Figure 3a shows the experimental conditions used and Figure 3b shows the spectra taken
for LLL crystal generated on a graphite sheet. The characteristics of polarized ATR spectroscopy are
Molecules 2020, 25, 4786                                                                          7 of 14
summarized in Appendix A.

                                                             (a)

                                      w(CH2)

                          δ(CH3)
               δ(CH2)                                                                               r(CH2)

Molecules 2020, 25, x FOR PEER REVIEW                                                                                    8 of 14

                                                             (b)

                                     w(CH2)

                                                                                                   r(CH2)
              δ(CH2)      δ(CH3)

                                                              (c)
      Figure 3.
     Figure    3. Polarized
                  Polarized attenuated
                             attenuated total
                                          total reflection
                                                 reflection Fourier-transform
                                                            Fourier-transform infrared
                                                                                 infrared (ATR-FTIR)
                                                                                            (ATR-FTIR) spectra
                                                                                                          spectra of
                                                                                                                   of LLL
                                                                                                                      LLL
      β-form crystals with
     β-form              with blue
                               blue and
                                      andred
                                           redlines
                                                linesfor
                                                       forppand
                                                             ands polarizations:
                                                                   s polarizations: (a)(a)
                                                                                        experimental
                                                                                           experimentalarrangement,
                                                                                                           arrangement,(b)
      spectra
     (b)        taken
          spectra      for LLL/graphite
                    taken  for LLL/graphitesheet,  and (c)
                                               sheet,   andspectra  takentaken
                                                             (c) spectra   for solution-grown     single single
                                                                                  for solution-grown     crystals, whose
                                                                                                                crystals,
      flat faces
     whose    flatare setare
                   faces  parallel to the internal
                             set parallel           reflection
                                          to the internal      element
                                                           reflection    (IRE) sampling
                                                                      element               face. face.
                                                                                (IRE) sampling

    The
     The LLL
          LLL layer
               layer generated
                     generated onon aa graphite
                                       graphite sheet
                                                 sheet shows
                                                        shows the
                                                                the characteristics
                                                                    characteristics of
                                                                                    of an
                                                                                        an ordered
                                                                                            ordered solid
                                                                                                    solid phase
                                                                                                           phase
of
of TAGs.  Thepronounced
   TAGs. The    pronouncedIR  IRbands
                                 bandscan canbebe assigned
                                                assigned  to to
                                                             thethe  vibrational
                                                                  vibrational    modes
                                                                              modes        of lauroyl
                                                                                       of lauroyl     chains
                                                                                                  chains      of
                                                                                                          of LLL
LLL [14–17]. A   band  at 717 cm −1 and a band at 1472     cm  −1 are due to CH rocking, r(CH ), and CH
[14–17]. A band at 717 cm and a band at 1472 cm are due to CH2 rocking,2 r(CH2), and CH22 scissoring,
                           −1                         −1                                                       2
δ(CH2), respectively. A series of bands in the 1350−1180 cm−1 region are attributed to the progression
bands of CH2 wagging, w(CH2), modes. The band at 1380 cm−1 is assigned to the methyl symmetric
deformation, δs(CH3). The r(CH2) and δ(CH2) bands are sensitive to the lateral packing of
hydrocarbon chains. Their frequencies and appearance as sharp singlets strongly suggest that the
acyl chains form the T// sub-cell structure, which is characteristic of the β phase. Furthermore, the
Molecules 2020, 25, 4786 8 of 14
scissoring, δ(CH2 ), respectively. A series of bands in the 1350−1180 cm−1 region are attributed to
the progression bands of CH2 wagging, w(CH2 ), modes. The band at 1380 cm−1 is assigned to the
methyl symmetric deformation, δs (CH3 ). The r(CH2 ) and δ(CH2 ) bands are sensitive to the lateral
packing of hydrocarbon chains. Their frequencies and appearance as sharp singlets strongly suggest
that the acyl chains form the T// sub-cell structure, which is characteristic of the β phase. Furthermore,
the appearance of the w(CH2 ) progression bands indicates the high conformational regularity of lauroyl
chains. Accordingly, the LLL crystal layer on the graphite sheet can be regarded as the stable solid
phase β.
The LLL crystal layer shows a clear polarization dependence. The most marked intensity
difference between p and s polarizations is seen in the w(CH2 ) progression bands, and the δ(CH3 )
band, whose transition moments are roughly parallel to the chain axis, appear significantly more
intense in p-polarization than in s-polarization for the two kinds of LLL samples. The r(CH2 ) band,
whose transition moment directs perpendicular to the skeletal plane, also appears more intense in
p-polarization. On the other hand, there is no clear difference in intensity between p- and s-polarization
for the δ(CH2 ) band, whose transition moment is in the skeletal plane and directs to the bisector of the
C-C-C angle.
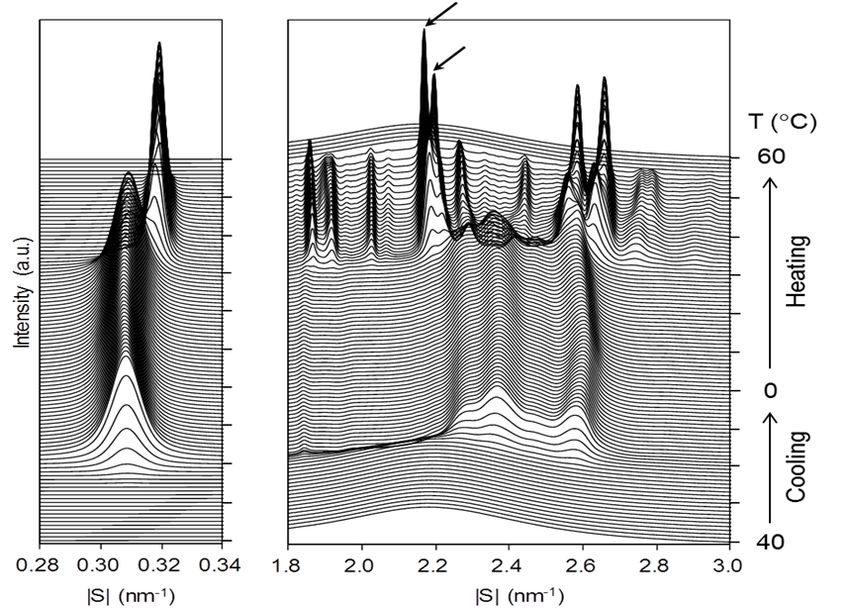
The polarization of these bands strongly suggests that the lamellae of the β phase are set parallel to
the surface of the graphite sheet. The β phase of monoacid TAGs forms a layer structure of double-chain
length, as depicted in Figure 4a [18–21]. The lamellar interface consists of the methyl terminals of acyl
chains that incline by about 30◦ from the normal of the interface, principally toward the as axis of
the T// sub-cell shown in Figure 4b. When the lamellar interface is set parallel to the IRE sampling
Molecules
face, the 2020, 25, x FOR
transition PEER REVIEW
moments of w(CH2 ), δ(CH3 ), and r(CH2 ) modes possess a considerable amount 9 ofof
14
z-component, leading to their more prominent absorption in p-polarization, as actually observed.
(a) (b)
Figure 4.
Figure 4. Schematic
Schematic representation
representationfor
forthe
the β
β phase of monoacid
monoacid triacyl
triacyl glycerols
glycerols (TAGs).
(TAGs). (a)
(a) Molecules
Molecules
formaa double-chain-layered
form double-chain-layeredstructure,
structure,whose
whoseinterface
interfaceisisparallel
paralleltotothe
theflat
flatsurface
surfaceof
ofthin
thin plate
plate single
single
crystals. (b)
crystals. (b) Acyl
Acyl chains
chains in
in the
the β
β phase form
form the
the T//
T// sub-cell
sub-cell structure.
structure.
Polarized FTIR ATR measurements on solution-grown plate crystals of the β phase obviously
3. Discussion
support the above results. The polarized spectra exhibit the same characteristics both in frequencies
3.1. Roles
and of Graphite
polarization, Surfacesin Figure 3c. These observations clearly suggest that the graphite surface
as shown
with a carbon hexagon network urges LLL melt to form the β phase with a lamella parallel to it.
As described above, the experiments conducted in this study using HOPG sheets have brought
some information on the roles of the graphite surface. The morphological observation shows that the
3. Discussion
fat crystallization starts on the graphite surface with carbon hexagon network forming thin plate
crystals,
3.1. which
Roles of are Surfaces
Graphite confirmed to be the β phase through X-ray and ATR FTIR measurements.
Furthermore, the polarized ATR FTIR spectra indicate that the double-chain molecular layers of the
As described above, the experiments conducted in this study using HOPG sheets have brought
thin plate crystal are parallel to the graphite surface. The molecular orientation seems to be reasonable
some information on the roles of the graphite surface. The morphological observation shows that the fat
since generally, chain molecules tend to form plate crystals elongated in the lateral direction of
crystallization starts on the graphite surface with carbon hexagon network forming thin plate crystals,
hydrocarbon chains.
These experimental results clearly indicate that the carbon hexagonal network of graphite
provides suitable sites for the nucleation of the β phase. The graphite surface would reduce the
surface energy of the β phase, and therefore, the activation energy for the nucleation would decrease
markedly, resulting in the occurrence of the β phase on the graphite surface.
Without using this additive effect, the generation of the β phase directly from a neat melt isMolecules 2020, 25, 4786 9 of 14
which are confirmed to be the β phase through X-ray and ATR FTIR measurements. Furthermore,
the polarized ATR FTIR spectra indicate that the double-chain molecular layers of the thin plate crystal
are parallel to the graphite surface. The molecular orientation seems to be reasonable since generally,
chain molecules tend to form plate crystals elongated in the lateral direction of hydrocarbon chains.
These experimental results clearly indicate that the carbon hexagonal network of graphite provides
suitable sites for the nucleation of the β phase. The graphite surface would reduce the surface energy
of the β phase, and therefore, the activation energy for the nucleation would decrease markedly,
resulting in the occurrence of the β phase on the graphite surface.
Without using this additive effect, the generation of the β phase directly from a neat melt is highly
difficult; as show in Figure 2a, an ordinary continuous cooling procedure only leads to the occurrence
of the β0 phase, except for very slow cooling. According to the ordinary view of crystal growth [22–24],
TAG molecules are considered to form embryos, precursory clustered molecules for crystal nuclei:
the frequency of occurrence for the embryos of each polymorph would increase with supercooling.
Since the supercooling, namely the driving force for crystallization, is always advantageous to the β
phase, the dominant occurrence of the β0 phase suggests that the β phase has a larger surface energy,
and this acts against the β phase in the nucleation in ordinary cooling [25].
The graphite surface enables the β phase to appear at higher temperatures; as shown in
Figure 2c, the graphite surface induces the isothermal crystallization of the β phase even at 36 ◦ C.
These observations suggest that the surface energy of a precursory cluster is significantly reduced
when it is generated on the graphite surface, and the cluster manages to surpass the activation energy
for nucleation to grow as the β phase by using this benefit.
Generally, crystal faces have many steps, as do the graphite faces. Such steps would interact with
clustered molecules from lateral directions. If the interactions are favorable for the clustered molecules,
the steps on the graphite surface would greatly help the nucleation of fat molecules by reducing the
surface energy. This effect would make it easier for TAG molecules to form clusters on the graphite
surface, especially in the early stage of clustering. The impact of the steps in the new additives is one
of the important research topics for the future.
3.2. Occurrence of the β0 Phase
At the moment, the influence of the graphite surface on the occurrence of the β0 phase is uncertain.
The present study confirms the occurrence of the β0 phase at higher temperatures under the influence
of HOPG surfaces. However, the β0 phase occurs only after the β phase is generated with the help
of graphite surfaces, and it is possible that the β phase promotes the development of the β0 phase.
In fact, the microscopic observation shows that the globular crystals of the β0 phase are sitting on the
surface of the plate crystals of the β phase, suggesting another possibility that the crystal face of the
β phase facilitates the nucleation of the β0 phase from a supercooled melt. We presently have not
enough experimental evidence to judge whether the graphite surface or the previously generated β
plate crystal’s surface promotes the nucleation of the β0 phase. In either case, the occurrence at a higher
temperature has an influence on the subsequent β0 → β solid-state phase transition.
When generated at a higher temperature, the β0 phase would be thermally agitated to transform
to the more stable β phase. This speculation can help to explain why both the crystal growth of the β
phase and the β0 → β phase transition take place in the cooling process of LLL/HOPG and why the β0
phase does not transform in the cooling process of neat LLL.
3.3. Later Stages of Crystallization
After the nucleation on the graphite surface, the β phase grows as thin plate crystals for a while,
keeping its flat face parallel to the graphite surface. However, during its growth in a supercooled melt,
the morphology and arrangement of the plate crystals gradually become disordered, leading to crystal
aggregation and deformation. As for the β0 phase, it grows as globular crystals from the initial stage of
its crystallization, at least at the optical microscopic level.LLL was crystallized on the graphite sheet by heating at 80 °C for 10 min and subsequently
cooling down to 25 °C at a rate of 1 °C/min. For comparison, platelet single crystals of LLL in the β
phase were grown from a hexane solution. The flat face of grown single crystals corresponds to the
(001) plane, i.e., the lamellae of LLL are stacked along the normal of this face [8].
Molecules 2020, 25, 4786 10 of 14
For polarized FTIR spectroscopy, a PerkinElmer Spectrum Two FTIR spectrometer
(PerkinElmer, Inc., Waltham, MA, USA), a Czitek Microm ATR accessory (Czitek, Danbury, CT,
USA),Theandgrowth
a JASCO PL81 wire-grid
behavior and β0 phases isCo.,
of the β polarizer(JASCO Hachioji,toJapan)
considered have awere employed.
crucial influence TheonATRthe
accessory was equipped
time-dependent changes with an internal
observed by the reflection elementsuch
SR-XRD method, (IRE)
as,ofthe
diamond, which
intensities gave a refractive
of reflections and the
index
timingoffor2.38
eachinevent
the region of 4000–400
in the system. Figurecm5−1shows
. The measurements
the sample cell and wereitsconducted
experimentalwith an incident
arrangements.
angle of 45°, aX-ray
The incident resolution of 2 impinges
radiation cm , and the
−1 a scan
HOPG number
sheetgreater thanand
normally, 8. the scattering vector can only
point in a limited range of directions, mostly, nearly parallel to the HOPG surface. Accordingly,
4.3.
onlySR-XRD Analysis
a few lattice points can exhibit X-ray reflections. When the plate crystals of the β phase are
set parallel to the HOPG
Two kinds of specimens plane,
werethere is no chance
prepared: a neat for
LLLthe reflections
melt and a LLL characteristic of the
melt in contact withβ aphase
HOPG to
appear.
sheet. ForThese reflections
the neat woulda be
LLL system, able
hole to appear
(2 mmφ) onlyinafter
drilled the β phase
an aluminum forms
plate crystal
with 1.5 mm aggregation
thickness
with disordered arrangement. On the other hand, the β 0 phase forming globular crystals would tend
was filled with LLL, and then both sides of the hole were sealed with windows of polyimide (Kapton)
to appear
films. fromLLL/HOPG
For the the early stage of crystal
system, growth.
the HOPG Another
layer problem
was placed insideof SR-XRD experiments
the incident windows is to
that
bethe
in
size of the X-ray beam (about 0.2 ×
contact with LLL, as illustrated in Figure 1. 0.2 mm) is not large enough to cover all the structural changes
occurring in the sample cell with a diameter of 1.5 mm.
Figure 5.
Figure Experimentalarrangement
5. Experimental arrangement of
of LLL/HOPG
LLL/HOPG in
in SR-XRD.
SR-XRD.
It can bemeasurements
SR-XRD assumed that the combined
were effect
carried out at of the growth
BL-10C behavior
of Photon andathe
Factory, X-ray experimental
synchrotron radiation
conditions leads to the following phenomena we observe in the experiments using the LLL/HOPG
facility of KEK (Tsukuba, Japan), by applying X-rays with a wavelength of 0.125 nm [26]. SAXS and
sample:
• In the cooling at a rate of 1 ◦ C/min, the occurrence of the β phase was observed by SAXS at 30 ◦ C,
while at 32 ◦ C by microscopic observation.
• As for the isothermal crystallization at 36 ◦ C, the occurrence of the β phase was confirmed by
microscopic observation after holding only for several minutes, while the reflections due to the β
phase finally appeared after about half an hour in the SR-XRD measurements.
• In the continuous cooling crystallization, the reflections of the β phase were weak compared with
those of the neat LLL sample.
Although it is difficult to accurately assess the magnitude of the above-mentioned effects resulting
from the experimental conditions and the growth behavior, it is assumed that the experimental
results obtained by SR-XRD would be affected more or less by the time-dependent orientational and
morphological changes of growing crystals.
In relation to this issue, we would like to make a comment on our previous study on the
new additive effect. At that time, we observed that only weak reflections due to long spacings
appeared during the crystallization process promoted by a powder of graphite, and speculated that
the crystallization started from the clusters of LLL molecules with acyl chains adhered in parallel
to the carbon hexagon network [4]. However, we have recently noticed that crystalline regions
growing from graphite particles interfere with each other when they come into contact, and as a result,
some preferential orientations of crystal region are generated in the specimen. Some resultant crystalline
samples have showed quite weak long-space reflections, as we observed previously. Through these
experiences, we have learned that the inhomogeneous orientation of crystalline tissues would happen
even in the heterogeneous crystallization induced by fine powder additives if certain conditions
are met.Molecules 2020, 25, 4786 11 of 14
4. Materials and Methods
4.1. Samples
LLL with ≥99% purity was purchased from Sigma-Aldrich (St. Louis, USA) and used without
further purification. Graphite sheets of Grafoil®GTA with 0.076 mm thickness were purchased from
NeoGraf (Lakewood, CA, USA). HOPG of SPI®HOPG GRADE 1 was purchased from Structure Probe
(West Chester, PA, USA) and cleaved to a thin layer for usage.
4.2. Polarized FTIR Spectroscopy with ATR Sampling Technique
LLL was crystallized on the graphite sheet by heating at 80 ◦ C for 10 min and subsequently cooling
down to 25 ◦ C at a rate of 1 ◦ C/min. For comparison, platelet single crystals of LLL in the β phase were
grown from a hexane solution. The flat face of grown single crystals corresponds to the (001) plane,
i.e., the lamellae of LLL are stacked along the normal of this face [8].
For polarized FTIR spectroscopy, a PerkinElmer Spectrum Two FTIR spectrometer (PerkinElmer,
Inc., Waltham, MA, USA), a Czitek Microm ATR accessory (Czitek, Danbury, CT, USA), and a JASCO
PL81 wire-grid polarizer(JASCO Co., Hachioji, Japan) were employed. The ATR accessory was
equipped with an internal reflection element (IRE) of diamond, which gave a refractive index of 2.38
in the region of 4000–400 cm−1 . The measurements were conducted with an incident angle of 45◦ ,
a resolution of 2 cm−1 , and a scan number greater than 8.
4.3. SR-XRD Analysis
Two kinds of specimens were prepared: a neat LLL melt and a LLL melt in contact with a HOPG
sheet. For the neat LLL system, a hole (2 mmφ) drilled in an aluminum plate with 1.5 mm thickness
was filled with LLL, and then both sides of the hole were sealed with windows of polyimide (Kapton)
films. For the LLL/HOPG system, the HOPG layer was placed inside the incident windows to be in
contact with LLL, as illustrated in Figure 1.
SR-XRD measurements were carried out at BL-10C of Photon Factory, a synchrotron radiation
facility of KEK (Tsukuba, Japan), by applying X-rays with a wavelength of 0.125 nm [26]. SAXS and
WAXS from samples were simultaneously detected to obtain the information about long- and
short-spacings of highly ordered anisotropic crystal lattices. Dectris PILATUS3 2M and PILATUS3
200K were employed as the SAXS and WAXS detectors, respectively. During the measurements,
each sample was heated at 80 ◦ C for 10 min, subsequently cooled down to 0 ◦ C at a rate of 1 ◦ C/min,
and then reheated up to 80 ◦ C at a rate of 5 ◦ C/min. For LLL/HOPG, the SR-XRD profile was also
taken under an isothermal condition by cooling at 36 ◦ C for 60 min after quench cooling at a rate of
20 ◦ C/min from 80 ◦ C. The thermal control was done by using a thermoelectric cooling/heating device,
Linkam 10002L. The cooling and heating rates were chosen to be the same as those in our previous
study [4]. The relatively slow cooling rate is crucial; if it is too high, the effect of the additives is less
likely to be reflected in polymorphism.
4.4. SEM Observation
Prior to being introduced to the Cryo-SEM unit, thermodynamically stabilized LLL crystals were
prepared for LLL/HOPG by crystallizing LLL on an HOPG layer-attached aluminum pan. Using a
cooling/heating device, Linkam 10021, crystallization was performed as follows: (i) heating at 80 ◦ C for
10 min, (ii) cooling down to 0 ◦ C at a rate of 1 ◦ C/min, (iii) reheating up to 35 ◦ C at a rate of 5 ◦ C/min
and holding at the temperature for 10 min, and (iv) re-cooling down to 20 ◦ C at a rate of 1 ◦ C/min.
The procedures (iii) and (iv) were conducted to make the meta stable β’ phase transform to the stable
β phase and to carry out SEM measurements at a temperature sufficiently lower than the melting point
of the β phase.
The sample pan thus obtained was fixed onto a brass holder via a carbon seal binder and then
transferred to the evacuated and pre-cooled sample chamber of a Gatan Alto 1000 cryo-preparationMolecules 2020, 25, 4786 12 of 14
and coating station. In the cryo-chamber, each sample was coated with fine gold particles by means
of ion-sputtering vapor deposition. Subsequently, the sample holder was directly introduced to the
cold stage of a Hitachi High-Technologies SU3500 SEM equipped with an electron gun of a tungsten
hairpin filament. SEM images of the sample surfaces were acquired as secondary electron images with
a magnification of ×100 in a high vacuum mode (60 Pa) where electron beams with an acceleration
voltage at 3 kV were applied to the sample cooled at −125 ◦ C.
4.5. POM Observation
In contrast to the SEM imaging for the annealed LLL crystals, the morphology of LLL crystals
changing with the crystal growth was observed by POM using a Keyence VHX-600 digital microscope.
For neat LLL and LLL/HOPG, sample preparation and POM observation were carried out in the
procedure as follows: (i) The melts of 4 µL LLL were placed on a glass plate and an HOPG-layer-attached
glass plate, respectively. (ii) The samples were covered with cover slips, then heated at 80 ◦ C for
10 min. (iii) LLL was crystallized by cooling at a rate of 1 ◦ C/min or by isothermally cooled at 36 ◦ C
after quench cooling at a rate of 20 ◦ C/min. (iv) During the crystallization processes, POM images were
periodically taken with a magnification of ×500 in a reflection mode. The temperature of the samples
was controlled by using a Linkam 10002L attached to a stage of the digital microscope.
5. Conclusions
We have studied the crystallization behavior of LLL induced by highly oriented graphite by
employing POM, Cryo-SEM, SR-XRD, and polarized FTIR-ATR spectroscopy. The results indicate that
the graphite surface with carbon hexagon network promotes the occurrence of the β phase through the
heterogeneous nucleation, which starts with the formation of LLL clusters with double-chain length
molecular layers oriented in parallel to the graphite surface.
Author Contributions: Concepturalization, F.K. and S.Y.; methodology, F.K. and Y.Y.; Experiments, F.K. and S.Y.;
data analysis, F.K., Y.Y., S.Y.; writing, F.K. and S.Y. All authors have read and agreed to the published version of
the manuscript.
Funding: This research received no external funding
Acknowledgments: This work was performed under the approval of the Photon Factory Program Advisory
Committee (Proposal No. 2016G076).
Conflicts of Interest: The authors declare no conflict of interest.
Appendix A
ATR-FTIR spectroscopy employs an electric field, so-called evanescent wave, which is caused by
the total reflection of the incident radiation at the interface between a sample and a high refractive
index prism called internal reflection element (IRE) [13,27]. The evanescent wave generated in the
sample surface region wanes as apart from the sample/IRE interface in the order of light wavelength.
Therefore, only the chemical species in the surface region about a few µm thick cause IR absorption.
The characteristics of the evanescent wave significantly depend on the polarization of incident
radiation. The s-polarized incident radiation generates an electric field parallel to the interface (// the
y axis in Figure 4a and the p-polarized incident radiation generates an electric field containing both
a parallel component (// the x axis) and a perpendicular component (// the z axis) [28]). As for a
uniaxially oriented sample, i.e., isotropic in the xy plane, the absorption intensities with p and s
polarizations, Ap and As , are related to the in-plane (// the xy plane) and out-of-plane (// the z axis)
extinction coefficients, k// and k⊥, as follows in Equations (A1) and (A2):
Ap = cA (k// + α k⊥ ) (A1)
As = cA (β k// ) (A2)Molecules 2020, 25, 4786 13 of 14
Here, cA is a constant, and α and β are parameters determined by incident angle θ and refractive
indices of prism and sample, n1 and n2 . In the present experimental conditions of θ = 45◦ , n1 = 2.4,
and n2 = 1.5, α and β are estimated to be 6.3 and 3.7, respectively. Therefore, p-polarized spectra
emphasize IR-active modes whose transition moments are in a direction about perpendicular to the
IRE sampling face. s-polarized spectra emphasize IR-active modes whose transition moments are
about parallel to the IRE face. Generally speaking, the z component of transition moments gives the
most striking effect on polarized ATR spectra.
References
1. Smith, K.W.; Sato, K. Effects of Foreign and Indigenous Minor Components. In Crystallization of Lipids; Wiley:
Hoboken, NJ, USA, 2018; pp. 263–281.
2. Smith, K.W.; Bhaggan, K.; Talbot, G.; Van Malssen, K.F. Crystallization of Fats: Influence of Minor Components
and Additives. J. Am. Oil Chem. Soc. 2011, 88, 1085–1101. [CrossRef]
3. Ishibashi, C.; Hondoh, H.; Ueno, S. Epitaxial Growth of Fat Crystals on Emulsifier Crystals with Different
Fatty Acid Moieties. Cryst. Growth Des. 2017, 17, 6363–6371. [CrossRef]
4. Yoshikawa, S.; Kida, H.; Sato, K. Promotional Effects of New Types of Additives on Fat Crystallization.
J. Oleo Sci. 2014, 63, 333–345. [CrossRef] [PubMed]
5. Yoshikawa, S.; Kida, H.; Sato, K. Fat crystallization with talc particles is influenced by particle size,
concentration, and cooling rate. Eur. J. Lipid Sci. Technol. 2015, 117, 858–868. [CrossRef]
6. Sato, K. Crystallization behavior of fats and lipids—A review. Chem. Eng. Sci. 2001, 56, 2255–2265. [CrossRef]
7. Sato, K.; Ueno, S. Physical properties of fats in food. In Fats in Food Technology, 2nd ed.; Rajah, K.K., Ed.;
John Wiley & Sons Ltd.: Chichester, UK, 2014; pp. 1–38.
8. Takeuchi, M.; Ueno, S.; Sato, K. Synchrotron Radiation SAXS/WAXS Study of Polymorph-Dependent Phase
Behavior of Binary Mixtures of Saturated Monoacid Triacylglycerols. Cryst. Growth Des. 2003, 3, 369–374.
[CrossRef]
9. Chung, D.D.L. Review Graphite. J. Mater. Sci. 2002, 37, 1475–1489. [CrossRef]
10. Kellens, M.; Meeussen, W.; Gehrke, R.; Reynaers, H. Synchrotron radiation investigations of the polymorphic
transitions of saturated monoacid triglycerides. Part 1: Tripalmitin and tristearin. Chem. Phys. Lipids 1991,
58, 131–144. [CrossRef]
11. Kellens, M.; Meeussen, W.; Gehrke, R.; Reynaers, H. Synchrotron radiation investigations of the polymorphic
transitions in saturated monoacid triglycerides. Part 2: polymorphism study of a 50: 50 mixture of tripalmitin
and tristearin during crystallization and melting. Chem. Phys. Lipids 1991, 58, 145–158. [CrossRef]
12. Sato, K.; Ueno, S.; Yano, J. Molecular interactions and kinetic properties of fats. Prog. Lipid Res. 1999, 38,
91–116. [CrossRef]
13. Milosevic, M. Internal Reflection and ATR Spectroscopy. Appl. Spectrosc. Rev. 2004, 39, 365–384. [CrossRef]
14. Chapman, D. The 720 cm.–1 band in the infrared spectra of crystalline long-chain compounds. J. Chem. Soc.
1957, 4489–4491. [CrossRef]
15. Chapman, D. Infrared spectroscopic characterization of glyceriddes. J. Am. Oil Chem. Soc. 1960, 37, 73–77.
[CrossRef]
16. Yano, J.; Kaneko, F.; Kobayashi, M.; Sato, K. Structural Analyses of Triacylglycerol Polymorphs with FT-IR
Techniques. 1. Assignments of CH2Progression Bands of Saturated Monoacid Triacylglycerols. J. Phys.
Chem. B 1997, 101, 8112–8119. [CrossRef]
17. Yano, J.; Kaneko, F.; Kobayashi, M.; Kodali, D.R.; Small, D.M.; Sato, K. Structural Analyses and Triacylglycerol
Polymorphs with FT-IR Techniques. 2. β0 1-Form of 1,2-Dipalmitoyl-3-myristoyl-sn-glycerol. J. Phys. Chem. B
1997, 101, 8120–8128. [CrossRef]
18. Jensen, L.H.; Mabis, A.J. Crystal Structure of β-Tricaprin. Nat. Cell Biol. 1963, 197, 681–682. [CrossRef]
19. Jensen, L.H.; Mabis, A.J. Refinement of the structure of β-tricaprin. Acta Crystallogr. 1966, 21, 770–781.
[CrossRef]
20. Vand, V.; Bell, I.P. A direct determination of the crystal structure of the β form of trilaurin. Acta Crystallogr.
1951, 4, 465–469. [CrossRef]
21. Van Langevelde, A.; Van Malssen, K.; Hollander, F.; Peschar, R.; Schenk, H. Structure of mono-acid
even-numbered β-triacylglycerols. Acta Crystallogr. Sect. B Struct. Sci. 1999, 55, 114–122. [CrossRef]Molecules 2020, 25, 4786 14 of 14
22. Boistelle, R.; Astier, J. Crystallization mechanisms in solution. J. Cryst. Growth 1988, 90, 14–30. [CrossRef]
23. Aquilano, D.; Sgualdino, G. Fundamental Aspects of Equilibrium and Crystallization Kinetics.
In Crystallization Processes in Fats and Lipid Systems, 1st ed.; Garti, N., Kiyotaka, S., Eds.; CRC Press:
Boca Raton, FL, USA, 2001; pp. 15–66.
24. Chernov, A.A. Modern Crystallography III; Springer: Berlin, Germany, 1984.
25. Hondoh, H.; Ueno, S.; Sato, K. Fundamental Aspects of Crystallization of Lipids. In Crystallization of Lipids;
Sato, K., Ed.; John Wiley & Sons: Hoboken, NJ, USA, 2018; pp. 105–141.
26. Shimizu, N.; Mori, T.; Nagatani, Y.; Ohta, H.; Saijo, S.; Takagi, H.; Takahashi, M.; Yatabe, K.; Kosuge, T.;
Igarashi, N. BL-10C, the small-angle x-ray scattering beamline at the photon factory. In Proceedings of the
13th International Conference on Synchrotron Radiation Instrumentation – SRI2018 AIP Conf. Proc. 2054,
Taipei, Taiwan, 11–15 June 2018; AIP Publishing: Melville, NY, USA, 2019; Volume 2054, p. 060041.
27. Harrick, N.J. Internal Reflection Spectroscopy; Interscience Publishers Inc.: New York, NY, USA, 1967.
28. Flournoy, P.; Schaffers, W. Attenuated total reflection spectra from surfaces of anisotropic, absorbing films.
Spectrochim. Acta 1966, 22, 5–13. [CrossRef]
Sample Availability: Samples of neat LLL and LLL/HOPG are available from the authors.
Publisher’s Note: MDPI stays neutral with regard to jurisdictional claims in published maps and institutional
affiliations.
© 2020 by the authors. Licensee MDPI, Basel, Switzerland. This article is an open access
article distributed under the terms and conditions of the Creative Commons Attribution
(CC BY) license (http://creativecommons.org/licenses/by/4.0/).You can also read