Investigation of Dimension Stone on the Island Braˇc-Geophysical Approach to Rock Mass Quality Assessment - MDPI
←
→
Page content transcription
If your browser does not render page correctly, please read the page content below
geosciences
Article
Investigation of Dimension Stone on the Island
Brač—Geophysical Approach to Rock Mass
Quality Assessment
Jasmin Jug 1 , Kristijan Grabar 2, *, Stjepan Strelec 1 and Filip Dodigović 1
 1    Faculty of Geotechnical Engineering, University of Zagreb, Hallerova aleja 7, Varaždin 42000, Croatia;
      jasmin.jug@gfv.unizg.hr (J.J.); stjepan.strelec@gfv.unizg.hr (S.S.); filip.dodigovic@gfv.unizg.hr (F.D.)
 2    SPP d.o.o., Trstenjakova 3, Varaždin 42000, Croatia
 *    Correspondence: kristijan@spp.hr; Tel.: +385-42-203302

 Received: 14 February 2020; Accepted: 19 March 2020; Published: 21 March 2020

 Abstract: A site located on the island of Brač is known in history for world-famous architectural
 stone and stone mining, dating all the way back to ancient Greek and Roman times. The most
 famous building constructed from the stone from Brač is the Diocletian Cesar Palace in the town Split.
 Prospective new locations for quarries are still required because the demand for the stone from the
 island is still high. This paper presents a review of undertaken geophysical investigations, as well as
 engineering geologic site prospection, with the purpose of determining if the rock mass quality is
 suitable for the mining of massive blocks needed for an architectural purpose—dimension stones.
 Several surface noninvasive geophysical methods were applied on the site, comprising of two seismic
 methods, multichannel analysis of surface waves (MASW) and shallow refraction seismic (SRS)
 electrical methods of electrical resistivity tomography (ERT), as well as electromagnetic exploration
 with ground penetrating radar (GPR). Results of geophysical investigations were compared to the
 engineering geologic prospection results, as well to the visible rock mass structure and observed
 discontinuities on the neighboring existing open mine quarry. Rock mass was classified into three
 categories according to its suitability for dimension stone exploitation. Each category is defined by
 compressional and shear seismic velocities as well as electrical resistivity. It has been found that even
 small changes in moisture content within the large monolithic rock mass can influence measured
 values of electrical resistivity. In the investigated area, dimension stone quarrying is advisable if the
 rock mass has values of resistivity higher than 3000 Ωm, as well as compressional seismic velocities
 higher than 3000 m/s and shear wave velocities higher than 1500 m/s. Georadar was found to be a
 good tool for the visual determination of fissured systems, and was used to confirm findings from
 other geophysical methods.

 Keywords: surface geophysics; MASW; SRS; ERT; GPR; rock mass quality; dimension stone

1. Introduction
     The main purpose of all undertaken explorations was to evaluate the location’s acceptability
for future exploitation of the architectural structural stone, in the manner of extraction of dimension
stones [1]. The research site is located in the Republic of Croatia, on the island of Brač, the largest
island of central Dalmatia. The area spans over 3 hectares, the terrain elevation is 320 m above sea
level, and the closest inhabited place, Donji Humac, is approximately 660 m northwest from the site.
The geographical location of the research site is shown in Figure 1. To consider rock mass interesting
from the point of view of extracting a dimension stone, a large supply of mass with similar texture and
color should be confirmed. From the economical perspective of dimension stone mining, the strength
and deformation properties of the analyzed jointed mass are very important [2].

Geosciences 2020, 10, 112; doi:10.3390/geosciences10030112                       www.mdpi.com/journal/geosciences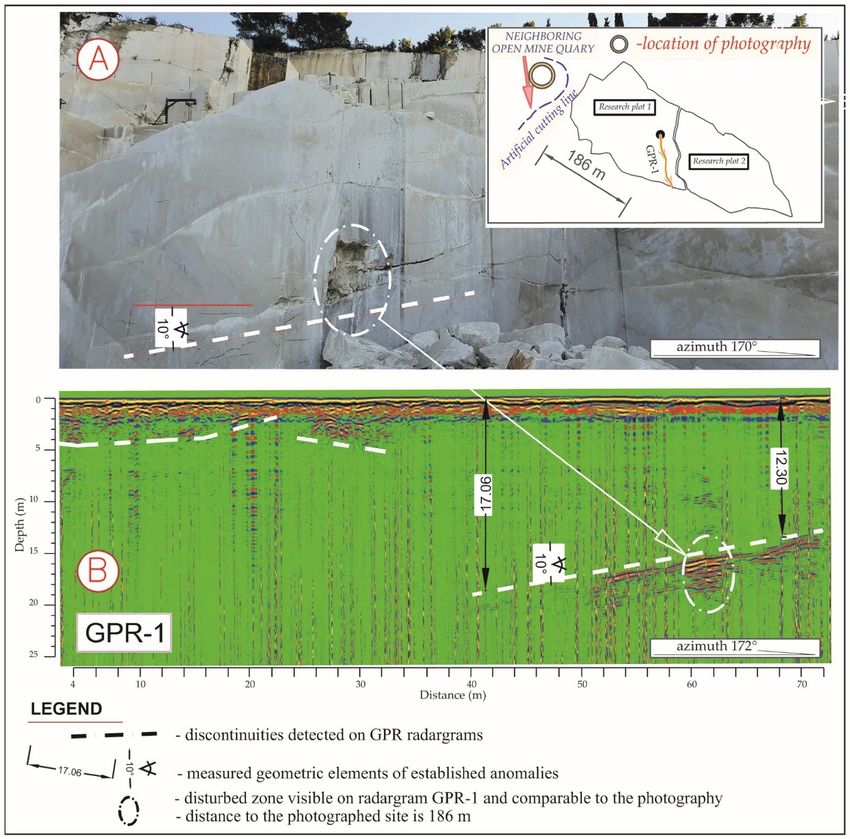
Geosciences 2020, 10, 112 2 of 15
Geosciences 2020, 10, x FOR PEER 2 of 15
Figure 1. Research site location on the island of Brač.
Figure 1. Research site location on the island of Brač.
Investigation works comprise geological surveys and geophysical explorations. Geological
Investigation works comprise geological surveys and geophysical explorations. Geological
prospection includes engineering geologic map creation at an appropriate scale, showing all the
prospection includes engineering geologic map creation at an appropriate scale, showing all the
available
available geologicalelements
geological elements[3], [3],such
such as
as bedding planes, folds
bedding planes, foldsand
andshear
shearzones
zonesasaswell
wellasas geological
geological
boundaries
boundariesvisible
visibleform
formthetheterrain
terrain surface. Deeper rock
surface. Deeper rock mass
massquality
qualitywaswasassessed
assessedbybygeophysical
geophysical
profiling with a planned depth resolution of 20–30 m [4]. Altogether, four seismic
profiling with a planned depth resolution of 20–30 m [4]. Altogether, four seismic profiles profiles were recorded,
were
Seis-1 to Seis-4,
recorded, Seis-1with dispositive
to Seis-4, with lengths of 69lengths
dispositive m, applying
of 69 m,twoapplying
seismic two techniques,
seismic multichannel
techniques,
analysis of surface
multichannel waves
analysis (MASW)
of surface (Vs)(MASW)
waves and shallow
(Vs) and refraction seismic (SRS)
shallow refraction (Vp),
seismic (SRS)two electrical
(Vp), two
resistivity
electrical resistivity tomography (ERT) profiles, each 277.3 m in length, and six georadar (GPR) of
tomography (ERT) profiles, each 277.3 m in length, and six georadar (GPR) radargrams
100 to 300 m inoflength.
radargrams Westward,
100 to 300 in theWestward,
m in length. near vicinity of the
in the nearinvestigated
vicinity of thesite,investigated
is an operational
site, isstone
an
quarry. Stone stone
operational blocksquarry.
from the neighboring
Stone blocks fromquarry vary in quality.
the neighboring Forvary
quarry the purpose
in quality.of For
thisthe
investigation,
purpose
the
ofterrain’s surface was
this investigation, thepartially
terrain’s cleared
surface ofwasvegetation so that of
partially cleared thevegetation
geophysical profiles
so that could be laid
the geophysical
profiles
down. could be laidthe
In conclusion, down.
site’sInsuitability
conclusion,forthe site’s suitability
mining applications for was
mining applications
primarily basedwason theprimarily
result of
based on the
geophysical result of geophysical
explorations distributedexplorations
in profiles asdistributed
in Figure 2. in All
profiles
named as investigative
in Figure 2. All worksnamedwere
investigative works
done in October 2019. were done in October 2019.
Relevantstructural
Relevant structuralproperties
properties of of dimension
dimension blocks
blocks were
weredefined
definedthrough
througha asingle
singlecriterion—an
criterion—an
absenceofofstructural
absence structuralandandmacro
macrodiscontinuities
discontinuities [5].
[5]. Other
Otherdesired
desiredparameters,
parameters,like likecolor
colorandand texture,
texture,
were not considered in this work. Geophysical methods are considered to be
were not considered in this work. Geophysical methods are considered to be helpful to define macro helpful to define macro
discontinuities,fractures
discontinuities, fracturesandandfractured
fracturedzones
zones[6].
[6].Successful
Successfulexplorations
explorationswith withthetheuse
useofofgeoradar
georadarare
are documented as a single geophysics addition to geological mapping
documented as a single geophysics addition to geological mapping and core drilling [7]. and core drilling [7].
Geosciences 2020, 10, 112 3 of 15
Geosciences 2020, 10, x FOR PEER 3 of 15
The usual way of assessing prospective dimension stone locations is by the basic geological tools
of mapping and diamond
The usual core drilling
way of assessing [6]. As
prospective presented
dimension stoneinlocations
this paper,
is bysecondary surface tools
the basic geological deposits
can of
mask the entire
mapping process core
and diamond of geological
drilling [6].mapping, so insight
As presented into deeper
in this paper, rocksurface
secondary formations could
deposits can not
be acquired
mask the[8]. In process
entire this caseofstudy, rockmapping,
geological mass structural elements
so insight could
into deeper only
rock be acquired
formations couldatnot
Research
be
Plotacquired
1 and only onthis
[8]. In a very few available
case study, rock massrock outcrops.
structural Adjoining
elements could onlythebeinvestigation plot there
acquired at Research Plotis an
open1 and
mineonly onvisible
with a very few available
artificial rocklines,
cutting outcrops.
thusAdjoining
enablingthe datainvestigation plot thereexplorations
from geophysical is an open to
mine with corelated
be compared, visible artificial cutting lines,
and calibrated. Forthus enabling
complete data in
insight from geophysical
terms explorationsortotextural
of color variations be
compared, corelated and
variations, boreholes are needed.calibrated. For complete insight in terms of color variations or textural
variations, boreholes are needed.
Figure
Figure 2. Geophysicalprofiles
2. Geophysical profilesdistributed
distributed on
on the
the two
two research
researchplot
plotareas.
areas.TheThe
profiles are are
profiles mainly
mainly
positioned around the two parallel profiles defined with electrical resistivity tomography
positioned around the two parallel profiles defined with electrical resistivity tomography (ERT-1 (ERT-1 and and
ERT-2) profiles. The position of the neighboring quarry on the west side is also labeled.
ERT-2) profiles. The position of the neighboring quarry on the west side is also labeled.
2. Geological
2. Geological Properties
Properties ofofInvestigated
InvestigatedArea
Area
TheThe researched
researched area
area is is relativelywell
relatively wellinvestigated
investigated in
inthe
thegeological
geologicalsense, as as
sense, mining on the
mining on island
the island
is well established. Several references regarding the geological structure were
is well established. Several references regarding the geological structure were addressed, addressed, andandthe the
mostmost important
important areare [9–11].The
[9–11]. Therock
rockmass
mass structure
structure in
inthe
theregion
regionisiscarboniferous,
carboniferous, mainly builtbuilt
mainly of of
limestone of the upper Cretaceous age—Santonian. Santonian limestone—K23—is 3 thick-bedded, of
limestone of the upper Cretaceous age—Santonian. Santonian limestone—K2 —is thick-bedded, of
blocky mass type, and rarely has inserts of laminated limestone or dolomite. According to
blocky mass type, and rarely has inserts of laminated limestone or dolomite. According to petrographic
petrographic classification, limestone is mostly of calcareous composition and only partially
classification, limestone is mostly of calcareous composition and only partially bioaccumulated. The
bioaccumulated. The percentage of calcareous compounds is high, up to 99%. Biogenic compounds
percentage of calcareous
are mainly contained in compounds
the fragments.is high,
Rockup to 99%.
mass, Biogenic
depending compounds
on biogenic are mainly
percentage, contained in
was classified
the fragments. Rock mass, depending
as either wackestone or floatstone [3]. on biogenic percentage, was classified as either wackestone or
floatstone [3].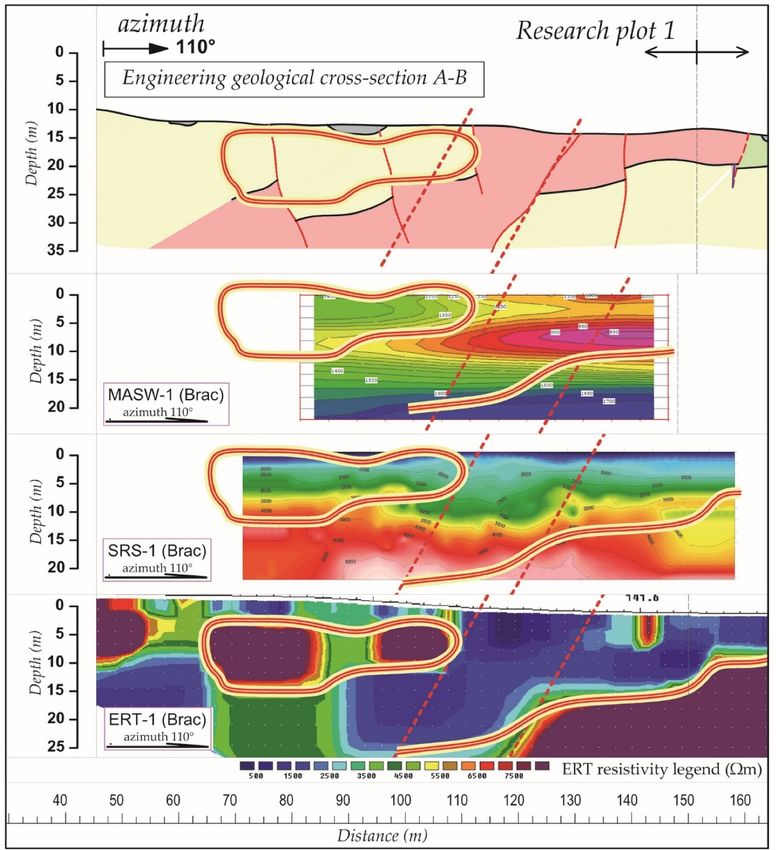
Geosciences 2020, 10, 112                                                                                      4 of 15

  Geosciences 2020, 10, x FOR PEER                                                                              4 of 15
Geosciences 2020, 10, x FOR PEER                                                                              4 of 15
     Geological mapping on the terrain’s surface revealed several rock outcrops of blocky type limestone
       Geological
with Geological
     rock         mapping on thenot
          mass structural            terrain’s surface revealed    several rock two
                                                                                outcrops   of blocky type
                 mappingelements        completely
                           on the terrain’s  surfaceclear [12]. Photographs
                                                      revealed  several rock of
                                                                              outcropsobservation
                                                                                         of blockypoints
                                                                                                    type
  limestone
are shown in with
             Figurerock  mass  structural  elements   not  completely   clear [12].  Photographs   of two
limestone  with  rock3. mass structural elements not completely clear [12]. Photographs of two
  observation points are shown in Figure 3.
observation points are shown in Figure 3.

                              (a)                                                       (b)
                            (a)                                                       (b)
        Figure 3.(a)(a) Rock
                      Rock     mass
                            mass     surface
                                  surface    outcrops of
                                           outcrops        karstified thick-bedded   to blocky type limestone; (b)
      Figure
      Figure 3.
              3. (a) Rock   mass  surface  outcrops ofof karstified
                                                         karstified thick-bedded
                                                                    thick-bedded toto blocky
                                                                                      blocky type
                                                                                             type limestone;
                                                                                                  limestone; (b)
                                                                                                             (b)
        Surface
      Surface    outcrop   of thin-layered clayey  limestone  identified on the plot.
      Surface outcrop
              outcrop ofof thin-layered
                           thin-layered clayey
                                         clayey limestone
                                                 limestone identified
                                                            identifiedon
                                                                       onthe
                                                                          theplot.
                                                                              plot.

    Structural  properties
       Structural propertiesof of
                               rock  mass,
                                  rock     asas
                                       mass, recorded  from
                                                recorded    thethe
                                                         from    surface, areare
                                                                   surface,   depicted  onon
                                                                                 depicted  thethe
                                                                                                engineering
                                                                                                  engineering
     Structural properties of rock mass, as recorded from the surface, are depicted on the engineering
geological map
  geological mapin in
                    Figure 4. 4.
                      Figure
geological map in Figure 4.

         Figure 4. Engineering geological map of the investigated area. The majority of surface visible rock
      Figure 4.
      Figure    4. Engineering geological map of the investigated
                                                     investigated area.
                                                                  area. The majority of surface visible rock
         mass structural elements on rock outcrops were recorded on Research Plot 1. Observed fault position
      mass   structural elements on  rock outcrops were recorded on Research
      mass structural elements on rock outcrops were recorded on Research    Plot
                                                                           Plot 1. 1. Observed
                                                                                   Observed    fault
                                                                                             fault   position
                                                                                                   position is
         is also depicted on the map.
      is also
      also     depicted
            depicted  onon
                         thethe map.
                             map.

       The stratification plane (SS) is almost horizontal, just slightly inclined towards the Northeast—
     The stratification plane (SS) is almost horizontal, just slightly inclined towards the Northeast—
  direction azimuth 15–20°, inclination 5–15°. Axial planes (AR), although unclearly expressed because
direction azimuth 15–20°, inclination 5–15°. Axial planes (AR), although unclearly expressed because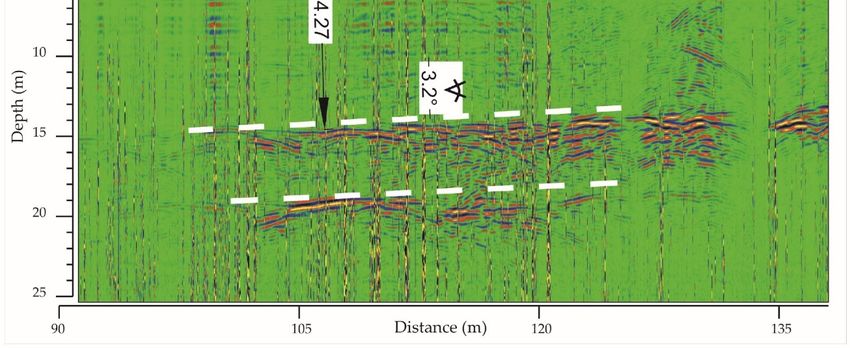
Geosciences 2020, 10, 112                                                                             5 of 15

      The stratification plane (SS) is almost horizontal, just slightly inclined towards the
Northeast—direction azimuth 15–20◦ , inclination 5–15◦ . Axial planes (AR), although unclearly
expressed because of blocky rock mass bedding, have a general direction 200◦ /80◦ . Planes perpendicular
to the structural axis (b) have direction 110◦ /80◦ –85◦ . It needs to be remarked that only a few surface
outcrops of blocky type limestone (dugv K2 3 ) are visible on Research Plot 1 of the investigation area,
Figure 3a. On Research Plot 2 none of the named stone could be observed. On Research Plot 2,
quaternary deposits are also present (deQ2) and on the far southeast, a relatively wide zone of thin
laminated clayey limestone (plv K2 3 ) was also identified (Figure 3b). On the eastern border of Research
Plot 1, fault zone was registered which could be observed along the 40 m long line. The fault strike
is inclined towards the southwest with an inclination of 55◦ –60◦ . Fault planes and adjoining crack
orientations are 220◦ /55◦ –60◦ . The fault planes match the orientation of axial planes (AR). Perpendicular
to the axial planes, perpendicular planes to the structural axis (b) could be singled out with the direction
330◦ /15◦ –30◦ .
      The range of the measured inclinations is a result of extremely karstified surface conditions and
superficial karst topography. The structural geological rock mass elements observed on the surface of
the investigation area are shown in Table 1. Measurements were conducted on eleven observation
points, of which eight had visible stratification planes and three had visible crack orientations.

                            Table 1. Summary of measured rock mass structural elements.

                     Structural Element         Azimuth of Plane Inclination       Inclination
                   Stratification plane SS                 15◦ –20◦                   5◦ –15◦
                       Axial plain AR                       220◦                          60◦
                  Perpendicular to axis b                   330◦                     15◦ –30◦

     Besides the described lithology member of Santonian limestone, slightly transported
colluvium-residual soil of brown–red silty clay was also identified on the site—terra rossa.
     In the hydrogeological sense, the investigated area is poor with groundwater. Two water reservoirs
were found on the site which are used for watering in local farming.

3. Geophysical Investigations
     Several geophysical techniques were used to identify deeper rock quality apart from visible
geological elements observable from the surface. In this preliminary phase, boreholes were not
considered because of disadvantages such as expenses, limited data and damage to the study area, and
because they would have taken a relatively long time to execute. Four surface geophysical methods
were available, and each method was evaluated for its advantages and disadvantages according to the
target type of the study area [13].

3.1. Georadar (GPR)
     Rock quality could be well investigated using electromagnetic techniques. Electromagnetic waves
propagate through the medium of blocky limestone, thus reflecting inhomogeneity with different
parameters such as layer boundaries. The received signal, however, in addition to the reflected wave,
also contains a direct wave that travels the shortest distance, directly from the transmitting to the
receiving antenna. Therefore, the receiver's output signal is a combination of the transmitter's pulse
followed by reflected pulses. This transmitter's pulse should be used as a starting point for estimating
a delay time of reflected signals for the purpose of determining the target's depth. The section of the
recorded GPR-2 radargram is shown in Figure 5. Dielectric permeability equal to six was chosen for a
time-depth conversion procedure in blocky limestone [14]. Values are primarily controlled by water
saturation and, secondarily, by porosity and mineralogy. Differences in the dielectric constant must be
greater than two to produce reflections that can be recorded above background noise.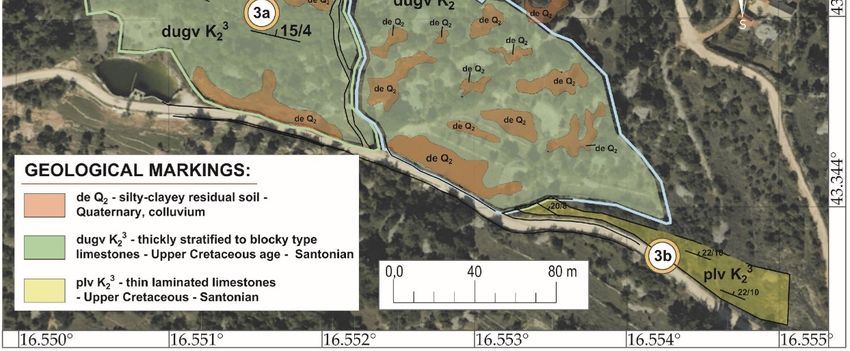
depending on the chosen resolution depth. It is important to ensure an appropriate setup at the first
   start of georadar, with a given antenna and for the given range value. Distance of profile is measured
   by the wheel attached to the antenna.
         It is important to understand GPR images, and the limits of GPR imaging the difference in
   dielectric  constants. It is evident that the influence of changed porosity is more pronounced when
Geosciences 2020, 10, 112                                                                                6 of 15
   water occupies the pores. As shown in Figure 5, visible bedding planes must exceed at least 35%
   porosity differences to obtain a high reflection coefficient to show sharp contact, as in the figure.

     Figure  5. 5.Radargram
        Figure     Radargramrecorded
                              recordedalong
                                       along line
                                               line GPR-2 with
                                                            with interpreted
                                                                  interpretedstratification
                                                                              stratificationplanes
                                                                                             planes  observed
                                                                                                   observed    along
                                                                                                            along
     thethe
          profiles.                              ◦ –5◦ . Measured dip corresponds well to the observations on
            profiles.Measured
                      Measuredinclination
                                inclination of
                                            of 33°–5°.   Measured dip corresponds well to the observations on
        surface
     surface    rock
              rock    outcrops.
                    outcrops.

      Field  GPR profiling
         Limestone    rock mass was  done
                                    has     using a propagation
                                        an average   ZOND12e GPR   velocity  of ∼0.3
                                                                        system   (Radar   System,
                                                                                      m/ns,  while Inc.   Latvia)
                                                                                                     the water   or and
                                                                                                                    air a
300inMHz
      cracks  betweenantenna.
            shielded     stratum contact   surfaces
                                   Acquiring        have velocities
                                               was done              of eithersoftware.
                                                           with the Prism2     0.11 m/nsOnly
                                                                                           or 0.03
                                                                                                 a m/ns,  thus real-time
                                                                                                   high-pass   giving
   highwas
filter   velocity
             used contrast
                    for trace [15]. High contrast,
                                recording.          in the example,
                                              The filter’s            produces is
                                                            cutoff frequency      a good   quality GPR
                                                                                    automatically      setradargram.
                                                                                                           to attenuate
   Radargram traces
low-frequency      noise,contain
                           whichfew    phases
                                    arises     of waves
                                           while         arrivedison
                                                  the antenna        the receiver:
                                                                   crossing        first arrivals
                                                                             the rough    terrain.ofThe
                                                                                                     reflected
                                                                                                         trace waves
                                                                                                                stacking
   passed   only once   through   the  medium,   and secondary    waves  in the form  of  direct or
selected was two, with 512 samples per trace. The signal was recorded without any gain. Gain is usedrefracted  waves.
   Thewhile
only    special  shape of the
               displaying    theemitted
                                  data inpulse   waveof
                                           the form    makes   it possible
                                                         the radar         to detect
                                                                     profile.  Pulseposition    within the
                                                                                       delay changes      thereflected
                                                                                                              sounding
   signal,  and it is used  to determine    zero ground   level for ground-coupled     antennas.
signal’s position within the sounding time range. Values for shown recordings are 300 to 500 ns,
dependingFigureon6the
                    shows
                       chosenan resolution
                                 example ofdepth.
                                               a goodIt quality  GPR radargram,
                                                        is important   to ensure antogether     with setup
                                                                                       appropriate     the corelating
                                                                                                              at the first
   photography and visible planes of stratum, parting as photographed on the neighboring open mine
start of georadar, with a given antenna and for the given range value. Distance of profile is measured
   artificial cutting line.
by the wheel attached to the antenna.
      It is important to understand GPR images, and the limits of GPR imaging the difference in
dielectric constants. It is evident that the influence of changed porosity is more pronounced when
water occupies the pores. As shown in Figure 5, visible bedding planes must exceed at least 35%
porosity differences to obtain a high reflection coefficient to show sharp contact, as in the figure.
      Limestone rock mass has an average propagation velocity of ∼0.3 m/ns, while the water or air in
cracks between stratum contact surfaces have velocities of either 0.11 m/ns or 0.03 m/ns, thus giving
high velocity contrast [15]. High contrast, in the example, produces a good quality GPR radargram.
Radargram traces contain few phases of waves arrived on the receiver: first arrivals of reflected waves
passed only once through the medium, and secondary waves in the form of direct or refracted waves.
The special shape of the emitted pulse wave makes it possible to detect position within the reflected
signal, and it is used to determine zero ground level for ground-coupled antennas.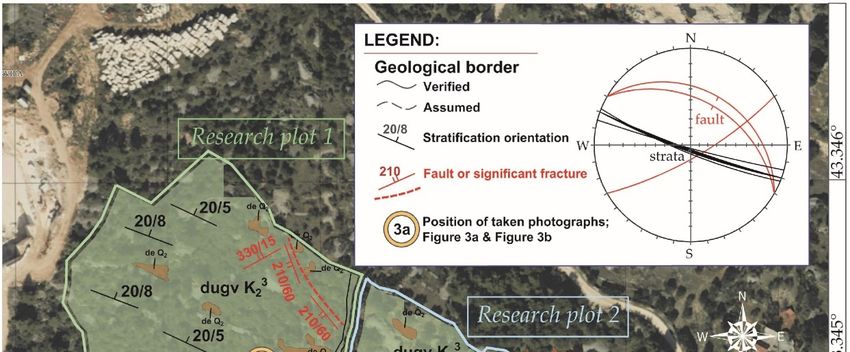
Geosciences 2020, 10, 112 7 of 15
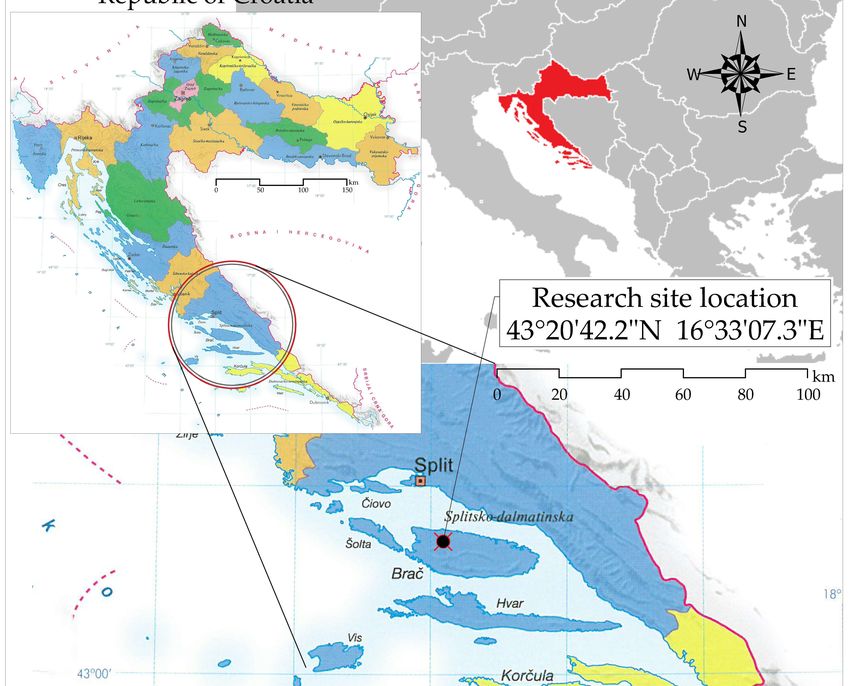
Figure 6 shows an example of a good quality GPR radargram, together with the corelating
photography and visible planes of stratum, parting as photographed on the neighboring open mine
artificial cutting line.
Geosciences 2020, 10, x FOR PEER 7 of 15
FigureFigure 6. Photographs
6. Photographs of stratum
of stratum boundaries
boundaries as seen
as seen onopen
on the the open
quarryquarry artificial
artificial cutting
cutting line, line,
together
together with the georadar (GPR) radargram recorded on the investigation site at the approximately
with the georadar (GPR) radargram recorded on the investigation site at the approximately same profile
same profile direction azimuth.
direction azimuth.
BasedBased on the presented results, georadar has been verified as a good-quality investigation
on the presented results, georadar has been verified as a good-quality investigation method
method for the designated purpose of assessing the acceptability of rock mass for the exploitation of
for the designated purpose of assessing the acceptability of rock mass for the exploitation of the
the architectural structural stone.
architectural structural stone.
3.2. Electrical Resistivity Tomography
3.2. Electrical Resistivity Tomography
The advantage of the 2D electrical resistivity method is its ability to study complex subsurface
The advantage
structures. It has aof theability
good 2D electrical
to detect resistivity
groundwatermethod
or, moreisimportantly,
its ability changes
to study incomplex subsurface
moisture content.
structures. It has a good ability to detect groundwater or, more importantly, changes
It is a relatively economical method, portable, and capable of imaging a kilometer-long single profile. in moisture
content. It is acontent
Moisture relatively economical
in rock method,
mass is a result portable,
of water and through
distribution capablefissures
of imaging a kilometer-long
and cracks, single
so the electrical
resistivity
profile. Moisture could be directly
content correlated
in rock mass istoathe rockof
result mass quality.
water The importance
distribution through of fissures
choosing andproper
cracks,
so themeasuring
electricalarrays is critical
resistivity for a be
could good interpretation
directly of theto
correlated subsurface
the rock[16].
massA Wenner
quality.array
Thewas used as of
importance
it has good vertical resolution. That is, horizontal anomalies could be detected with high resolution. Other
choosing proper measuring arrays is critical for a good interpretation of the subsurface [16]. A Wenner
options for resistivity imaging are dipole–dipole and Wenner–Schlumberger, pole-pole, etc. [17]. A GF
array was used as it has good vertical resolution. That is, horizontal anomalies could be detected with
Instruments, s.r.o ARES multielectrode resistivity imaging system with active multi-electrode cables was
high resolution. Other options for resistivity imaging are dipole–dipole and Wenner–Schlumberger,
used as an electrical resistivity imaging system on the site.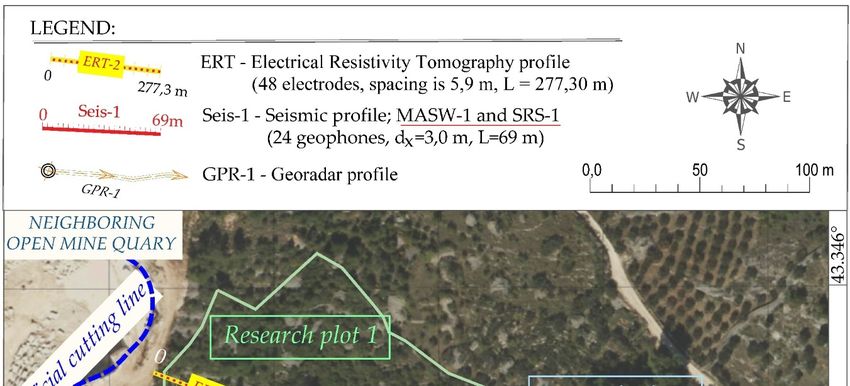
Geosciences 2020, 10, 112 8 of 15
pole-pole, etc. [17]. A GF Instruments, s.r.o ARES multielectrode resistivity imaging system with active
multi-electrode cables was used as an electrical resistivity imaging system on the site.
Geosciences 2020, 10, x FOR PEER 8 of 15
On site, two parallel ERT profiles were recorded, each with a length of 277.3 m, using a 48-electrode
array. Figure
On site,7 shows inverse
two parallel ERTmodel resistivity
profiles sectionseach
were recorded, of the twoa recorded
with length of ERT
277.3profiles.
m, usingCollected
a 48-
ERTelectrode
data on the array.
siteFigure
were 7interpreted
shows inverse model
using resistivity2-D
RES2DINV sections of thesoftware,
inversion two recorded ERT
which profiles.
uses the rapid
leastCollected
squares ERT data on
inversion the site to
method were interpreted
model using
the final RES2DINV
resistivity 2-D [18,19].
section inversion software, which uses
the rapid least squares inversion method to model the final resistivity section [18,19].
Figure
Figure 7. Inverse
7. Inverse model
model resistivity
resistivity sections
sections of profiles
of profiles ERT–1
ERT–1 and and ERT–2.
ERT–2. The The resistivity
resistivity scalescale is
is divided
divided according to the rock mass degree of weathering.
according to the rock mass degree of weathering.
On Onthethe basis
basis of of measuredelectrical
measured electricalresistivity
resistivity values
valuesatatthe
theERT
ERT profiles,
profiles,conclusions on the
conclusions on rock
the rock
quality were derived. According to resistivity ranges (Figure 7), three lithological rock mass types
quality were derived. According to resistivity ranges (Figure 7), three lithological rock mass types
could be differentiated. Lower electrical resistivity values, in the range of 500–2000 Ωm, correspond
could be differentiated. Lower electrical resistivity values, in the range of 500–2000 Ωm, correspond
to a highly weathered rock mass. Highly weathered rock mass is distributed along the profiles at
to a highly weathered rock mass. Highly weathered rock mass is distributed along the profiles at
shallow depths as a result of surface weathering processes (up to 5 m). Additionally, a very important
shallow
largedepths
area of as a result
highly of surface
weathered rockweathering
is visible onprocesses (up of
the west area to profile
5 m). Additionally,
ERT-1 (Figurea7). very
Theimportant
same
large area
area of highly
visible on theweathered
ERT profilerock is visibletoon
corresponds thethe west area
observed faultofonprofile ERT-1 (Figure
the engineering 7). The
geological mapsame
area(Figure
visible4).onThe
the electrical
ERT profile
resistivity profile reveals the real magnitude of the fault area, covering amap
corresponds to the observed fault on the engineering geological
(Figure
large4).part
Theofelectrical resistivity
the ERT profile. The profile
depth ofreveals the real magnitude
fault influence of the fault
on the rock quality area, covering
is registered as deepaaslarge
partisofvisible
the ERT
withprofile. The depth
the ERT profile of fault
resolution influence
depth. on the rock
This investigation areaquality is registered
is not suitable as deep as is
for architectural
structural
visible with thedimension blockresolution
ERT profile mining. Asdepth.
will be shown later, electrical
This investigation resistivity
area imaging will
is not suitable be a base
for architectural
for creating engineering geologic sectional profiles.
structural dimension block mining. As will be shown later, electrical resistivity imaging will be a base
for creating engineering geologic sectional profiles.
3.3. Seismic Profiling
3.3. Seismic
TheProfiling
construction of a seismic velocity model is a primary use of seismic profiling. Seismic wave
propagation velocities are influenced by internal rock mass conditions, that is, fluid saturation,
The construction of a seismic velocity model is a primary use of seismic profiling. Seismic wave
fissures, and crack distribution. Seismic velocity in rock formations also depends on mineral
propagation velocities are influenced by internal rock mass conditions, that is, fluid saturation, fissures,
composition, the granular nature of the rock matrix, cementation, porosity, fluid content and
and crack distribution. Seismic velocity in rock formations also depends on mineral composition, the
geological pressure, as well as geological age [20]. Both seismic velocities (Vp & Vs) are dependent
granular nature
on rock mass of the rock
density. matrix, cementation,
Relationships porosity,
between seismic fluidand
velocities content and geological
rock mass pressure,
densities have been as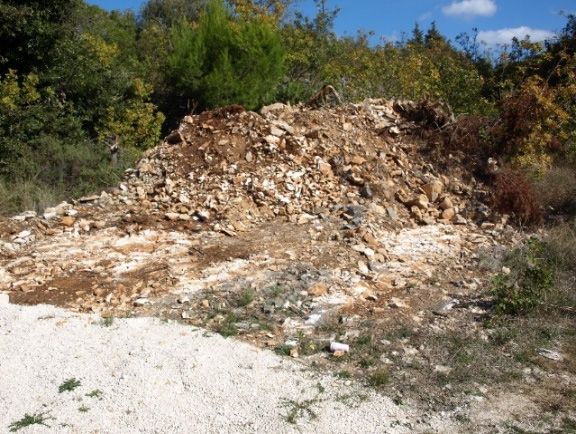
Geosciences 2020, 10, 112 9 of 15
well as geological age [20]. Both seismic velocities (Vp & Vs) are dependent on rock mass density.
Relationships between seismic velocities and rock mass densities have been established in the9literature
Geosciences 2020, 10, x FOR PEER of 15
through extensive laboratory and field experimentation [21,22]. Shear wave seismic velocity is directly
related to shearinmodulus
established at the
the literature small-strain
through deformation.
extensive Therefore,
laboratory and compressional[21,22].
field experimentation and shear
Shearwave
wave seismic
propagation velocity
velocity is directly
is the relatedof
direct result tostiffness
shear modulus
of the at the small-strain
medium deformation.
and/or damping Therefore,
profile [23].
compressional and shear wave propagation velocity is the direct result of stiffness of the medium
3.3.1. Shallow
and/or Refraction
damping profileSeismic
[23]. (SRS)
The Shallow
3.3.1. simplestRefraction
principleSeismic
for observing
(SRS) propagation velocity is to measure the delay time between
the seismic source and fixed receivers positioned in line. Refraction seismic profiling uses the travel
The simplest principle for observing propagation velocity is to measure the delay time between
time of active seismic impulses, the first arrivals of the wave refracted from the contact of the two media.
the seismic source and fixed receivers positioned in line. Refraction seismic profiling uses the travel
The precision of the impulse time arrivals is the precision of measurement, as well as the obtained
time of active seismic impulses, the first arrivals of the wave refracted from the contact of the two
seismic profile. Seismic refraction is applicable on soil with increasing seismic velocity profile with
media. The precision of the impulse time arrivals is the precision of measurement, as well as the
depth [24]. At
obtained the site,
seismic four shallow
profile. Seismic refraction
refraction isseismic (SRS)on
applicable profiles were
soil with recordedseismic
increasing with 24velocity
geophones
in line,
profile with depth [24]. At the site, four shallow refraction seismic (SRS) profiles were recorded withFirst
spaced 3 m. All the recordings were done using a Geometrics Inc., Geode seismograph.
time24arrivals
geophonesare picked
in line,from
spacedthe3recorded
m. All the seismographs.
recordings were Interpretation
done using awas done using
Geometrics Inc.,the Rayfract
Geode
2.63seismograph.
software pack—Intelligent
First time arrivalsResources
are pickedInc.
from the recorded seismographs. Interpretation was done
The stated
using condition
the Rayfract is necessary
2.63 software for the waveResources
pack—Intelligent to refractInc.on the contact surface of two materials.
With higherThe seismic
stated condition
velocity is necessary
contrast, for the
better wave toofrefract
detection on the plane
the contact contactissurface of two
obtained. materials.
Figure 8 displays
twoWith higher
seismic seismicprofiles
refraction velocityrecorded
contrast,atbetter detection
the site, showing of different
the contact plane is obtained.
weathering Figure
zone depths and8 rock
displays two seismic refraction profiles recorded at the site, showing different weathering
mass qualities. Geophysical properties of the weathering zone are defined according to classification of zone
the depths and rock mass qualities. Geophysical properties of the weathering zonethare defined
carbonate rock mass by Novosel [25]. Weathering zones corelate to the 4 and 5th rock according
categories,
to classification of the carbonate rock mass by Novosel [25]. Weathering zones corelate to the 4th and
with thgeophysical parameters ranging, for seismic waves, Vp = 900–2000 m/s, Vs = 400–1000 m/s, and
5 rock categories, with geophysical parameters ranging, for seismic waves, Vp = 900–2000 m/s, Vs =
for electrical resistivity 500–2000 Ωm.
400–1000 m/s, and for electrical resistivity 500–2000 Ωm.
(a)
(b)
Figure
Figure 8. Models
8. Models of of compressionalwave
compressional wave velocities
velocities (V
(Vpp),),interpreted
interpretedfrom
fromshallow refraction
shallow seismic
refraction seismic
(SRS).
(SRS). (a) (a) Deeper
Deeper weatheringzones
weathering zones could
could be
be observed
observedon onthe
thecentral
centralpart of of
part thethe
seismic profile
seismic profile
V p=2000–3500 m/s; (b) Refraction seismic profile, with rock quality layers following slope inclination
Vp =2000–3500 m/s; (b) Refraction seismic profile, with rock quality layers following slope inclination
andand bedrock
bedrock compressionalwave
compressional wavevelocity
velocity higher than VVpp=4500
higher than m/s.m/s.
= 4500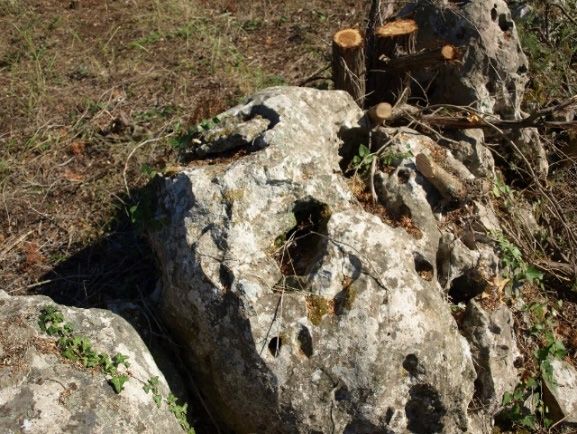
Geosciences 2020, 10, x FOR PEER 10 of 15
Geosciences 2020, 10, 112 10 of 15
3.3.2. Multichannel Analysis of Surface Waves (MASW)
The application of the multichannel analysis of surface waves (MASW) method was appropriate
3.3.2. Multichannel Analysis of Surface Waves (MASW)
for the measurement of shear wave velocities as an alternative to the shear-wave refraction method.
TheThe shear waveof
application refraction method does
the multichannel not work
analysis ofwell in noisy
surface areas.
waves It takes more
(MASW) methodtimewas
for data
appropriate
acquisition and requires excessive post-acquisition processing compared to the MASW method [23].
for the measurement of shear wave velocities as an alternative to the shear-wave refraction method.
Data acquisition for refraction and MASW seismic surveys were conducted along the same seismic
The shear wave
lines, refraction
utilizing method In
4.5 Hz geophones. does not work
common well in
stratigraphic noisy areas.
conditions, It takes
the surface wavemore time for data
propagation
acquisition and requires
is dominated excessive post-acquisition
by the fundamental mode. In cases with processing
a very strongcompared to thebetween
velocity contrast MASWlayers method [23].
Data acquisition for refraction
at shallow depths, and may
higher modes MASW seismic
be excited surveys
and may need were conducted
to be considered along the
in inversion same seismic
analyses
[26]. Profiles
lines, utilizing withgeophones.
4.5 Hz a gradual increase in shear wave
In common velocity with
stratigraphic depth are called
conditions, normallywave
the surface dispersive
propagation
profiles. Figure 9 shows the results of shear wave velocities at the position of profile Seis–1 from the
is dominated by the fundamental mode. In cases with a very strong velocity contrast between layers at
interpretation of the fundamental mode.
shallow depths, higherwave
The surface modes may be
profiles excited
(MASW) andmore
show may averaged
need to be considered
images than theinones
inversion analyses
obtained by [26].
Profilesshallow
with a refraction
gradual seismic
increase in shear
(SRS) wave
profiling. Thisvelocity
is due to with
the depth
fact that are called
two normally
methods dispersive
and their
profiles.propagation
Figure 9 shows the results
velocities of shear
are governed by wave velocities
different stiffnessat moduli:
the position of profile
longitudinal andSeis–1
shear.from the
Compressional
interpretation waves respondmode.
of the fundamental to the presence of pore fluids and saturation overall, while shear
waves’ response to these is negligible, for the reason that fluids do not have shear resistance.
(a)
(b)
Figure
Figure 9. 9. Shear
Shear wavewave velocity
velocity modelobtained
model obtained by
bythe
themultichannel
multichannel analysis of surface
analysis waves (MASW)
of surface waves (MASW)
seismic method. (a) Phase velocity curves with corresponding signal-to-noise curves on the left side
seismic method. (a) Phase velocity curves with corresponding signal-to-noise curves on the left side
and corresponding shear velocity 1D profile on the right side. (b) S-velocity model obtained using the
and corresponding
Seisimager CMPshear velocity
technique, OYO1DCorporation.
profile on the right side. (b) S-velocity model obtained using the
Seisimager CMP technique, OYO Corporation.
The surface wave profiles (MASW) show more averaged images than the ones obtained by shallow
refraction seismic (SRS) profiling. This is due to the fact that two methods and their propagation
velocities are governed by different stiffness moduli: longitudinal and shear. Compressional waves
respond to the presence of pore fluids and saturation overall, while shear waves’ response to these is
negligible, for the reason that fluids do not have shear resistance.
The MASW data were used to generate 2D shear wave velocity (Vs) profiles. Recorded seismograms
were processed by widely used MASW techniques for picking amplitude maxima in 2D spectralGeosciences 2020, 10, 112 11 of 15
representations of the wavefield [26]. The MASW 2D Vs profiles and the refraction SRS profiles
compared well in mapping the rock mass property that varies with changes in conditions such as crack
density. The results confirmed that the MASW method can be an alternative to the shallow seismic
refraction method when the near-surface conditions allow. It is good practice to discard traces with
lower values of signal-to-noise ratio.
Geosciences 2020, 10, x FOR PEER 11 of 15
4. Results The MASW data were used to generate 2D shear wave velocity (Vs) profiles. Recorded
seismograms were processed by widely used MASW techniques for picking amplitude maxima in
Comprehensive data were gathered at the investigation site, which were then used to distinguish
2D spectral representations of the wavefield [26]. The MASW 2D Vs profiles and the refraction SRS
parts of the terrain
profiles more or
compared less
well insuitable
mappingforthedimension stone mining.
rock mass property Based
that varies withon the obtained
changes geophysical
in conditions
data andsuch
engineering geological
as crack density. mapping,
The results two geological
confirmed sections
that the MASW withcan
method representations
be an alternativeoftorock
the quality
in three categories wererefraction
shallow seismic created.method when the near-surface conditions allow. It is good practice to
Thediscard
area on traces
the with lower values
geophysical of signal-to-noise
profile ratio. change in parameter gradient is considered
with the highest
to be a fault contact. If there is a sharp transition from a compact environment to a less compact one, a
4. Results
fault contact is assumed, since such a sharp transition cannot have a character other than a tectonic
Comprehensive data were gathered at the investigation site, which were then used to
one, especially in such a homogenous environment.
distinguish parts of the terrain more or less suitable for dimension stone mining. Based on the
Using the process
obtained showndata
geophysical in Figure 10, two engineering
and engineering geologicaltwo
geological mapping, cross-sections were created
geological sections with along
the mainrepresentations
geophysical lines ofquality
of rock ERT-1inand ERT-2
three profiles
categories wereand are shown in Figure 11. Derived categories
created.
in Figure 11 represent
The area ondecisive criteriaprofile
the geophysical for considering the acceptability
with the highest of rock
change in parameter mass is
gradient structural elements
considered
to be a faultof
for the extraction contact. If therestones
dimension is a sharp transition
[27]. from a compact
This criterion couldenvironment
also be usedto afor
lessquick
compact one,
assessment of
a fault contact is assumed, since such a sharp transition cannot have a character other than a tectonic
target areas in that region.
one, especially in such a homogenous environment.
Figure
Figure 10. The10. The process
process ofgeophysical
of the the geophysical profiles overlaying
profiles overlaying toto
create the the
create composite geophysical
composite data
geophysical data
needed to create the engineering geological profile. Boundary elements lines are shown on top of each
needed to create the engineering geological profile. Boundary elements lines are shown on top of each
geophysical profile to visually depict comparable zones between profiles. The top image is the
geophysical profile to visually depict comparable zones between profiles. The top image is the resulting
resulting engineering geological cross-section of the process.
engineering geological cross-section of the process.Using the process shown in Figure 10, two engineering geological cross-sections were created
along the main geophysical lines of ERT-1 and ERT-2 profiles and are shown in Figure 11. Derived
categories in Figure 11 represent decisive criteria for considering the acceptability of rock mass
structural elements for the extraction of dimension stones [27]. This criterion could also be used for
Geosciences 2020, 10, 112 12 of 15
quick assessment of target areas in that region.
Figure 11. Final engineering geological sections derived from the geophysical data along the
Figure 11. Final engineering geological sections derived from the geophysical data along the
investigation site. Rock mass quality regarding dimension block mining is represented in the table by
investigation site. Rock mass quality regarding dimension block mining is represented in the table by
three categories. For each rock mass category, values of geophysical parameters are defined.
three categories. For each rock mass category, values of geophysical parameters are defined.
5. Discussion
5. Discussion
Engineering geologic mapping from the surface of the terrain gives quality data about rock mass
Engineering
structural elements,geologic mapping from
like discontinuity the surface
systems’ of the terrain
orientations gives
and fault quality data
positions. about rock
However, they mass
could
structural
not provideelements, like discontinuity
decision-making systems’ orientations
details concerning and fault
deeper rock mass positions.
quality, However,
which was they
the main could
objective
not provide
of this decision-making
research. details concerning
Geological investigations often are deeper rock mass
accompanied quality, which
by exploratory was
drilling, the has
which mainits
objective of this research. Geological investigations often are accompanied by exploratory
drawbacks. Borehole investigations are expensive and long term. It is a kind of point test, so a lot ofdrilling,
which has its drawbacks.
small defects are missed byBorehole
drilling.investigations aregeophysical
This is why the expensive site
and investigation
long term. It was
is a used
kind on
of point
a case
study area.
In the applied geophysics, is well known that for assessing the adequacy of the geophysical
method, geophysical contrasts at the investigated site have to be understood. It is also important to
evaluate site characteristics, regarding the penetration depth and resolution of the geophysical method.
As well, it is also very important to calibrate acquired data by means of geological/geotechnical data.Geosciences 2020, 10, 112 13 of 15
The reported case study shows a successfully employed geophysical/geological investigation with the
purpose of determining the suitability of rock mass for dimension stone mining.
Radargrams are good visual aids to geological mapping, because georadar profiling reveals
bedding planes. Therefore, georadar results can be very useful in exploration of the architectural
structural stone.
Geoelectrical tomography has proven to be a very good method for detecting fault zones. Profile
ERT-1 revealed a wide and deep influence of faults on rock quality, thus revealing a part of terrain not
suitable for the designated purpose. The fault area detected by surface mapping is clearly visible on
the geoelectrical and seismic profiles, as depicted in Figures 7, 8a and 10. ERT profiles are also suitable
for the assessment of limestone rock quality. It was shown that electrical resistivity values in the range
of 500–3000 Ωm correspond to a highly to moderately weathered rock mass, which has questionable
properties for mining massive blocks.
Geophysical seismic investigations directly reflect rock mass mechanical properties. In general, a
lower seismic velocity indicates a very fragmented rock mass with poorer mechanical properties. Higher
seismic velocities indicate a solid rock mass which is more suitable for dimension stone exploitation.
Correlating the observed rock mass structural elements to the measured geophysical properties
resulted in a categorization of rock mass suitability for dimension block extraction. Parameters were
defined for each category as depicted in Figure 11. Rock mass of blocky, thick-bedded limestone,
in the investigated area of the island Brač, is suitable for architectural structural stone mining if in
general it has electrical resistivity higher than 3000 Ωm, seismic compressional wave velocity higher
than 3000 m/s and shear wave velocity higher than 1500 m/s. Lithological characterization is done
through geological surveys [28]. The defined parameters are key for the structural characterization of
the prospective dimension stone locations.
6. Conclusions
Dimension stone mining is important from the perspective of the island of Brač’s industry.
For the optimum results of dimension stone extraction, it is important to understand the physical
properties of the rock mass. Structural geological surveys give insight, with valuable data on the
orientation of bedding plains as well as their discontinuity geometry. The density of discontinuities and
local variations in rock quality govern decisions about site acceptability for the extraction of natural
dimension stones. As shown in this paper, this can be assessed by geophysical survey.
Borehole investigations are expensive, and, also, borehole patterns cannot economically be spaced
out to detect all discontinuities and fractures. Many small defects are missed by drilling.
Geophysical site investigations on a case study area resulted in rock mass categorization regarding
its acceptability for block extraction. The used geophysical methods and tests have been proven on the
site as useful tools for site characterization.
Electrical resistivity tomography revealed the extent of fault zones mapped from the surface.
Disturbed rock mass along the fault enables water infiltration through cracks and fissure systems,
which effectively changes electrical resistivity, thus producing good resistivity contrast. The electrical
resistivity method was used as the base information for producing engineering geologic section profiles.
Another advantage of electrical resistivity profiling is that profiles can also extend in a long line, so
a large area of terrain can be covered. Changes in electrical resistivity reflect even minor change in
moisture content due to small fissures inside monolithic blocks. It has been found that a limestone
rock mass with resistivity higher than 3000 Ωm is good for producing dimension stones.
Seismic refraction complements resistivity profiles and also directly reflects mechanical properties.
Resolution of shallow refraction seismic is high, contouring bedrock with great detail. The surface
wave profiles show more averaged velocity images, without the sharp boundaries of refraction profiles.
Georadar profiling only revealed bedding planes with widely parted stratification planes, and for
that reason it can be used as a good visual aid to geological mapping.Geosciences 2020, 10, 112 14 of 15
It is planned to verify the result of this investigation with structural geological boreholes at two
positions. The investigation result could then be calibrated to borehole logs, as well as the provisions
in this paper additionally acknowledged.
Author Contributions: Conceptualization, J.J.; Formal analysis, K.G.; Investigation, S.S.; Methodology, J.J.; Project
administration, S.S.; Validation, F.D.; Writing – original draft, K.G. All authors have read and agreed to the
published version of the manuscript.
Funding: The APC was funded by Faculty of Geotechnical Engineering, University of Zagreb, Hallerova aleja 7,
Varaždin (42000), Croatia.
Acknowledgments: Authors are very grateful to PhD Janislav Kapelj for assistance with engineering
geological mapping.
Conflicts of Interest: The authors declare no conflict of interest.
References
1. Crnković, B.; Jovičić, D. Dimension stone deposits in Croatia. Rudrasko-geološko-naftni zborik 1993, 5, 139–163.
2. Zhang, L. Estimating the Strength of Jointed Rock Masses. Rock Mech. Rock Eng. 2010, 43, 391–402. [CrossRef]
3. Gusić, I.; Jelaska, V. Stratigrafija Gornjokrednih Naslaga Otoka BRACA u Okivu Geodinamske Evolucije. Jadranske
Karbonatne Platforme; Jugoslavenska Akad. Znanosti Umjetnosti: Zagreb, Yugoslavia, 1990.
4. Kovačević, M.S.; Marčić, D.; Gazdek, M. Application of geophysical investigations in underground
engineering. Tech. Gaz. 2013, 20, 1111–1117.
5. Mosch, S.; Nikolayew, D.; Ewiak, O.; Siegesmund, S. Optimized extraction of dimension stone blocks.
Environ. Earth Sci. 2011, 63, 1911–1924. [CrossRef]
6. Ashmole, I.; Motloung, M. Dimension Stone: The Latest Trends In Exploration And Production Technology.
South. African Inst. Min. Metall. 2008, 1, 35–70.
7. Luodes, H.; Selonen, O.; Pääkkönen, K. Evaluation of dimension stone in gneissic rocks—A case history
from southern Finland. Eng. Geol. 2000, 58, 209–223. [CrossRef]
8. Lu, P.; Latham, J.-P. Developments in the Assessment of In-situ Block Size Distributions of Rock Masses.
Rock Mech. Rock Eng. 1999, 32, 29–49. [CrossRef]
9. Marinčić, S.; Korolija, B.; Majcen, Ž. Osnovna Geološka Karta SFRJ list Omiš, m 1:100000, K 33-22 [Base Geological
Map page Omiš]; Beograd: Institut za geološka istraživanja: Zagreb, Croatia, 1976.
10. Marinčić, S.; Korolija, B.; Mamužić, P.; Magaš, N.; Majcen, Ž.; Brkić, M.; Benček, Đ. Tumač za list Omiš K33-22;
Beograd: Institut za geološka istraživanja: Zagreb, Croatia, 1977; Volume 1, pp. 1–45.
11. Marković, S. Hrvatske mineralne sirovine, Mineral Resources in Croatia; Institut za geološka istraživanja, Zavod
za geologiju: Zagreb, Croatia, 2002; ISBN 953-6907-01-1.
12. ISRM. The Blue Book: “The Complete ISRM Suggested Methods for Rock Characterization, Testing and Monitoring:
1974-2006”; Ulusay, R., Hudson, J.A., Eds.; ISRM Turkish National Group: Ankara, Turkey, 2007; ISBN
978-975-93675-4-1.
13. Strelec, S.; Mesec, J.; Grabar, K.; Jug, J. Implementation of in-situ and geophysical investigation methods (ERT
& MASW) with the purpose to determine 2D profile of landslide. Acta Montan. Slovaca 2017, 22, 345–358.
14. Martinez, A.; Byrnes, A.P. Modeling dielectric-constant values of geologic materials: An aid to
ground-penetrating radar data collection and interpretation. Curr. Res. Earth Sci. 2001, 247, 1–16.
15. Musil, M.; Maurer, H.R.; Green, A.G. Discrete tomography and joint inversion for loosely connected or
unconnected physical properties: Application to crosshole seismic and georadar data sets. Geophys. J. Int.
2003, 153, 389–402. [CrossRef]
16. Pazzi, V.; Morelli, S.; Fanti, R. A Review of the Advantages and Limitations of Geophysical Investigations in
Landslide Studies. Int. J. Geophys. 2019, 2019, 1–27. [CrossRef]
17. Abdul, I.; Alwan, K. Comparison between Conventional Arrays in 2D Electrical Resistivity Imaging
Technique for Shallow Subsurface Structure Detection of the University of Technology. Eng. Technol. J. 2013,
31, 1817–1824.
18. Loke, M.H.; Barker, R.D. Rapid least-squares inversion of apparent resistivity pseudosections by a
quasi-Newton method1. Geophys. Prospect. 1996, 44, 131–152. [CrossRef]Geosciences 2020, 10, 112 15 of 15
19. Geotomo Software PLY LTD RES2DINVx64 ver 4.09, Software Manual; Rapid 2-D Resistivity & IP Inversion Using
the Least-Squares Method; Loke, M.H., Ed.; GeoTomo: Houston, TX, USA, 2019; pp. 1–137.
20. Gardner, G.H.F.; Gardner, L.W.; Gregory, A.R. Formation Velocity and Density—The Diagnostic Basics for
Stratigraphic Traps. Geophysics 1974, 39, 770–780. [CrossRef]
21. Miller, S.L.M.; Stewart, R.R. The relationship between elastic-wave velocities and density in sedimentary
rocks: A proposal. Crewes Res. Rep. 1974, 260–273.
22. Redpath, B.B. Seismic refraction exploration for engineering site investigations. U.S. Army Eng. Waterw. Exp.
Stn. 1973, 1–63.
23. Foti, S.; Lai, C.; Rix, G.J.; Strobbia, C. Surface Wave Methods for Near-Surface Site Characterization; CRC Press:
Boca Raton, FL, USA, 2014.
24. ASTM. Standard Guide for Using the Seismic Refraction Method for Subsurface, D5777-00; ASTM International:
West Conshohocken, PA, USA, 2011; pp. 1–14.
25. Novosel, T.; Tušar, Z.; Mulabdić, M.; Garašić, M.; Koražija, S. Rating of Slope Stability Built of Carbonate
Rocks. In Proceedings of the 5. Simpozij Jugoslavenskog Društva za Mehaniku Stijena i Podzemne Radove: Zbornik
Radova. Knj. 1; Simović, V., Ed.; Građevinski institut: Split, Croatia, 1980; pp. 185–192.
26. Foti, S.; Hollender, F.; Garofalo, F.; Albarello, D.; Asten, M.; Bard, P.-Y.; Comina, C.; Cornou, C.; Cox, B.; Di
Giulio, G.; et al. Guidelines for the good practice of surface wave analysis: a product of the InterPACIFIC
project. Bull. Earthq. Eng. 2018, 16, 2367–2420. [CrossRef]
27. Carvalho, J.F.; Henriques, P.; Falé, P.; Luís, G. Decision criteria for the exploration of ornamental-stone
deposits: Application to the marbles of the Portuguese Estremoz Anticline. Int. J. Rock Mech. Min. Sci. 2008,
45, 1306–1319. [CrossRef]
28. Hoffmann, A.; Siegesmund, S. Investigation of dimension stones in Thailand: an approach to a methodology
for the assessment of stone deposits. Zeitschrift der Dtsch. Gesellschaft für Geowissenschaften 2007, 158, 375–416.
[CrossRef]
© 2020 by the authors. Licensee MDPI, Basel, Switzerland. This article is an open access
article distributed under the terms and conditions of the Creative Commons Attribution
(CC BY) license (http://creativecommons.org/licenses/by/4.0/).You can also read