Seasonal Changes in the Intertidal and Subtidal Algal Communities of Extremely and Moderately Polluted Coastal Regions of Sanya Bay Hainan ...
←
→
Page content transcription
If your browser does not render page correctly, please read the page content below
Journal of
           Marine Science
           and Engineering

Article
Seasonal Changes in the Intertidal and Subtidal Algal
Communities of Extremely and Moderately Polluted
Coastal Regions of Sanya Bay (Hainan Island, China)
Eduard A. Titlyanov 1,2 , Tamara V. Titlyanova 1 , Hui Huang 2,3 , Anna V. Scriptsova 1 , Huili Xu 4
and Xiubao Li 4, *
 1    National Scientific Center of Marine Biology, Far Eastern Branch, Russian Academy of Science, A.V.
      Zhirmunsky Institute of Marine Biology, Palchevskogo 17, 690041 Vladivostok, Russia;
      etitlyanov@mail.ru (E.A.T.); titlyanova@inbox.ru (T.V.T.); askriptsova@mail.ru (A.V.S.)
 2    Key Laboratory of Tropical Marine Bio-resources and Ecology, South China Sea Institute of Oceanology,
      Chinese Academy of Sciences, 164 West Xingang Road, Guangzhou 510301, China; huanghui@scsio.ac.cn
 3    Tropical Marine Biological Research Station in Hainan, Chinese Academy of Sciences, Sanya 572000, China
 4    State Key Laboratory of Marine Resource Utilization in South China Sea, Ocean College, Hainan University,
      58th Renmin Road, Haikou 570228, China; huillixv@sina.com
 *    Correspondence: xiubaoli@hainanu.edu.cn; Tel.: +86-013-760-686-646

 Received: 1 March 2019; Accepted: 26 March 2019; Published: 3 April 2019

 Abstract: At the end of the rainy season in 2016 and at the end of the dry season in 2017, we conducted
 a floristic study of marine macrophytic algae in the intertidal and subtidal zones in moderately and
 heavily polluted areas at Luhuitou reef, Sanya Bay, Hainan Island, China. A total of 109 species of
 marine macrophytes were found during these samplings. At the end of the rainy season, 72 species of
 macrophytes (50% reds, 19% browns, and 31% greens) were found. At the end of the dry season, we
 found and identified 92 species of macrophytes (46% reds, 20% browns, and 34% greens). Seasonal
 changes in species diversity, species composition, and the structure of algal communities at differently
 polluted sites exhibited common features as well as specific characteristics. By the end of the dry
 season, the diversity of macroalgal species was increased, and the composition of dominant and
 accompanying species of macrophytes in polydominant communities was changed in moderately
 and heavily polluted areas. Seasonal changes in the marine flora of differently polluted areas were
 characterized by specific features as follows: Less changes in species diversity of heavily polluted
 area compared with moderately polluted area during the change from the rainy season to the dry
 season; significant increase in the biomass of green algae and their projective coverage in the middle
 and low intertidal zones of heavily polluted sites in the dry season; and the increase in the numbers
 of mono- and bidominant communities in the middle and low intertidal zones of heavily polluted
 sites by the end of the dry season.

 Keywords: Hainan Island; intertidal; macrophytic algae; seasonality; nutrients

1. Introduction
     Recent studies have shown that a number of natural and anthropogenic factors can cause
long-term changes in the subtropical-tropical marine flora, and those annual and seasonal changes may
be attributed to both abiotic and biotic environmental factors [1–4]. It is known that the greatest seasonal
subtropical-tropical floristic changes (especially in the intertidal zone) are caused by environmental
changes in terms of light intensity, temperature, salinity, rainfall, and wave action, but not the nutrient
concentration [4–13]. Seasonal changes (from dry to rainy periods) in the marine benthic flora in the

J. Mar. Sci. Eng. 2019, 7, 93; doi:10.3390/jmse7040093                               www.mdpi.com/journal/jmse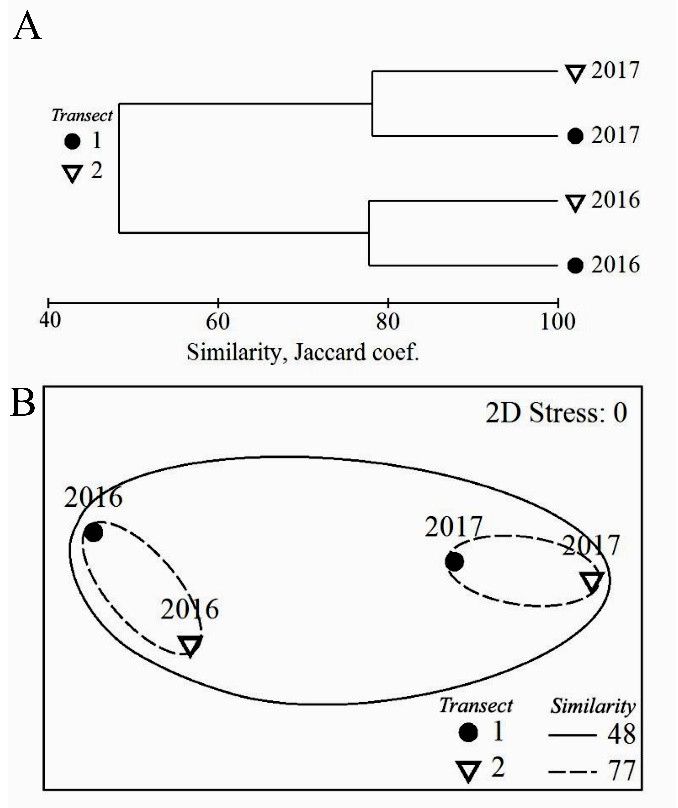
J. Mar. Sci. Eng. 2019, 7, 93                                                                       2 of 15

intertidal and upper subtidal zones of Sanya Bay along the coastline of Luhuitou Peninsula (Hainan
Island) have been studied in the recently published sister studies to this investigation [14–18].
     Previous studies [14–18] have shown that Sanya Bay is heavily polluted by dissolved inorganic
nitrogen (DIN), phosphates, and dissolved organic compounds due to the intensive discharge of
industrial wastewater from Sanya City into the bay as well as the wastes discharged from mariculture
farms into the coastal waters. The average concentration of DIN in seawater in 2008 to 2012 was 5 µM,
and that of orthophosphates (PO−3 4 ) was about 0.40 µM. Some coastal waters are catastrophically
polluted by organic wastes discharged from marine farms producing fish and invertebrate animals,
where the nutrient concentration exceeds on average 10 times or even hundreds the recommended
levels [18].
     Previous studies have reported that floristic ratios of the major algal groups are dramatically
changed between clean and nutrient-polluted regions [19–22].                Meanwhile, our previous
investigations [14,23] have revealed that macroalgal species’ diversity, composition, and their
seasonal shifts in Sanya Bay are likely similar to those of relatively clean, unpolluted regions of
the Indo-Pacific [24–26]. We have assumed that the average seawater pollution by dissolved forms of
nitrogen and phosphorus is not high enough to evoke serious changes in the marine flora of Sanya Bay.
In this connection, we have continued our investigations on the benthic flora in extremely polluted
coastal areas subjected to extensive discharge from fish farms [18]. We have shown that heavily
polluted areas are significantly different from moderately polluted areas in terms of the diversity of the
flora, species composition, taxonomic composition, and the structure of algal communities, suggesting
that extremely high concentrations of nutrients in seawater affect the succession of algal communities
and seasonal changes related with their formation. To validate such a hypothesis, we investigated the
marine flora in Sanya Bay at extremely and moderately polluted areas at the end of the rainy season in
2016 and the dry season in 2017.

2. Materials and Methods

2.1. Study Site, Time, and Conditions

2.1.1. Hainan Island
     Investigations were conducted at Luhuitou fringing reef, Sanya Bay, Hainan Island, China. Hainan
Island (Figure 1) is located in the subtropical northern periphery of the Indo-Pacific Ocean in the
South China Sea. According to the scheme of Briggs [27] on marine biogeographic regions, which was
modified by Lüning [28], Hainan Island belongs to the tropical region of the Northern hemisphere.
The 20 ◦ C sea surface temperature-winter isotherm and 25 ◦ C-summer isotherm fringe the tropical
region from the north. The rainy season in the southern part of the island occurs from May to October,
during which the precipitation accounts for 95% of the yearly rainfall, while the dry season occurs
from November to April [29].
     The main coastal ecosystems of the shallow water of Hainan Island are coral reefs, which are
among the most prominent fringing reefs of China. However, almost 80% of the fringing reefs along the
coastline of Hainan Island have been damaged due to intensive human activities during the 1970s to
1990s (fishing with dynamite, removal of corals for lime, and construction). Recently, the eutrophication
of Hainan coastal waters, particularly in the shallow gulfs, has been increased owing to greater
tourist numbers, hotel building along the coast, mariculture in coastal ponds, and pools with waste
draining into the sea [14,30–35]. The marine flora of Hainan Island is well studied, beginning from
1933 [14–16,23,36–45].
J. Mar. Sci. Eng. 2019, 7, 93 3 of 15
J. Mar. Sci. Eng. 2019, 7, 93 3 of 15
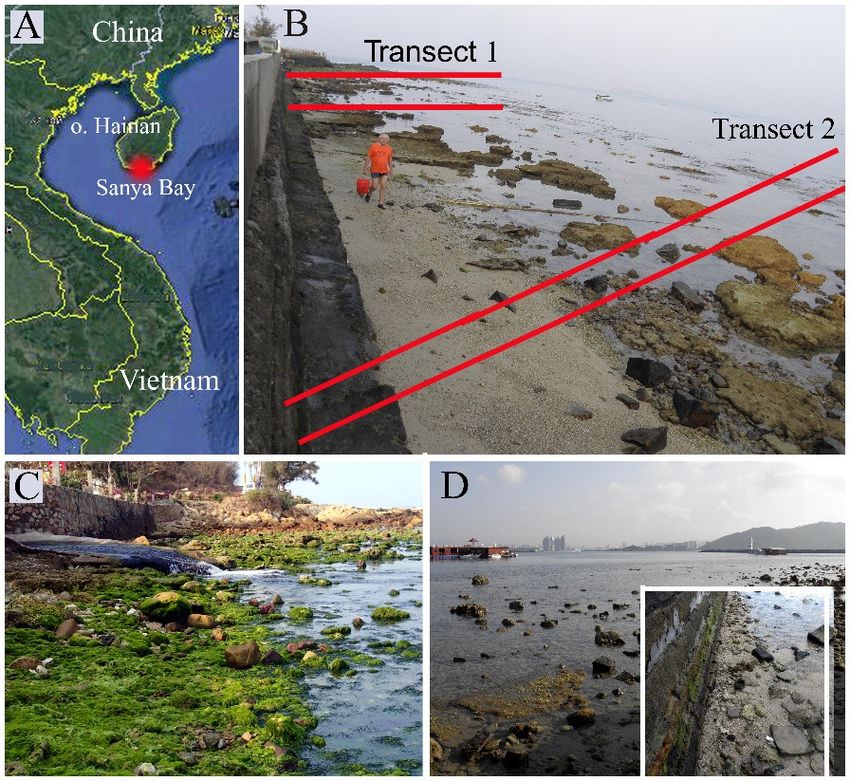
Figure
Figure 1. Study sites
1. Study sites in
in Hainan
Hainan Island: (A) Sanya
Island: (A) Sanya Bay;
Bay; (B)
(B) Luhuitou
Luhuitou Peninsula,
Peninsula, the
the situation
situation of
of
experimental transects. (C) Transect 1, opposite outlet of wastewater from a mariculture farm (ponds).
experimental transects. (C) Transect 1, opposite outlet of wastewater from a mariculture farm (ponds).
(D) Transect 2, opposite the Marine Biological Station.
(D) Transect 2, opposite the Marine Biological Station.
2.1.2. Time and Sites of Samplings
2.1.2. Time and Sites of Samplings
The algae were collected at the end of the rainy season in 2016 (November) and at the end of the
The algae
dry season were(March–April)
in 2017 collected at thefrom
end the
of the rainy
upper season in
intertidal to2016 (November)
the upper and
subtidal at the
zones atend
twoof the
sites:
dry season in 2017 (March–April) from the upper intertidal to the upper subtidal zones at two sites:
In front of the outlet of sewage discharges from land ponds where marine animals were cultivated
In front of the outlet of sewage discharges from land ponds where marine animals were cultivated
(heavily polluted site, transect 1) and in front of the Marine Biological Station of the South China Sea
(heavily polluted site, transect 1) and in front of the Marine Biological Station of the South China Sea
Institute of Oceanology (transect 2, moderately polluted) (Figure 1B–D).
Institute of Oceanology (transect 2, moderately polluted) (Figure 1B–D).
The aquaculture ponds in Luhuitou were firstly built in 2002 for abalone cultivation. Since
The aquaculture ponds in Luhuitou were firstly built in 2002 for abalone cultivation. Since 2007,
2007, the cultured species has been changed to crab. Then, in March 2012, they were replaced by a
the cultured species has been changed to crab. Then, in March 2012,2 they were replaced by a grouper
grouper fish farm. The grouper fish farm covers an area of ~3500 m . The volume of effluents directly
fish farm. The grouper fish farm covers an area of ~3500 m2. The volume of effluents directly
discharging into the surrounding waters of Luhuitou reef is about 4077 tons per year. According to
discharging into the surrounding waters of Luhuitou reef is about 4077 tons per year. According to
Li et al.’s [18] data obtained during the period from 2013 to 2016, the mean value of DIN, such as the
Li et al.’s [18] data obtained during the period from 2013 to 2016, the mean value of DIN, such as the
sum of NH4 , NO3 , and NO2 , is 185.9 µM, ranging from 37.5 to 714.2 µM at the outlet of the grouper
sum of NH4, NO3, and NO2, is 185.9 µM, ranging from 37.5 to 714.2 µM at the outlet of the grouper
farm. However, the value is significantly decreased to ~20 µM in the intertidal and upper subtidal
farm. However, the value is significantly decreased to ~20 µM in the intertidal and upper subtidal
waters opposite the outlet, and drops to ~9 µM in front of the Marine Biological Station. Phosphates
waters opposite the outlet, and drops to ~9 µM in front of the Marine Biological Station. Phosphates
are decreased from 10.2 µM at the outlet to 2.7 µM opposite the outlet and to 0.2 µM opposite the
are decreased from 10.2 µM at the outlet to 2.7 µM opposite the outlet and to 0.2 µM opposite the
Marine Biological Station. Dissolved organic carbon (DOC) also shows similar trends to DIN, and it is
Marine Biological Station. Dissolved organic carbon (DOC) also shows similar trends to DIN, and it
decreased from 525.5 µM at the outlet to 94.7 µM in front of the Marine Biological Station.
is decreased from 525.5 µM at the outlet to 94.7 µM in front of the Marine Biological Station.
At the sites investigated, the upper intertidal zone consisted of a sloping shore (2–3 m wide) with
At the sites investigated, the upper intertidal zone consisted of a sloping shore (2–3 m wide)
hard substrates composed of stones and dead coral fragments of various shapes and sizes, tossed
with hard substrates composed of stones and dead coral fragments of various shapes and sizes, tossed
about by storms. The sloping shore of the middle intertidal zone (~10 m wide) consisted mainly of flat
about by storms. The sloping shore of the middle intertidal zone (~10 m wide) consisted mainly of
carbonate patches intermixed with coral debris and stones. The lower intertidal zone (~15 m wide)
flat carbonate patches intermixed with coral debris and stones. The lower intertidal zone (~15 m wide)
was primarily composed of dead colonies of massive and branched corals intermixed with sand and
was primarily composed of dead colonies of massive and branched corals intermixed with sand and
small fragments of dead branching corals. The upper subtidal zone consisted of a sloping shore (~50 m
small fragments of dead branching corals. The upper subtidal zone consisted of a sloping shore (~50
wide), which was composed primarily of dead and live colonies of massive and branching corals
m wide), which was composed primarily of dead and live colonies of massive and branching corals
interspersed with sand, stones, and dead coral fragments of various shapes and sizes.
interspersed with sand, stones, and dead coral fragments of various shapes and sizes.
2.2. Collection, Conservation, and Identification of Marine AlgaeJ. Mar. Sci. Eng. 2019, 7, 93 4 of 15
2.2. Collection, Conservation, and Identification of Marine Algae
Algal sampling was carried out by foot or via snorkeling from 0 to 2 m depth (to 5 m with scuba
diving) during low and high tide along two transects (Figure 1B). Transect 1 from the outlet of the
fish farm was perpendicular to the shoreline (Figure 1B,C), and transect 2 was situated at a distance
of ~100 m (along shoreline) from the transect 1 (opposite the Marine Biological Station, Figure 1B,D).
Samples were extracted from all substrate types with more than five quadrats from each tidal zone.
In order to study the species composition of the benthic flora and the taxonomic composition of algal
communities, the method of algal sampling and the processing of the obtained material were as follows:
In each tidal zone, on an area of ~100 m2 , algal turf communities (with thalli less than 5 cm in
height), crust algae, and large upright growing algae (with thalli more than 5 cm in height) were visually
identified. The selected communities were photographed at a right angle. In the communities of algal
turf and crust algae, samples were taken from three randomly selected squares, each square measuring
~100 cm2 . In communities of upright growing algae, samples were also collected from three squares,
each ranging from 0.5 m2 to 1.0 m2 . Samples were extracted from all selected algal communities
not less than three quadrats from each community. Algae were also separately collected from areas
outside the selected squares. A total of 147 samples were obtained from algal turf communities and
communities of upright growing large algae (Table 1).
Table 1. Sampling location, number of samplings, samples, and found species.
Number of Found
Sampling Number of Number of Number of
Sampling Location and Analyzed Algal
Transects Samplings Samples Species
Communities
In front of the outlet,
2 2 22 66 85
heavily polluted
In front of the Marine
Biological Station, 2 2 27 81 103
moderately polluted
Total analyzed and found 4 4 49 147 109
The abundance was visually determined based on photographs of algae by estimating the mean
substrate surface area occupied by marine plants (relative percentage of coverage) using slides of
algal communities. The following indicators of the abundance were used: Exceedingly rare—found
only once or twice; rare sighting—found only one-two times with less than 5% relative coverage of
substrata; common—found in most samples with 5% to 20% relative coverage; and abundant—found
in communities with substrata coverage from 30% to 100%. Dominance in the communities was
also visually determined and defined as follows: Monodominant if one algal species occupied more
than 50% of the surface area; bidominant if two species occupied more than 50% of the surface area;
and polydominant if more than two species predominated.
Algae collected from different communities were stored in separate plastic bags, which were placed
in the refrigerator. Freshly collected material was identified using monographic publications, floristic
studies, and systematic articles indicated in Titlyanova et al. [44]. The systematics and nomenclature
followed Guiry and Guiry [46]. Hierarchical classification of the phylum, Rhodophyta, was assessed
according to Saunders and Hommersand [47]. The classification system of the phyla, Chlorophyta and
Ochrophyta, followed Tsuda [48,49]. The collections of both macrophytes and their epiphytes were
preserved as dried herbarium specimens and deposited in the herbarium at A.V. Zhirmunsky Institute
of Marine Biology, National Scientific Center of Marine Biology, Far Eastern Branch, Russian Academy
of Science, Vladivostok 690041, Russian Federation.
2.3. Statistical Analysis
Data were analyzed with the statistical package, Primer 6.1.12 (Plymouth UK: Primer–E Ltd.).
The similarity in species composition among samples collected at two transects in different tidal zones
in different years was analyzed by calculating the similarity coefficient of Jaccard, and similarity ofJ. Mar. Sci. Eng. 2019, 7, 93 5 of 15
vegetation among samples collected at differently polluted sites and in different seasons was analyzed
by calculating the Bray-Curtis similarity coefficient [50]. For graphical representation of the data set,
cluster analysis (group average method) and non-metric multidimensional scaling (nMDS) ordination
were carried out. The significance of differences in vegetation at different sites and between seasons
J. Mar. Sci. Eng. 2019, 7, 93 5 of 15
was tested using the one-way analysis of similarities (ANOSIM) [51].
of the data set, cluster analysis (group average method) and non-metric multidimensional scaling
3. Results
(nMDS) ordination were carried out. The significance of differences in vegetation at different sites
and between seasons was tested using the one-way analysis of similarities (ANOSIM) [51].
3.1. Algal Species Diversity, Taxonomic Composition and the Structure of Algal Communities in Heavily and
Moderately Polluted Areas at the End of the Rainy Season and at the End of the Dry Season
3. Results
Species 3.1. Algal Species
Diversity and Diversity,
TaxonomicTaxonomic Composition and the Structure of Algal Communities in Heavily
Composition
and Moderately Polluted Areas at the End of the Rainy Season and at the End of the Dry Season
A total of 109 species of marine macrophytes were found in the intertidal and subtidal zones of
Luhuitou Peninsula
Species Diversityduring the sampling
and Taxonomic process at the end of the rainy season in 2016 and at the end
Composition
of the dry season in 2017. Among the algae-macrophytes,
A total of 109 species of marine macrophytes were found 48%inofthethe speciesand
intertidal were red algae,
subtidal zones 20%
of were
brown algae, andPeninsula
Luhuitou 32% were green
during thealgae.
samplingTheprocess
sampled algae
at the end ofconsisted
the rainy mainly
season inof epilithic
2016 algae
and at the endgrowing
of the
on a hard dry season
substrate in 2017.
(73% Among
of the the algae-macrophytes,
species) and a smaller degree 48% of the
of species werealgae
epiphytic red algae, 20% Five
(27%). were species
brown algae,
were exceedingly andand
rare 32%found
were green algae.or
only once The sampled
twice. These algae
taxaconsisted mainly offrom
were excluded epilithic
the algae
quantitative
growing on a hard substrate (73% of the species) and a smaller degree of epiphytic algae (27%). Five
study (in Table S1, these species are marked with an asterisk after the species). The remaining rare,
species were exceedingly rare and found only once or twice. These taxa were excluded from the
common, and abundant
quantitative species
study (in Table were chosen
S1, these forare
species future study
marked with(Table S1). after the species). The
an asterisk
Clustering
remainingandrare,n-MDS
common,ordination
and abundant based on were
species floristic
chosensimilarity
for future(Jaccard coefficient)
study (Table S1). of collections
from extremely and moderately
Clustering pollutedbased
and n-MDS ordination areasonrevealed that seasonal
floristic similarity (Jaccardvariations
coefficient)ofof flora were larger
collections
than thefrom extremely
spatial ones.and Themoderately polluted areas
overall similarity revealed thatin
of collections seasonal
rainy variations of flora were
and dry seasons waslarger
48%, while
than the spatial ones. The overall similarity of collections in rainy and dry seasons was 48%, while
the similarity across transects in 2016, as well as in 2017, was 77% (Figure 2). The similarity values
the similarity across transects in 2016, as well as in 2017, was 77% (Figure 2). The similarity values
between dry and rainy seasons in extremely polluted area were 51% for Rhodophyta (Rh), 44% for
between dry and rainy seasons in extremely polluted area were 51% for Rhodophyta (Rh), 44% for
Chlorophyta (Ch), (Ch),
Chlorophyta and 53% for for
and 53% Ochrophyta
Ochrophyta(class Phaeophyceae,
(class Phaeophyceae, Ph),Ph), while
while the similarity
the similarity values in
values in
moderately polluted
moderately area area
polluted were 51%
were 51%forfor
Rh,
Rh,39%
39%for Ch,and
for Ch, and50%50% forfor
Ph.Ph.
Figure 2. Seasonal
Figure patterns
2. Seasonal of (A)of
patterns floristic similarity
(A) floristic and (B)
similarity andn-MDS of samples
(B) n-MDS collected
of samples at the
collected at end of
the rainy season
the end ofinthe
2016 andseason
rainy at the in
end of the
2016 anddry season
at the end of2017
theon two
dry transects:
season 1, heavily
2017 on pollution and
two transects:
2, moderate pollution
1, heavily in Luhuitou
pollution reef (Sanya
and 2, moderate Bay), in
pollution showing inter-annual
Luhuitou reef (Sanyachanges in species
Bay), showing inter-diversity.
The lowannual changes
stress value in species
indicated no diversity.
distortionThein thelow stress valueofindicated
compression no distortion in
the multidimensional theinto two
data
compression of the multidimensional data into two dimensions. The groups
dimensions. The groups derived from a parallel cluster analysis showed the respective maximum derived from
similarity boundary value. Similarity values shown in the key are percentages.J. Mar. Sci. Eng. 2019, 7, 93 6 of 15
J. Mar.aSci.
parallel cluster
Eng. 2019, analysis showed the respective maximum similarity boundary value.6 of 15
7, 93
Similarity values shown in the key are percentages.
During the transition period from the rainy season to the dry season, the absolute and relative
numbers
numbers of ofalgal
algalspecies
specieschanged
changed in in
thethe
marine
marinefloraflora
of the
ofstudied area. area.
the studied By theBy
endtheofend
the rainy
of theseason,
rainy
72 macrophyte
season, species (50%
72 macrophyte reds,(50%
species 19%reds,
browns,
19%and 31% greens)
browns, and 31%were found.were
greens) At this time,At
found. 17this
macrophyte
time, 17
species (or 24%
macrophyte of all collected
species (or 24% species) were abundant
of all collected species)andwere
prevailed in algal
abundant communities,
and prevailed in andalgal
the
proportions of red algae and green algae were 59% and 41%, respectively.
communities, and the proportions of red algae and green algae were 59% and 41%, respectively.
At the end of the dry season, 92 species of macroalgae (46% reds, 20% browns, and 34% greens)
were found, of which
which 31 31 species
species (or
(or 34%
34% ofof all
all collected
collected algae)
algae) dominated.
dominated. Among the dominant
macrophytes, there were 52% 52% reds,
reds, 19%
19% browns,
browns, and and 29%
29% greens.
greens.
During the transition period from the rainy season (2016) to the dry season (2017) in the heavily
polluted area, the number of red algae and especially green algae was increased by 5 and 10 species,
respectively, and the relative number
number of green algae algae was
was increased
increased byby 9%.
9%. At the same time, in the
moderately
moderately polluted
pollutedarea, thethe
area, absolute number
absolute of allof
number taxonomic groups groups
all taxonomic of macrophytes was increased
of macrophytes was
by 14 species in green algae, five species in brown algae, and three species in red algae.
increased by 14 species in green algae, five species in brown algae, and three species in red algae. The The relative
number of greenof
relative number algae
greenwas increased
algae by 11% (Figure
was increased by 11%3). (Figure 3).
Figure
Figure 3. Species composition
3. Species composition ofof algal
algal flora
flora in
in heavily
heavily polluted (1) and
polluted (1) and moderately
moderately polluted
polluted (2)
(2) areas
areas
during the rainy (2016) and dry (2017) seasons. (A) Number of species. (B) Proportions of Rhodophyta
during the rainy (2016) and dry (2017) seasons. (A) Number of species. (B) Proportions of Rhodophyta
(Rh);
(Rh); Ph,
Ph, Ochrophyta;
Ochrophyta; Ch,
Ch, Chlorophyta;
Chlorophyta; Cyan,
Cyan, Cyanobacteria.
Cyanobacteria.
In
In both
both seasons,
seasons, the the total
total number
number of of found
found species
species along
along thethe two
two transects
transects increased
increased from
from the
the
upper
upper to to lower
lowerintertidal
intertidalzoneszones(Figure
(Figure4).4).
The species
The number
species number increased
increasedfromfrom20 to20 62toduring the rainy
62 during the
season and from
rainy season and26 to 68
from 26during the drythe
to 68 during season (Figure(Figure
dry season 4A). With 4A).the increase
With of depth,
the increase ofthe species
depth, the
richness of red and brown algae also increased, and the numbers of green
species richness of red and brown algae also increased, and the numbers of green algae decreased in algae decreased in most
sampling
most sampling sites. sites.
Calculations
Calculationsof theofrelative numbers
the relative of different
numbers taxonomic
of different taxonomic groups
groupsshowed thatthat
showed the
relative number of green algae decreased with depth in all sites
the relative number of green algae decreased with depth in all sites (Figure 4B). (Figure 4B).
A
A number
number of of the
the algae
algae were
were season
season specific,
specific, occurring
occurring onlyonly during
during the the rainy
rainy (RS)
(RS) or
or dry
dry (DS)
(DS)
seasons, but many were also aseasonal, occurring during both seasons (Figure
seasons, but many were also aseasonal, occurring during both seasons (Figure 5). Of the 96 common 5). Of the 96 common
(++) andabundant
(++) and abundant(+++) (+++) macrophyte
macrophyte species
species (see(see
TableTable 1), 54%
1), 54% occurred
occurred duringduring
both both seasons,
seasons, 34%
34%
werewere specific
specific to onlyto only
the the
drydry season,
season, and and12%12% werespecific
were specifictotoonly
only the
the rainy
rainy season.
season. Seasonal
Seasonal
specificity
specificity occurred
occurred along
along bothboth transects.
transects. InIn the
the heavily
heavily polluted
polluted area,
area, 57%57% of of the
the common
common species
species
were
were for both seasons. However, in the moderately polluted area, this number was 51%, and those
for both seasons. However, in the moderately polluted area, this number was 51%, and those
species
species specific
specificto toonly
onlythe thedry
dryseason
seasonwaswas32%32%and and36%,
36%,respectively,
respectively, andand algae found
algae onlyonly
found during the
during
rainy season was 11% and 13%, respectively. The marine flora richness
the rainy season was 11% and 13%, respectively. The marine flora richness in the heavily polluted in the heavily polluted area
was
area higher than that
was higher thanin theinmoderately
that polluted
the moderately area with
polluted areaaseasonal species:
with aseasonal By 3%By
species: of 3%
red of
algae, 7% of
red algae,J. Mar. Sci. Eng. 2019, 7, 93 7 of 15
7% of brown algae, and 10% of green algae. At the same time, the richness was poorer in browns (by
15%)
J. Mar.and greens
Sci. Eng. 2019,(by
7, 936%), which were found only during the dry season (Figure 5). 7 of 15
J. Mar. Sci. Eng. 2019, 7, 93 7 of 15
brown algae, and 10% of green algae. At the same time, the richness was poorer in browns (by 15%)
7% of brown
and greens algae,
(by 6%), and 10%
which wereoffound
green algae. At the same
only during time,
the dry the richness
season was
(Figure 5).poorer in browns (by
15%) and greens (by 6%), which were found only during the dry season (Figure 5).
Figure 4. Species composition of algal flora in different tidal zones in extremely polluted (transect 1)
Figure
and 4. Speciespolluted
moderately composition of algal
(transect 2) flora
areasinduring
different
thetidal zones
rainy in extremely
(2016) polluted
and dry (2017) (transect
seasons. (A)1)
and Figure 4.
moderately Species composition
polluted (transect of algal
2) flora
areas in
duringdifferent
the tidal
rainy zones
(2016) in
and extremely
dry polluted
(2017)
Number of species. (B) Proportions of Rhodophyta (Rh), Ochrophyta (Ph), and Chlorophyta (Ch), (transect
seasons. (A) 1)
Number
and moderately
of species.
Cyanobacteria (Cyan).polluted
(B) ProportionsTidal (transect
of zones: (U)2)upper
Rhodophyta areas during the rainy
(Rh),interdidal;
Ochrophyta (2016)
(Ph),
(M) and dry (2017)
and Chlorophyta
middle intertidal; seasons.
(Ch),
(L) (A)
Cyanobacteria
lower intertidal;
Number
(Cyan). of species. (B) Proportions of Rhodophyta (Rh), Ochrophyta (Ph), and Chlorophyta (Ch),
(S) upperTidal zones: (U) upper interdidal; (M) middle intertidal; (L) lower intertidal; (S) upper subtidal.
subtidal.
Cyanobacteria (Cyan). Tidal zones: (U) upper interdidal; (M) middle intertidal; (L) lower intertidal;
(S) upper subtidal.
Figure 5. Composition of season-specific algal groups (found only during the rainy season, found
only during the dry season, and during both seasons) in the heavily polluted area; (A) and moderately
polluted area (B).J. Mar. Sci. Eng. 2019, 7, 93 8 of 15
3.2. The Structure of Algal Communities and Their Distribution in Tidal Zones
The structure of algal communities was analyzed according to the number and composition of
dominant and accompanying macrophyte species in every community as well as the relative bottom
coverage by the dominant species (Table S1).
3.2.1. The End of the Rainy Season
Heavily Polluted Area (Transect 1)
At the end of the rainy season in 2016, the upper intertidal zone along transect 1 (Figure 1C)
was mainly occupied by monodominant algal communities with a dominance of brown crust alga,
Neoralfsia expansa (Figure S1A), and turf-forming macrophytes, such as Polysiphonia howei (Rh) (Figure
S1B), Ulva prolifera (Ch) (Figure S1C), and Ulva clathrata (Ch) (Figure S1D). In this zone, shaded vertical
and inclined surfaces of rocky blocks were occupied by a bidominant community of the red alga,
Polysiphonia howei, and the green alga, Cladophoropsis sundanensis (Figure S1E). These communities
occupied less than 30% of the substrata.
In the middle intertidal zone, the stony bottom was occupied by a monodominant community
of the red crust alga, Hildenbrandia rubra (Figure S1F), and by the brown crust alga, Ralfsia verrucosa
(Figure S1G). The carbonate base of the reef and remnants of hard coral colonies were occupied by
algal turf communities, including the monodominant community of the red fine filamentous alga,
Centroceras clavulatum (Figure S1H), as well as the monodominant or bidominant communities of
the green algae, Ulva flexuosa and Cladophoropsis sundanensis, with accompanying species. All these
communities occupied no more than 50% of the hard substrata.
In the lower intertidal zone, the surfaces of dead coral blocks were overgrown by a bidominant
commumity of the turf-forming red algae, such as Centroceras clavulatum and Jania adhaerens (Figure S1I).
Out of the algal turf, Hypnea spinella (Rh), including Pseudochnoospora implexa, Sargassum aquifolium,
S. polycystum, and Turbinaria ornata (Ph), such as Caulerpa racemosa and Ulva rigida (Ch), were commonly
detected. Macrophytes occupied more than 90% of the hard substrata, and the other substrata were
occupied by individual colonies of hermatypic corals and other sessile animals.
In the upper subtidal zone as well as in the low intertidal zone, the algal community was
represented by algal turf with the dominance of Centroceras clavulatum and Jania adhaerens (Figure S1I)
with the same accompanying species as in the lower intertidal zone. Algal coverage of the hard
substrata in this zone was 80%.
Special interest was represented by the algal turf community formed in seawater with extremely
high concentrations of nutrients run out from fish farm via a concrete chute. The greater part
(in the middle) of the concrete chute was occupied by a dense monodominant community (~95%
coverage) of the red alga, Grateloupia filicina, overgrown with the epiphyte, Ceramium cimbricum, and the
accompanying green alga, Caulerpa sertularioides f. longiseta, forming mosaic coverage in the community.
A bidominant community of green algae, such as Trichosolen mucronatus and Ulva flexuosa (Figure S1J),
occupied marginal parts of the chute.
Moderately Polluted Area (Transect 2)
In autumn of 2016, the upper intertidal zone of the moderately polluted area (Figure 1D) was
occupied by the same monodominant communities as in the heavily polluted area (see above) as well
as the bidominant community of the red alga, Polysiphonia howei, and the green alga, Cladophoropsis
sundanensis. Algal coverage was no more than 10%.
In the middle intertidal zone, the stony bottom was occupied by mono-dominant communities of
crust algae, Hildenbrandia rubra and Ralfsia verrucosa, with coverage of about 20% (similar to transect 1).
The carbonate base of the reef and coral colonies were densely overgrown by a polydominant
community (~50% coverage) with dominant algae, such as Chondrophycus articulatus, Gelidium pusillum
var. cylindricum, Jania adhaerens, Millerella pannosa (Rh); Cladophora vagabunda, and Ulva clathrataJ. Mar. Sci. Eng. 2019, 7, 93 9 of 15
(Ch) (Figure S1K). Out of the algal turf community, Gelidium pusillum, Spyridia filamentosa (Rh), and
Feldmannia mitchelliae (Ph) were commonly detected.
In the lower intertidal zone, the surfaces of dead coral blocks were overgrown by a poly-dominant
community of turf-forming algae, such as Amphiroa fragilissima, Centroceras clavulatum, Jania adhaerens,
J. ungulata f. brevior, Spyridia filamentosa (Rh), Lobophora variegata (Ph), and Caulerpa racemosa (Ch)
(Figure S1L), with accompanying species of macrophytes and the blue-green alga, Lyngbya majuscula
(~50% coverage of the hard substrata). Out of the algal turf, Ceratodictyon spongiosum (Rh), Padina minor,
Sargassum aquifolium, S. sanyaense (young thalli), Turbinaria ornata (Ph), Caulerpa racemose, and Caulerpa
sertularioides (Ch) were commonly found. Rare coral colonies were met among algae.
In the upper subtidal zone, the main algal community was represented by algal turf overgrowing
dead coral colony blocks with a dominance of the same species as in the lower intertidal zone.
Among the accompanying species, Amphiroa foliacea (Figure S1M) and Sphacelaria novae-hollandiae
appeared, while Dictyota implexa, Gelidium pusillum var. cylindricum, and Ralfsia verrucosa were not
found. Here, coral colonies formed a patch-reef, occupying 30% of the bottom. The remaining parts
of the hard substrata were occupied by macrophytes. The rest of the hard substrata was overgrown
by macrophytes.
3.2.2. The End of the Dry Season
Heavily Polluted Area (Transect 1)
At the end of the dry season in 2017, the upper intertidal zone along transect 1 (Figure 1C) was
mainly occupied by the same monodominant and bidominant communities as in the rainy season
in 2016, occupying the same substrata. In this zone, shaded vertical and inclined surfaces of stony
blocks were overgrown by a bidominant turf community of Polysiphonia howei and Cladophoropsis
sundanensis. Out of the community, Centroceras clavulatum, Gelidium pusillum (Rh); Siphonogramen
abbreviatum, and Rhizoclonium riparium (Ch) were commonly found.
In the middle intertidal zone, the stony bottom (as in the autumn of 2016) was occupied by a
monodominant community of crust algae (see above) and the green alga, Ulva flexuosa (Figure S2A).
Here, the remaining parts of hard coral colonies covered with silt were occupied by a monodominant
community of the blue-greeen alga, Lyngbya majuscula (Figure S2B), and below the greater part of the
hard substratum was overgrown with a monodominant community of the green blade-like alga, Ulva
lactuca (Figure S2C).
In the lower intertidal zone, the surfaces of dead coral blocks were overgrown by a monodominant
community of the red turf-forming alga, Centroceras clavulatum (Figure S2D), with accompanying
species. This community occupied 90% of the substratum. Out of the algal turf, Acanthophora muscoides,
Hypnea pannosa, H. spinella, Spyridia filamentosa (Rh), Sargassum polycystum (Ph), Bryopsis pennata, Ulva
lactuca (Ch), and live colonies of massive hard corals were commonly found.
In the upper subtidal zone as well as in the lower intertidal zone, the main community was
represented by algal turf with a mosaic dominance of species, such as Centroceras clavulatum, Hypnea
pannosa, H. valentiae, Jania adhaerens (Rh), Caulerpa racemosa (Ch) and the blue-green alga, Lyngbya
majuscula. The green alga, C. racemose, grew on the remains of massive coral colonies covered with silt,
often overgrowing the community with the dominance C. clavulatum, and forming a monodominant
community (Figure S2E). Out of the algal turf community, large Sargassaceae (Sargassum polycystum,
S. sanyaense, and Turbinaria ornata) were commonly found.
The algal community growing in the middle part of the concrete chute in a flow run from a fish
farm was similar to that growing in the rainy season, and it was represented by a dense monodominant
community of the red alga, Grateloupia filicina, overgrown by the epiphyte, Ceramium cimbricum.
Caulerpa sertularioides f. longiseta and C. racemosa were the main accompanying species. A bidominant
community of the green algae, Trichosolen mucronatus and Ulva flexuosa, occupied marginal parts of
the chute.J. Mar. Sci. Eng. 2019, 7, 93 10 of 15
Moderately Polluted Area (Transect 2).
In 2017, monodominant communities similar to those of transect 1 occupied the upper intertidal
zone along transect 2 (Figure 1D). In the middle intertidal zone, a mosaic polydominant community was
the main one, which occupied mainly the flat carbonate reef bases with a dominance of the following
species: Centroceras clavulatum, Gelidiella bornetii, Palisada papillosa (Rh), and the blue-green alga, Lyngbya
majuscula (Figure S2F), and the accompanying species were represented by common species, such as
Acanthophora muscoides, Gelidium pusillum var. cylindricum (Rh), Colpomenia sinuosa, and Padina minor
(Ph). Vertical surfaces of reef bases and coral blocks were overgrown by a monodominant community
of Lobophora variegata (Ph). Monodominant communities of crust algae (the red alga, Hildenbrandia
rubra, and the brown alga, Ralfsia verrucosa) as well as in the rainy season occupied the stony bottom.
In the lower intertidal zone, a polydominant community of turf-forming algae overgrew on the
flat surfaces of dead coral blocks: Acanthophora spicifera, Amphiroa fragilissima, Centroceras clavulatum,
Spyridia filamentosa, Hypnea valentiae, Jania adhaerens (Rh), Padina minor (Ph), and Dictyosphaeria cavernosa
(Figure S2G). A monodominant community of the green alga, Caulerpa racemose, often overgrowing
a polydominant community of algal turf, occupied the hard substrata covered with silt and sand.
Upright growing brown algae with large thalli from the genera, Dictyota, Padina, Sargassum, and
Turbinaria, were commonly found in the communities and on free substrata.
Hard substrata in the upper subtidal zone were occupied by hermatypic corals with a coverage
of ~50% (Figure S2H), and the rest of the surface of the carbonate reef base was overgrown by algal
communities, primarily by polydominant mosaic algal turf communities with dominant species,
such as Centroceras clavulatum, Hypnea pannosa, H. valentiae, Jania adhaerens, and Spyridia filamentosa
(Figure S2I).
A monodominant community of the green alga, C. racemosa, occupied ~10% of the hard substratum
(coral reef base) covered with sand. Sargassum ilicifolium, S. polycystum, S. sanyaense, and Turbinaria
ornata formed a dense bed from the low intertidal zone to the upper subtidal zone (Figure S2J).
4. Discussion
4.1. Richness and Taxonomic Composition of the Marine Flora of Hainan Island
In our previous investigations on the marine flora of Hainan Island conducted during the dry and
rainy seasons of 2008 to 2012 at eight localities (three of these are located in Sanya Bay), we found 252
species, including 53% Rh, 16% Ph, and 31% Ch [23].
In the present work, we found that more than 50% of the macrophyte species were detected earlier
in Hainan. The axonomic composition of the algal collection in 2016 to 2017 (48% red algae, 20% brown
algae, and 32% green algae) was close to that found in 2008 to 2012. Three species, including Boodlea
coacta, Caulerpa sertularioides, and Siphonogramen abbreviatum (Ch), were new records for Hainan Island.
The main characteristics (taxonomic and ecological features) of the benthic flora in Sanya Bay
revealed in this study coincided with those found earlier for other localities of Hainan Island [23].
Special features of the macrophyte flora were the richness with the predominance of red algae (50–60%)
and green algae (25–35%), a clearly increasing gradient in species numbers from the upper to the lower
intertidal zone, predominance of monodominant and bidominant communities of the algal turf and
crust algae in the upper and the middle intertidal zones, and polydominant communities in the lower
intertidal and the upper subtidal zones.
In a previous study, we compared the benthic flora of Sanya Bay in heavily polluted sites (waste
from farms on the cultivation of marine animals) and moderately polluted areas at the end of the dry
season in 2014 [18]. We found that the macroalgal species richness was decreased from 71 species
in moderately polluted areas to 40 species in heavily polluted areas, while macroalgal biomass was
increased from 1.1 kg m2 to 1.58 kg m2 , mainly by the blooming of green algae in the middle (Ulva spp.)
and lower intertidal zones (Caulerpa racemosa) as well as brown algae in the upper subtidal zone.J. Mar. Sci. Eng. 2019, 7, 93 11 of 15
In the investigations conducted at the end of the dry season in 2017 at the same sites as in 2014,
we confirmed the data of 2014, such as the impoverishment of marine flora in heavily polluted areas at
the expense of all macrophyte groups by a significant increase in biomass and the projective coverage
of the substratum with green algae (green bloom). We also showed that the benthic flora in heavily
and moderately polluted areas were close to each other in terms of species composition and the
structure of algal communities. The greatest differences in species composition and the structure
of algal communities between heavily and moderately polluted areas were observed in the middle
intertidal zone.
4.2. Seasonal Changes in the Benthic Flora in Rainy and Dry Seasons
Seasonal changes in species diversity and the structure of algal communities in shallow Sanya Bay
were investigated earlier [15,16], and these changes were confirmed by our recent study performed in
heavily and moderately polluted areas. Overall, species numbers were increased from the rainy to the
dry seasons from the upper to the lower intertidal zones. Different monodominant or bidominant algal
turf communities and crust algae with occasional accompanying algae protruding through the turf
occupied the upper intertidal zone in shallow Sanya Bay. This zone was occupied by dominant species
capable of enduring or quickly recovering under the extremely erratic environmental conditions.
In the middle intertidal zone, a greater diversity of ephemeral red and green algae was detected,
particularly during the dry season. This zone was richer than the previous one, both by species
and communities, which might be attributed to the more comfortable conditions of their existence
compared with the upper intertidal zone. Algae were exposed to air at low tide for shorter time,
and the substratum covered with silt and sandy sediments insulated the algae and their spores from
any adverse conditions. There were marked clear seasonal changes in the flora: More than twice the
numbers of species were found during the dry seasons compared with the rainy seasons, the species
composition of mono- and bidominant communities was also changed, and polydominant algal turf
communities that were absent in the upper intertidal zone were formed. In this zone, mono- and
bidominant communities of crust and turf-forming algae dominated throughout the year, the number
of which was increased in the dry season. During the dry seasons, green and blue-green algae were the
most diverse and dominant in communities. We assumed that green, blue-green, and red opportunistic
algae in the upper and the middle intertidal zones thrived during the dry season due to their tolerance to
drought and the absence of competition for space with other algae under these extreme conditions [52].
Primarily polydominant algal turf communities, and mono- and bidominant communities of
upright-growing brown algae dominated in the lower intertidal zone; red and brown algae were
mainly aseasonal annuals and perennials. Seasonal changes in the flora of benthic algae appeared to
increase the species diversity of macrophytes in the dry season and in the change of dominant species
in algal turf communities.
The upper subtidal communities were characterized by a mosaic polydominant algal turf
community and by a bidominant community of Sargassum species. In the polydominant community,
seasonal changes in dominant species occurred mainly among annual fleshy, calcareous articulated
and leathery forms. It was considered that these changes were caused by periodic annual changes
in the community due to thallus detachment from hard substrata, and the formation of new algal
communities [45].
Therefore, we, for the first time, revealed that seasonal changes in the benthic flora of Sanya Bay
occurred at sites with moderate pollution, as well as at sites with extreme pollution by nutrients. Some
of the changes did not depend on the level of pollution. Such changes included: (1) The increase
in species diversity of macrophytes at the end of the dry season; (2) changes in the composition of
dominant and accompanying species of macrophytes in polydominant communities in the succession
process of algal turf during the transition from one season to another. These seasonal changes in the
species diversity of macrophytes in the intertidal zones appeared to be caused by high temperatures
during the dry season and by seawater desalinization and frequent storms during the rainy season.J. Mar. Sci. Eng. 2019, 7, 93 12 of 15
It is known that these extreme factors lead to a decrease in production and the disappearance of
nonresistant algae [9,28], and provide open space for ephemeral, opportunistic, and highly productive
algae [51]. In our opinion, the dominance of green algae in the upper intertidal zone, primarily seasonal
ephemerals, seemed to be caused by their ability to endure or quickly recover from the extremely
erratic environmental conditions. In the middle intertidal zone, a greater diversity of ephemeral
red and green algae was detected, particularly during the dry season. In this zone, mud and sand
frequently covered the algae and their spores, insulating them from any adverse conditions. The low
intertidal and upper subtidal zones were dominated primarily by red and brown algae that were mainly
aseasonal annuals and perennials. Their occurrence and succession patterns were affected by the more
stable environmental conditions and predictable annual changes in the overall flora. In this zone,
seasonal changes in the flora occurred mainly by the change in the dominant species of these algal turf
communities, but not by changes in the species composition of polydominant turf communities. These
changes occurred in the succession process of the communities and mostly depended on such internal
factors as the length of the life cycle of algal species comprising the community, their productivity,
and competitive abilities.
Specific features of the seasonal changes in the marine flora of differently polluted areas were
as follows: (1) A smaller change in species diversity in the heavily polluted area compared with the
moderately polluted area during the transition from the rainy to dry seasons; (2) multiple increases in
biomass and projective coverage of substrata with green algae in the middle and lower intertidal zones
of heavily polluted areas by the end of the dry season; (3) an increase in the number of mono- and
bidominant communities in the middle and lower intertidal zones of heavily polluted areas by the end
of the dry season.
We assumed that the reason for these specific changes could be attributed to the influence of
different nutrient concentrations on the competitive abilities of species during the succession process
of algal turf [52]. Under extremely high concentrations of nutrients, mono-, bi- or polydominant
communities are formed with less numbers of dominant and accompanying species (in comparison
with common conditions) that determined the specific features of seasonal changes in the marine flora
of extremely polluted areas.
5. Conclusions
We, for the first time, showed the effects of extremely high levels of pollution of dissolved
inorganic compounds of nitrogen and phosphorus on the seasonal changes of the benthic marine flora
of coral reefs. The constant influence of extremely high concentrations of nutrients in seawater led
not only to a decrease in species diversity (impoverishment of the flora) and changes in the structure
of communities (formation of mono- and bidominant algal turf communities), but also to seasonal
changes in the marine flora. Specific features of seasonal changes in the flora of heavily polluted
sites were: Low level of species abundance during the dry season; multiple increases in biomass and
projective coverage of substrata with green algae in the dry season; an increase in the number of mono-
and bidominant communities in the middle and lower intertidal zones by the end of the dry season.
Supplementary Materials: The following are available online at http://www.mdpi.com/2077-1312/7/4/93/s1,
Figure S1: Algal communities in Luhuitou reef in rainy season 2016, Figure S2: Algal communities at Luhuitou
reef in the dry season 2017, Table S1: List of the seaweeds of Luhuitou, sampled in November 2016 and in
March–April 2017.
Author Contributions: E.A.T. and X.L. conceived and designed the experiments; E.A.T., T.V.T., A.V.S., H.X. and
X.L. performed the experiments, E.A.T., T.V.T. and X.L. performed the data analysis, and drafted the manuscript;
H.H. and X.L. supervised the project. All the authors reviewed and approved the final manuscript.
Funding: This work was financially supported by the National Natural Science Foundation of China (41476134),
the Open Project of State Key Laboratory of Marine Resource Utilization in South China Sea (DX2017003),
the Foundation of Hainan University (KYQD(ZR)1805) and the grant ‘China–Russia special funds 2018’ from the
Chinese Academy of Sciences.
Conflicts of Interest: The authors declare no conflict of interest.J. Mar. Sci. Eng. 2019, 7, 93 13 of 15
References
1. Fong, P.; Zedler, J.B. Temperature and light effects on the seasonal succession of algal communities in shallow
coastal ecosystems. J. Exp. Mar. Biol. Ecol. 1993, 171, 259–272. [CrossRef]
2. Kennish, R. Diet composition influences the fitness of the herbivorous crab Grapsus albolineatus. Oecologia
1996, 105, 22–29. [CrossRef] [PubMed]
3. Pedersen, M.F.; Borum, J. Nutrient control of estuarine macroalgae: Growth strategy and the balance between
nitrogen requirements and uptake. Mar. Ecol. Prog. Ser. 1996, 161, 155–163. [CrossRef]
4. Su, S.W.; Chung, I.C.; Lee, T.M. Temporal dynamics of rockyshore macroalgal assemblage structures in
relation to coastal construction threats in Orchard Island (Taiwan): Impacts of turbidity and nutrients on the
blooms of Galaxaura oblongata and a red alga-spongesymbiose Ceratodictyon/Haliclona. Kuroshio Sci. 2009, 3,
63–80.
5. Lopez Gappa, J.; Tablado, A.; Magaldi, N.H. Seasonal changes in an intertidal community affected by sewage
pollution. Environ. Pollut. 1993, 82, 157–165. [CrossRef]
6. Costa, O.S., Jr.; Zman, L.; Nimmo, M.; Attrill, M.J. Nitrification impacts on coral reefs from northern Bahia,
Brazil. Hydrobiologia 2000, 440, 307–315. [CrossRef]
7. Costa, O.S., Jr.; Attrilla, M.J.; Pedrinib, A.G.; De-Paulab, J.C. Spatial and seasonal distribution of seaweeds on
coral reefs from southern Bahia, Brazil. Bot. Mar. 2002, 45, 346–355. [CrossRef]
8. Mayakun, J.; Prathep, A. Seasonal variations in diversity and abundance of macroalgae at Samui Island,
Surat Thani Province, Thailand Songklanakarin. J. Sci. Technol. 2005, 27, 653–663.
9. Ateweberhan, M.; Bruggemann, J.H.; Breeman, A.M. Effects of extreme seasonality on community structure
and functional group dynamics of coral reef algae in the southern Red Sea (Eritrea). Coral Reefs 2006, 25,
391–406. [CrossRef]
10. García, C.B.; Díaz-Pulido, G. Dynamics of a macroalgal rocky intertidal community in the Colombian
Caribbean. Bol. Investig. Mar. Cost. 2006, 35, 7–18. [CrossRef]
11. Lirman, D.; Deangelo, G.; Serafy, J.; Hazra, A.; Hazra Smith, D.; Herlan, J.; Luo, J.; Bellmund, S.; Wang, J.;
Clausing, R. Seasonal changes in the abundance and distribution of submerged aquatic vegetation in a highly
managed coastal lagoon. Hydrobiologia 2008, 596, 105–120. [CrossRef]
12. Thakur, M.C.; Reddy, C.R.K.; Jha, B. Seasonal variation in biomass and species composition of seaweeds
stranded along Port Okha, northwest coast of India. J. Earth Syst. Sci. 2008, 117, 211–218. [CrossRef]
13. Maraşlıoğlu, F.; Soylu, E.N.; Karaca, S.A. Seasonal and spatial variation of epilithic algal community in
Batlama Stream (Giresun, Turkey). Hittite J. Sci. Eng. 2017, 4, 39–44. [CrossRef]
14. Titlyanov, E.A.; Kiyashko, S.I.; Titlyanova, T.V.; Yakovleva, I.M.; Li, X.B.; Huang, H. Nitrogen sources to
macroalgal growth in Sanya Bay (Hainan Island, China). Curr. Dev. Oceanogr. 2011, 2, 65–84.
15. Titlyanov, E.A.; Titlyanova, T.V.; Huang, H.; Li, X. Seasonal changes in benthic algal communities of the
upper subtidal zone in Sanya Bay (Hainan Island, China). J. Mar. Biol. Assoc. UK 2013, 94, 51–64. [CrossRef]
16. Titlyanov, E.A.; Titlyanova, T.V.; Li, X.B.; Hansen, G.I.; Huang, H. Seasonal changes in the intertidal algal
communities of Sanya Bay (Hainan Island, China). J. Mar. Biol. Assoc. UK 2014, 94, 879–893. [CrossRef]
17. Huang, H.; Li, X.B.; Titlyanov, E.A.; Ye, C.; Titlyanova, T.V.; Guo, P.Y.; Zhang, J. Linking macroalgal δ15
N-values to nitrogen sources and effects of nutrient stress on coral condition in an upwelling region. Bot. Mar.
2013, 56, 471–480. [CrossRef]
18. Li, X.B.; Titlyanov, E.A.; Zhang, J.; Titlyanova, T.V.; Zhang, G.; Huang, H. Macroalgal assemblage changes on
coral reefs along a natural gradient from fish farms in southern Hainan Island Aquatic. Ecosyst. Health Manag.
2016, 19, 74–82. [CrossRef]
19. Morand, P.; Briand, X. Excessive growth of macroalgae: A symptom of environmental disturbance. Bot. Mar.
1996, 39, 491–516. [CrossRef]
20. Morand, P.; Merceron, M. Coastal eutrophication and excessive growth of macroalgae. Recent Res. Dev.
Environ. Biol. 2004, 1, 395–449.
21. Lapointe, B.E.; Barile, P.J.; Littler, M.M.; Littler, D.S.; Bedford, B.J.; Gasque, C. Macroalgal blooms on southeast
Florida coral reefs: I. Nutrient stoichiometry of the invasive green alga Codium isthmocladum in the wider
Caribbean indicates nutrient enrichment. Harmful Algae 2005, 4, 1092–1105. [CrossRef]J. Mar. Sci. Eng. 2019, 7, 93 14 of 15
22. Lapointe, B.E.; Barile, P.J.; Littler, M.M.; Littler, D.S. Macroalgal blooms on southeast Florida coral reefs:
II. Cross-shelf discrimination of nitrogen sources indicates widespread assimilation of sewage nitrogen.
Harmful Algae 2005, 4, 1106–1122. [CrossRef]
23. Titlyanov, E.A.; Titlyanova, T.V.; Li, X.B.; Huang, H. An inventory of marine benthic macroalgae of Hainan
Island, China. Russ. J. Mar. Biol. 2018, 44, 175–184. [CrossRef]
24. Furnas, M.; Mitchell, A.; Skuza, M. Shelf-scale nitrogen and phosphorus budgets for the central Great Barrier
Reef (16◦ −19◦ S). In Proceedings of the 8th International Coral Reef Symposium, Balboa, Panama, 24–29 June
1997; Volume 1, pp. 809–814.
25. Charpy, L.; Charpy-Roubaud, C.; Buat, P. Excess primary production, calcification and nutrient fluxes of
a patch reef (Tikehau atoll, French Polynesia). Mar. Ecol. Prog. Ser. 1998, 173, 139–147. [CrossRef]
26. Charpy-Roubaud, C.J.; Charpy, L. Nutrients, particulate organic matter, and planktonic and benthic
production of the Tikehau Atoll (Tuamotu Archipelago French Polynesia). Atoll Res. Bull. 1994, 415–425,
1–30. [CrossRef]
27. Briggs, J.C. Marine Zoogeography; McGraw-Hill: New York, NY, USA, 1974; 475p.
28. Lüning, K. Seaweeds: Their Environment, Biogeography and Ecophysiology; John Wiley & Sons, Inc.: New York,
NY, USA; Chichester, UK; Brisbane, Australia; Toronto, ON, Canada; Singapore, 1990; 527p.
29. Li, X.B. Identification of Major Factors Influencing the Composition, Spatial and Temporal Variation of
Scleractinian Coral Community in Sanya, China. Ph.D. Thesis, Chinese Academy of Sciences, Beijing, China,
2011; pp. 1–107. (In Chinese)
30. Hutchings, P.A.; Wu, B.L. Coral reefs of Hainan Island, South China Sea. Mar. Pollut. Bull. 1987, 18, 25–26.
[CrossRef]
31. Fiege, D.; Neumann, V.; Jinhe, L. Observations on coral reefs of Hainan Island, South China Sea.
Mar. Pollut. Bull. 1994, 29, 84–89. [CrossRef]
32. Zhang, Q.; Xu, X.Z.; Long, X.M. A numerical study on internal tides in the northeast of the South China Sea.
J. Trop. Oceanol. 1996, 14, 15–23.
33. Hodgson, G.; Yau, E.P.M. Physical and biological controls of coral communities in Hong Kong. In Proceedings
of the 8th International Coral Reef Symposium; Lessios, H.A., Macintyre, I.G., Eds.; Tropical Research
Institute: Balboa, Panama, 1997; Volume 1, pp. 459–464.
34. Zhang, G.; Que, H.; Liu, X.; Xu, H. Abalone mariculture in China. J. Shellfish Res. 2004, 23, 947–950.
35. Tadashi, K.; Dai, C.F.; Park, H.-S.; Huang, H.; Ang, P.O. Status of coral reefs in East and North Asia (China,
Hong Kong, Taiwan, South Korea and Japan. In Status of Coral Reefs of the World; Wilkinson, C., Ed.; Global
Coral Reef Monitoring: Townsville, Australia, 2008; pp. 145–158.
36. Tseng, C.K. Common Seaweeds of China; Science Press Book: Beijing, China, 1983; 316p.
37. Tseng, C.K. The past, present and future of phycology in China. Hydrobiologia 2004, 512, 11–20. [CrossRef]
38. Titlyanov, E.A.; Titlyanova, T.V.; Xia, B.M.; Bartsch, I. Checklist of marine benthic green algae (Chlorophyta)
on Hainan, a subtropical island off the coast of China: Comparisons between the 1930s and 1990–2009 reveal
environmental changes. Bot. Mar. 2011, 54, 523–535. [CrossRef]
39. Titlyanov, E.A.; Titlyanova, T.V.; Belous, O.S.; Kalita, T.L. Inventory change (1990s–2010s) in the marine flora
of Sanya Bay (Hainan Island, China). J. Mar. Biol. Assoc. UK 2015, 95, 461–470. [CrossRef]
40. Titlyanov, E.A.; Titlyanova, T.V.; Li, X.; Huang, H. Recent (2008–2012) seaweed flora of Hainan Island, South
China Sea. Mar. Biol. Res. 2015, 11, 540–550. [CrossRef]
41. Titlyanov, E.A.; Titlyanova, T.V.; Xia, B.M.; Bartsch, I. Retrospective analysis of diversity and species
composition of marine macroalgae of Hainan Island (China). Ocean Sci. 2016, 51, 485–506. [CrossRef]
42. Titlyanov, E.A.; Titlyanova, T.V.; Li, X.B.; Huang, H. Coral Reef Marine Plants of Hainan/Island; Academic Press:
Amsterdam, The Netherlands, 2016; p. 243.
43. Titlyanova, T.V.; Titlyanov, E.A.; Xia, B.; Bartsch, I. New records of benthic marine green algae (Chlorophyta)
for the island of Hainan, China. Nova Hedwig. 2012, 94, 441–470. [CrossRef] [PubMed]
44. Titlyanova, T.V.; Titlyanov, E.A.; Kalita, T.L. Marine algal flora of Hainan Island: A comprehensive synthesis.
Coast. Ecosyst. 2014, 1, 28–53.
45. Titlyanov, E.A.; Titlyanova, T.V. Changes in the species composition of benthic macroalgal communities
of the upper subtidal zone on a coral reef in Sanya Bay (Hainan Island, China) during 2009–2012. Russ. J.
Mar. Biol. 2013, 39, 413–419. [CrossRef]You can also read


