Dynamic Properties of Pretreated Rubberized Concrete under Incremental Loading
←
→
Page content transcription
If your browser does not render page correctly, please read the page content below
materials
Article
Dynamic Properties of Pretreated Rubberized Concrete under
Incremental Loading
Aijiu Chen 1 , Xiaoyan Han 2, * , Zhihao Wang 1 and Tengteng Guo 1

                                          1   School of Civil Engineering and Communication, North China University of Water Resources and Electric
                                              Power, Zhenzhou 450045, China; caj@ncwu.edu.cn (A.C.); wangzhihao@ncwu.edu.cn (Z.W.);
                                              guotth@ncwu.edu.cn (T.G.)
                                          2   School of Water Conservancy, North China University of Water Resources and Electric Power,
                                              Zhenzhou 450045, China
                                          *   Correspondence: little1216@163.com; Tel.: +86-1518-837-2529

                                          Abstract: Recycling scrap tyres as alternative aggregates of concrete is an innovative option. To clarify
                                          the dynamic properties of the pretreated rubberized concrete with some cumulative damage, the
                                          natural frequency, flexural dynamic stiffness, and damping ratio of the specimens under incremental
                                          stress level were investigated in this paper. The results indicated that the pretreatment of rubber
                                          particles improved the strength, ductility, and crack resistance of the rubberized concrete. The
                                          reduction of the flexural dynamic stiffness was clarified with the increase of concrete stress level. The
                                          addition of the pretreated rubber particles enhanced the concrete energy dissipation capacity during
                                          the destruction, and the specimen dissipated more energy with the increase of rubber content before
                                          its failure.

                                   Keywords: pretreated rubberized concrete; stress level; dynamic properties; natural frequency;
Citation: Chen, A.; Han, X.; Wang,        flexural dynamic stiffness; damping ratio
Z.; Guo, T. Dynamic Properties of
Pretreated Rubberized Concrete
under Incremental Loading. Materials
2021, 14, 2183. https://doi.org/          1. Introduction
10.3390/ma14092183                              In recent years, the continuous development of new raw materials has enriched the
                                          materials in the field of construction [1–4], among which the treatment and recovery of
Academic Editor:
                                          solid waste are of great significance for environmental protection, such as the utilization of
Marijana Hadzima-Nyarko
                                          recycled tyre polymer fiber as concrete reinforced materials by Chen et al. [1], the incorpo-
                                          ration of construction and demolition wastes as recycled aggregates by Rodríguez et al. [2],
Received: 8 April 2021
                                          and the utilization of waste tyre rubber as concrete material by Huang et al. [3] and
Accepted: 21 April 2021
                                          Gupta et al. [4]. The scrap tyre has become one of the most problematic solid wastes
Published: 24 April 2021
                                          throughout the world, and many researchers have proved that scrap tyres are sources of
                                          valuable raw materials [5–7]. The application of rubbers recovered from waste tyres as
Publisher’s Note: MDPI stays neutral
                                          concrete materials is beneficial to the environment and the sustainable development of
with regard to jurisdictional claims in
published maps and institutional affil-
                                          society [8–10].
iations.
                                                The rubberized concrete (RUC) with the appropriate amount and size of rubber parti-
                                          cles featured better durability [11], thermal and sound insulation properties [12,13] as well
                                          as ductility [14,15] than those of normal concrete (NC). Aslani et al. [16–18] studied the prop-
                                          erties of high-performance self-compacting concrete produced with rubber and achieved
                                          remarkable results. However, the concrete strength reduced significantly by replacing
Copyright: © 2021 by the authors.
                                          aggregates with rubber particles [19–21]. Compared with NC, the compressive strength,
Licensee MDPI, Basel, Switzerland.
                                          splitting tensile strength, and elastic modulus of the concrete where 20% fine aggregate
This article is an open access article
distributed under the terms and
                                          was replaced with rubber particles were reduced by 30% at least, and with the concrete
conditions of the Creative Commons
                                          where 20% coarse aggregate was replaced, the reduction was larger [20,22–26]. Numerous
Attribution (CC BY) license (https://
                                          methods to increase the properties of RUC and rubberized mortars have been proved
creativecommons.org/licenses/by/          feasible, such as pretreatment of rubber particles, application of fibers, etc. [18,27–31].
4.0/).

Materials 2021, 14, 2183. https://doi.org/10.3390/ma14092183                                              https://www.mdpi.com/journal/materials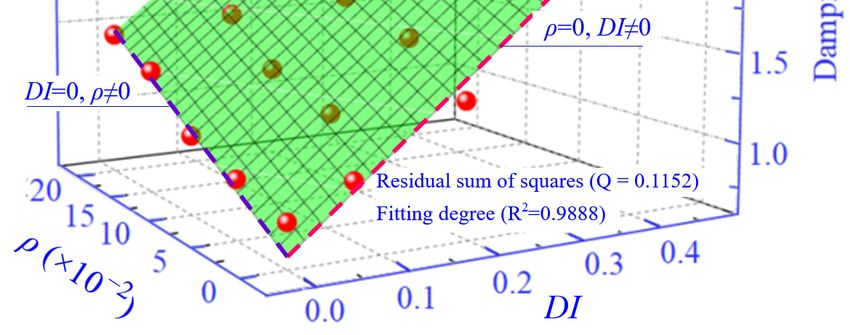
Materials 2021, 14, 2183                                                                                            2 of 19

                                 In recent years, researchers have paid more and more attention to concrete’s dynamic
                           properties [32,33]. The previous literature was mainly about the properties of unpretreated
                           rubberized concrete without damage. As a green potential concrete material, the dy-
                           namic properties of RUC have become an important research topic in recent years [34–38].
                           Chi et al. [39] and Xue and Shinozuka [40] researched the energy-dissipation capability
                           of rubberized concrete, and showed that the concrete curvature ductility and damping
                           ratio were enhanced significantly by replacing aggregate with rubber particles. Xue and
                           Shinozuka [40] reported that the damping ratio of the RUC mixed with 15% rubber particles
                           with a maximum size of 6 mm increased by 62% compared with that of NC. The damping
                           ratio of the concrete whose coarse or fine aggregate was replaced with rubber particles
                           was enhanced significantly [26,37,41]. The particle size, content and mixing method of
                           rubber particles had significant effects on the concrete’s dynamic properties [26,42,43].
                           As Gurunandan et al. [26] reported, the damping ratio of the RUC with 7.5% and 22.5%
                           fine aggregate replaced with rubber particles increased by 33.0% and 77.1% compared
                           with that of NC at 56-day age. Also, Zheng et al. [42] reported that when using rubber
                           particles instead of 15–45% coarse aggregate, the damping ratio of the RUC increased
                           by 19.2–75.3% and 28.6–144.0% when the size of the rubber particles was 2.62 mm and
                           15.00–40.00 mm, respectively.
                                 According to the above studies, rubber particles replacing coarse aggregate increased
                           the concrete damping capacity more notably, but the strength reduced significantly. The
                           concrete with fine aggregate replaced with rubber particles was relatively better. Muñoz-
                           Sánchez et al. [28] reported that the surface hydrophilicity, absorption, and roughness
                           of rubber particles increased after acid or alkaline treatments. Mohammadi et al. [27],
                           Si et al. [29], Guo et al. [44], and Rivas-Vázquez et al. [45] showed that pretreated rubberized
                           concrete (PRC) could maintain good workability, mechanical properties and enhance
                           durability with reduced environmental impacts. Compared with NC, the compressive
                           strength of the PRC reduced by only 14% (28 days), after replacing 10% fine aggregate
                           with rubber particles pretreated with alkaline activation [46]. Therefore, a further study
                           on dynamic properties of concrete with fine aggregate replaced with pretreated rubber
                           particles is necessary.
                                 Numerous mentioned papers have drawn important conclusions about the damping
                           capacity of RUC through different methods, and promote the development of research
                           on the dynamic capacity of concrete [40,42,43]. As reported by Xue and Shinozuka [40],
                           Zheng et al. [42], and Najim and Hall [43], the change trend of the damping ratio with
                           the increase of rubber content was almost the same, but the test values of damping ratio
                           and natural frequency showed a significant difference due to the different test methods
                           and specimens of different size and shape. The frequencies of concrete specimens were
                           hundreds to thousands Hz, and the energy dissipation capability was significantly affected
                           by the incompletely fixed ends and other vibration factors. Just as Strukar et al. [14] said,
                           the inconsistent effects of recycled rubber in concrete on the static and dynamic properties
                           of concrete materials and structures indicated that there was vital need for further research.
                                 The reported publications mainly studied the properties of original rubberized con-
                           crete with undamaged specimens. The dynamic properties of concrete with some damage
                           directly affect the anti-vibration capacity of the structures. It is necessary to study the
                           dynamic properties of PRC during its destruction. In this test, specimens of uniform size
                           were used, and the dynamic properties of the PRC, including natural frequency, flexural
                           dynamic stiffness and damping ratio under incremental loading, were investigated using
                           free vibration tests on them. The raw materials and the test methods were stated first, and
                           then a brief research on the concrete slump and mechanical properties was made. Finally,
                           the concrete dynamic properties were investigated.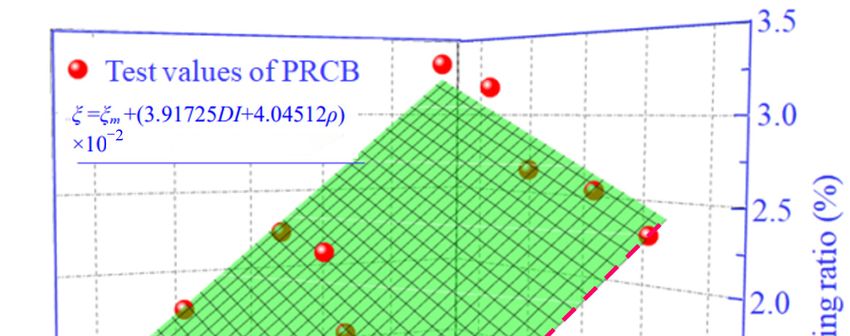
Materials 2021, 14, 2183 3 of 19
Materials 2021, 14, 2183 3 of 19
2.2.Materials
Materialsand
andMethods
Methods
2.1. Materials
2.1. Materials
The cement used in this test was the 42.5 Ordinary Portland Cement produced by
The cement used in this test was the 42.5 Ordinary Portland Cement produced by
Tianrui Group Cement Co., Ltd., Zhengzhou, China. The chemical compositions and
Tianrui Group Cement Co., Ltd., Zhengzhou, China. The chemical compositions and
properties of the cement are listed in Table 1, the preparation of cement mortar specimens
properties of the cement are listed in Table 1, the preparation of cement mortar specimens
and the test of their compressive and flexural strength are show in Figure 1.
and the test of their compressive and flexural strength are show in Figure 1.
Table 1. The properties of the cement, stone and sand.
Table 1. The properties of the cement, stone and sand.
The Chemical Compositions of the Cement (%)
The Chemical Compositions of the Cement (%)
CaO SiO2 Al2 O3
CaO SiO2 Fe2 O3 Al2O3 MgO
Fe2O3 SO3
MgO SO3 K2 O K2O Na
Na 2O
2O
61.63 21.00 5.20 3.92 2.75 2.48 0.83 0.20
61.63 21.00 5.20 3.92 2.75 2.48 0.83 1 0.20
Physical andPhysical
MechanicalandProperties
Mechanicalof the Cement of the Cement
Properties
Compressive
Setting time Compressive Blaine
Setting time (min) Flexural strengthFlexural
(MPa) strength Density
Blaine
Density fineness Losson
Loss onig-
strength (MPa)
(min) strength (MPa) (MPa) (kg/m 3 ) fineness
2 ignition (%)
Initial Final 3 days Initial28 days
Final 3 days3 days 28 days 328days days 28 days (kg/m3) (m(m /kg)
2/kg)
nition (%)
180 250 25.7 180 49.6 250 25.74.8 49.6 7.9
4.8 7.9 3100 3100 348.3
348.3 1.05
1.05
Properties of Properties of Crushed
Crushed Stone and SandStone and Sand
Apparent Pile-up Mud Water Water Crushed
Size Apparent Pile-up density Mud Crushed
Aggregates Size (mm) Aggregates
Fineness Fineness
density (kg/m3 )
density
(kg/m3 )
density contentAbsorption
content (%)
absorption index index
(%)
(mm) (%) (%)
(kg/m3) (kg/m3) (%) (%)
Coarse 5–20 Coarse– 5–20 2700-- 27001628 1628 0.47 0.47 1.001.001 14.8
14.8
Fine 0–4.75 Fine 2.7 0–4.75 2584
2.7 25841520 1520 1.80 1.80 1.301.30 –--
(a) (b) (c)
Figure 1. Preparation of cement mortar specimens and the test of their compressive and flexural strength: (a) Preparation
Figure 1. Preparation of cement mortar specimens and the test of their compressive and flexural strength: (a) Preparation
ofcement
of cementmortar
mortar specimens;
specimens; (b)(b)
TheThe
testtest of cement
of cement mortar
mortar compressive
compressive strength;
strength; and (c)and
The(c)
testThe test of mortar
of cement cementflexural
mortar
flexural
strength. strength.
The
Thecoarse
coarseand and fine
fine aggregates
aggregates were
were natural
natural crushed
crushed stone
stone and
and river
river sand. Their
Their
properties
properties are
are listed
listed in Table
Table 1.1. The
The apparent
apparentdensity
densityofofthetherubber
rubberparticles
particleswith
withthe
the size
size of
of 1–2
1–2 mmmmisis1250 kg/m33,, and
1250kg/m and the ash content, fiber content
content and
andmoisture
moisturecontent
contentare
are2.7%,
2.7%,
0.5%,
0.5%,and
and 0.6%,
0.6%, respectively.
respectively. TheThedistributions
distributionsofofthe
therubber
rubberandand aggregate
aggregate particle
particle sizesize
are
shown
are shownin Figure
in Figure2, and
2, andthethe
test of of
test coarse aggregate
coarse aggregate crushed
crushed index and
index the
and distributions
the distributions of
the rubber and aggregate particle size are shown in
of the rubber and aggregate particle size are shown in Figure 3.Figure 3.
The pretreated solution of rubber particles was sodium hydroxide solution with a
mass concentration of 5%. The rubber particles were washed with water three times and
dried, then soaked in the solution for 30 min. The mass ratio of rubber particles and the
solution was 1/2, and each batch of the solution was used only once on the rubber particles.
Finally, they were washed with water again, and dried.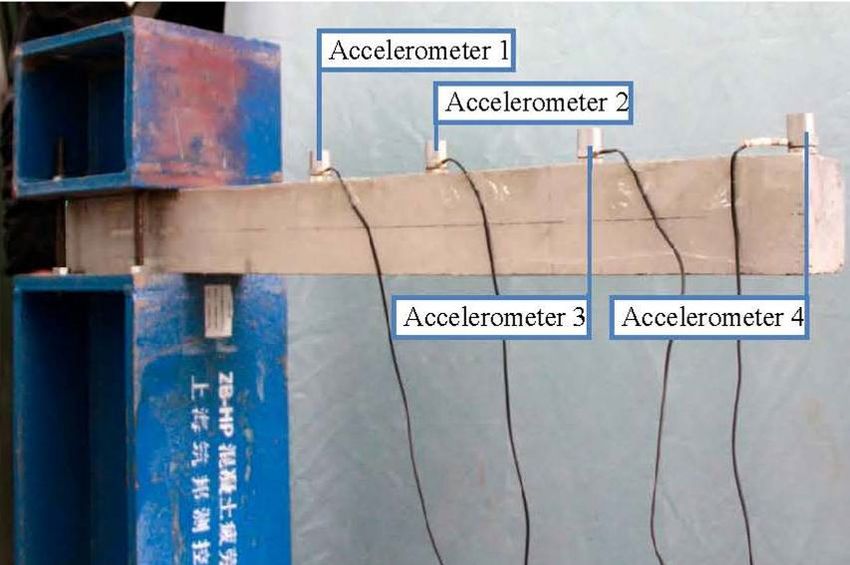
Materials 2021, 14, 2183 4 of 19
Materials 2021,
Materials 14,14,
2021, 2183
2183 4 of4 19
of 19
Figure
Figure2.2.Gradation
Figure 2.Gradationcurves
Gradationcurvesofofof
curves the
thesand,
sand,
the rubber
rubber
sand, particles,
particles,
rubber and
and
particles, crushed
andcrushed stone.
crushedstone.
stone.
(a)(a) (b)(b) (c)(c)
Figure
Figure
Figure 3.3.the
3.Thetest
the ofofof
test
test coarse
coarseaggregate
coarse aggregate
aggregate crushed
crushed
crushed index and
index
index and the
and distributions
the
the distributions
distributions ofofof
the rubber
the
the and
rubber
rubber aggregate
and
and particle
aggregate
aggregate particle
particle size: (a,b)
size:
size: (a,b)
(a,b)
The test
The of
test coarse aggregate crushed index; (c) The test of distributions of the rubber and aggregate particle size.
The test ofof coarse
coarse aggregate
aggregate crushed
crushed index;
index; (c)(c)
TheThe test
test ofof distributions
distributions ofof
thethe rubber
rubber and
and aggregate
aggregate particle
particle size.
size.
2.2. TheThepretreated
Concrete Mixes and
pretreated solution of of
Specimen
solution rubber particles
Preparation
rubber particles was
was sodium
sodium hydroxide
hydroxide solution
solution with
witha a
mass
mass concentration
concentration of of
5%. The
5%. rubber
The rubber particles
particles were
werewashed
washed with water three times and
The concrete mixtures were based on China Standards JGJ with water
55- contents three
of thetimes
rubberand
dried, then
dried, then soaked in the solution for 30 min. The mass ratio of rubber particles and thethe
particles weresoaked
0%, 5%, in 10%,
the solution
15%, and for20%.
30 min.
The The mass 2011
dynamic ratio[47].
of rubber particlesofand
The volumes sand
solution
solution was
was 1/2, and each batch of thethe
solution was used only once onon
thetherubber parti-
properties and 1/2,
frostand each
resistance batch
mayofdecrease solution
whenwas the used
rubber only once
content exceeds rubber
20% basedparti-
cles.
on Finally,
cles.
theFinally,they
previous theywere washed
were washed
literature with water
[35,48],with water
hence again, and dried.
again, andvalue
a maximum dried.of 20% rubber particles was
used in this test. The mix proportions of RUC and PRC are listed in Table 2.
2.2. Concrete
2.2. Concrete Mixes
MixesandandSpecimen
SpecimenPreparation
Preparation
The concrete
Table mixtures
2. The mix were
proportions
The concrete mixtures were based based onon
and slumps China Standards
of concrete.
China Standards JGJJGJ
55-55-
contents
contents of of
thethe
rubber
rubber
particles were 0%, 5%,
particles were 0%, 5%, 10%, 10%, 15%, and 20%.
15%, and 20%. The dynamic 2011 [47]. The volumes of sand
Mix Proportions (kg/mThe3 ) dynamic 2011 [47]. The volumes of sand
Rubber properties
properties andandfrost resistance
frost may
resistance maydecrease
decrease when
when thethe
rubber
rubbercontent
contentexceeds
exceeds 20%20%based
Slump based
Mixtures on the previous literature Unpretreated
[35,48], hencePretreated
a maximum Crushed
value of 20% rubber particles was
Content on the previous
Cement Waterliterature [35,48], hence a maximum value of 20% rubber
Sand (mm)
particles was
used in in
this test. The mix Rubber
proportions of Rubber
RUC and PRC Stones
areare
listed in in
Table 2. 2.
used this test. The mix proportions of RUC and PRC listed Table
NC 0 325.0 195.0 0 0 1092.0 728.0 60
RUC1 5% 325.0 195.0 17.61 0 1092.0 691.6 57
PRC1 5% 325.0 195.0 0 17.61 1092.0 691.6 60
RUC2 10% 325.0 195.0 35.22 0 1092.0 655.2 55
PRC2 10% 325.0 195.0 0 35.22 1092.0 655.2 50
RUC3 15% 325.0 195.0 52.83 0 1092.0 618.8 57
PRC3 15% 325.0 195.0 0 52.83 1092.0 618.8 54
RUC4 20% 325.0 195.0 70.44 0 1092.0 582.4 61
PRC4 20% 325.0 195.0 0 70.44 1092.0 582.4 65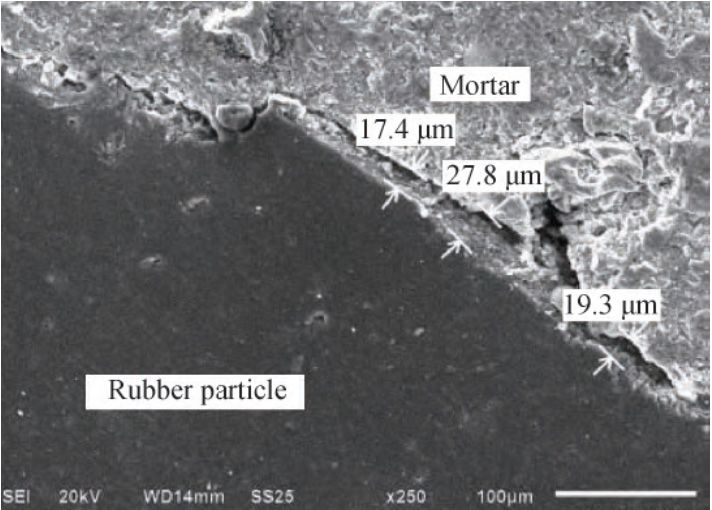
Materials 2021, 14, 2183                                                                                         5 of 19

                                A total of nine groups of specimens, including four groups of RUC, four groups
                           of PRC, and a group of NC as reference specimens were prepared. Each group con-
                           tained 17 concrete specimens, three for the test of dynamic elastic modulus and flexural
                           strength, two for the test of dynamic properties, and three for each other test. The six
                           specimens for the test of cube compressive strength and splitting tensile strength were of
                           the size of 100 × 100 × 100 mm. Another six specimens for the test of axial compressive
                           strength and static elastic modulus were of the size of 150 × 150 × 300 mm. Three spec-
                           imens for the test of dynamic elastic modulus and flexural strength were in the size of
                           100 × 100 × 400 mm. The last two specimens for the test of dynamic properties were in
                           the size of 100 × 100 × 1000 mm.
                                The structural form of the cantilever beam is simple, and the pre-loading damage
                           is easy to operate [49,50]. The natural frequency of specimens can be calculated with
                           the dynamic elastic modulus, the mass and the length–width ratio of the specimens [50].
                           Based on the normal concrete cantilever beam with the natural frequency of about 30 Hz,
                           rubberized concrete specimens of small cantilever beams were used for the free vibration
                           tests. The longitudinal reinforcement, with a diameter of 6 mm and a grade of HPB300,
                           was 432 MPa at yield and 556 MPa at peak. The hooping was made with iron wire of a
                           diameter of 4 mm. The thickness of the protective layer was 15 mm. Specimens of each
                           group were produced at the same time, and the tests were performed at the end of 28 days
                           curing period, keeping the specimens in a curing room within 20 ± 5 ◦ C and over 95% for
                           the relative humidity.

                           2.3. Test Methods
                                The properties of concrete including the slump, strength, static, and dynamic elastic
                           modulus were tested based on China Standards GB/T50080-2016 [51], GB/T50081-2002 [52]
                           and British Standards BS 1881-209-1990 [53], respectively. For each test, the average value
                           of the three specimens was reported as the test value. The natural frequency, flexural
                           dynamic stiffness and damping ratio were obtained through the free vibration test of the
                           small cantilever beams under incremental loading (0, 0.8Mr , 0.6Mu and 0.8Mu ) with 0–0.8
                           of the concrete stress level (σ), as shown in Figure 4.
                                Three concrete stress levels including 0.8Mr /Mu , 0.6 and 0.8 were designed, and the
                           dynamic properties of concrete both before and after cracking were studied, where Mr and
                           Mu were the flexural cracking and ultimate moment of the cantilever beam. As shown in
                           Figure 4, the concrete stress level was prepared under a concentrated load with a hanging
                           basket and a set of calibrated weights by using a standard graded loading procedure based
                           on China Standards GB/T 50152-2012 [54]. Based on the assumptions and method of
                           calculation in Standards GB50010-2010 [55], the stress of concrete during the destruction
                           was determined by
                                                                σc = Ec ε c , σs = Es ε s                           (1)
                                                             x0 /ε c = h0 /(ε c + ε s )                             (2)
                                                             α1 Ec ε c bβx0 = Es ε s AS                             (3)
                                                        M = α1 Ec ε c bβx0 (h0 − βx0 /2)                            (4)
                           where σc and σs were the sectional concrete maximum compressive stress and the tensile
                           stress of the reinforcement bar. Ec and Es were the elastic moduli of RUC and reinforcement
                           bar, and εc and εs were the strain. The unmarked physical parameters mentioned above
                           were formulated according to Standards [55]. When the bending moment was M, based on
                           Equations (1)–(4), the stress level (σ) was able to be calculated by

                                                            σ = σc /σcu = M/Mu                                      (5)

                           where σcu was the concrete ultimate stress.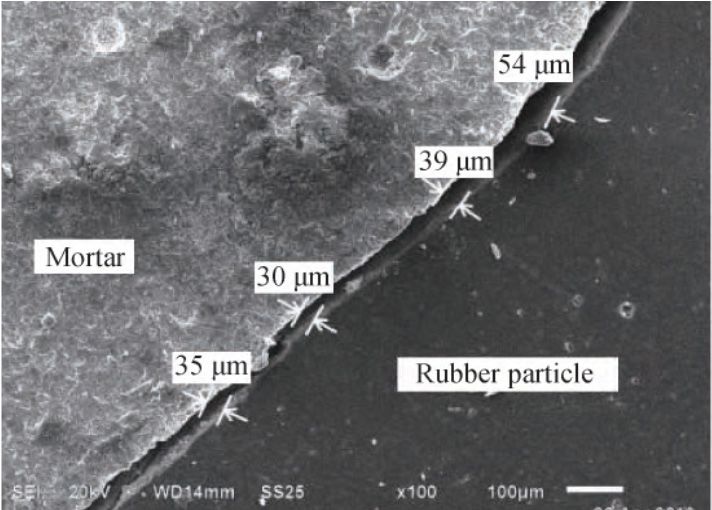
Materials 2021, 14, 2183
s 2021, 14, 2183 6 of 19 6 of 19
(a) (b)
(c)
Figure
Figure 4. Test setup4.of
Test
freesetup of free
vibration andvibration
dynamicand dynamic
digital signaldigital signal
processing processing(a)
instrument: instrument:
Test setup (a) Testcantilever beam;
of the
setup of the cantilever beam; (b) Dynamic digital signal processing
(b) Dynamic digital signal processing instrument; and ©(c) Details of the test setup.instrument; and ©(c) Details of
the test setup.
Well-reasoned design of the test setup was the basis for obtaining reliable results,
Three concrete stressfor
especially levels including
testing concrete0.8M r/Mu, 0.6
dynamic and 0.8[32].
properties wereThedesigned, and
test setup thedynamic digital
and
dynamic properties of concrete both
signal-processing before and
instrument areafter
shown cracking were
in Figure 4. studied, where Mr and
Mu were the flexuralFourcracking andaccelerometers
INV9828 ultimate moment wereofmounted
the cantilever
on thebeam. As shown
top surface alonginthe centerline of
Figure 4, the concrete stress
the beam, andlevel was prepared
the INV3062T Dataunder a concentrated
Acquisition load with
System recorded theaacceleration-versus-time
hanging
basket and a set data.
of The versionweights
calibrated of this software
by usingwas COINV DASP
a standard graded V10, and both
loading the accelerometers and
procedure
based on Chinathe softwareGB/T
Standards were 50152-2012
developed 2014[54]. by China
Based on Orient Institute ofand
the assumptions Noise & Vibration, Beijing,
method
of calculation inChina. The GB50010-2010
Standards sampling rate[55], andthe
signal acquisition
stress of concretetime were
during the1024 Hz and three seconds,
destruction
was determined respectively,
by and the acceleration-versus-time data in three seconds were collected from the
peak acceleration of 0.5 m/s2 . Zheng et al. [42] reported that the concrete damping ratio
σ c = Ec ε c , σ s = E s ε s (1)
increased with the increase of maximum response amplitude, and the damping property
of rubberized concrete was more sensitive to the vibration response amplitude than that
of plain concrete. This ε c =beh0attributed
x0 can (ε c + ε s )to the increased Coulomb friction (2) damping by
adding the rubber particles [56,57]. Hence, the same excitation (300 N) of vibration was
applied to the position α1 Eof
c ε cthe
bβ xconcentrated
0 = E s ε s AS load. The effect of excitation (3)was slight, and
considered to influence only the first model.
M = α E ε bβ x0 ( h0 − β x0 2) (4)
2.4. Theoretical Bases of 1Analysis
c c
where σc and σs were The
thedynamic
sectionalanalysis
concreteofmaximum
concrete was based on structural
compressive stress anddynamics
the tensile[50].
(1) Natural
stress of the reinforcement bar.frequency
Ec and Es were the elastic moduli of RUC and reinforce-
ment bar, and ɛc and Theɛs acceleration-versus-time data were
were the strain. The unmarked obtained
physical through the
parameters free vibration test of a
mentioned
cantilever beam under incremental loading. The test natural
above were formulated according to Standards [55]. When the bending moment was M,frequency of the specimens
based on Equations (1)–(4), the stress level ( σ ) was able to be calculated by
σ = σ c σ cu = M M u (5)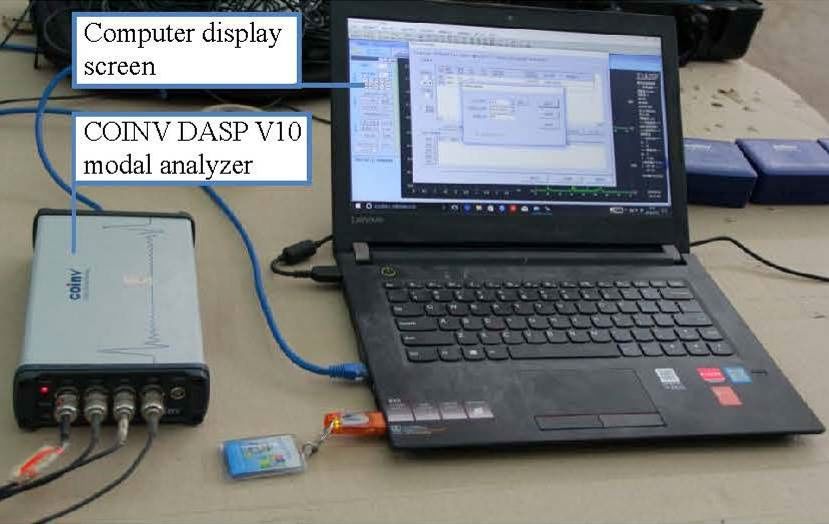
Materials 2021, 14, 2183                                                                                         7 of 19

                           was determined with the attenuated curves of acceleration. For the concrete specimens
                           without damage, their natural frequency can be calculated by
                                                                 q                        q
                                                   ω1 = 2π f /       1 − ξ 2 = 1.8752         EI/(mL4 )             (6)

                           where ξ, E, I, and f are the damping ratio, dynamic elastic modulus, the moment of
                           inertial, and natural frequency, 1 − ξ 2 ≈ 1. Also, m and L are the mass per unit length
                           and calculated length of cantilever beams. Based on Equation (6), the theoretical natural
                           frequency of the specimens was determined by
                                                                           q
                                                            f = 1.8752         EI/(mL4 )/2π                         (7)

                                  (2) Damping ratio
                                  The acceleration amplitude from the first 20 oscillation cycles was used to calculate
                           ξ by
                                                                            1    a
                                                                   ξ =        ln 1                                  (8)
                                                                           40π a21
                           where a1 and a21 were the initial peak and the 21st peak in the given time history.
                                (3) Flexural dynamic stiffness
                                The properties of concrete change with the increase of rubber content and cumulative
                           damage, and EI is no longer an invariant constant. Based on Equation (6), once the
                           natural frequency was obtained, Equation (9) could be used to approximately predict
                           the flexural dynamic stiffness under various conditions, and the dimensionless flexural
                           dynamic stiffness was calculated by Equation (10).

                                                              EI = (2π f )2 mL4 /1.8754                             (9)

                                                          ( EI )i = ( EI )i /( EI )0 = f i2 / f 02                 (10)
                           where (EI)0 and f 0 were the flexural dynamic stiffness and natural frequency about can-
                           tilever beams of reference, and (EI)i and fi were the values of cantilever beams under
                           different conditions. For each test of natural frequency, damping ratio and flexural dy-
                           namic stiffness, the average value of the two specimens was reported as the test value.

                           3. Results and Discussion
                           3.1. Slump
                                The concrete workability was measured by the slumps obtained by the standard test.
                           The slumps of RUC and PRC with the same rubber content were similar, as listed in Table 2.
                           The concrete slumps first decreased with the increase of rubber content, and then increased
                           slightly when the rubber content exceeded 10%. The value reached the minimum when
                           the content of the rubber was about 10%, and the slump reduced by 8.3% compared with
                           that of NC. The slump of PRC4 reached the value of NC. All the rubberized fresh concrete
                           mixtures exhibited a similar slump to that of NC.
                                In this test, the concrete slumps first decreased and then increased slightly with the
                           increase of rubber content. This is understandable since both the amount of sand and
                           water are the important factors of fresh concrete slumps. When some sand was replaced
                           by rubber particles, the flowability of concrete decreased as the result of the reduction
                           of sand and coarse aggregate ratio. Note that when the sand was replaced with enough
                           rubber particles, the actual moisture content of RUC was higher due to the lower water
                           absorption of rubber particles (1–2 mm) than that of sand, which may have increased the
                           slump of concrete slightly. Also, the gas carried by rubber particles during the concrete
                           mixing process can also improve the workability of the concrete.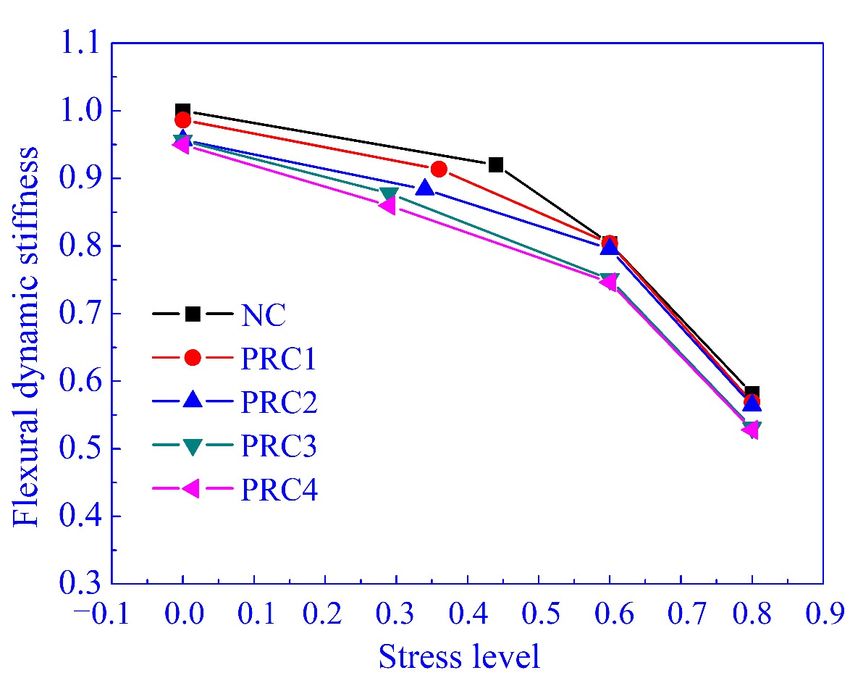
Materials 2021, 14, 2183                                                                                                                8 of 19

                                  3.2. Mechanical Properties
                                  3.2.1. Strength and Static Elastic Modulus
                                        The test results for the concrete strength and static elastic modulus are listed in Table 3.

                                        Table 3. The strengths and elastic modulus of concrete.

                                                                                                                 Dynamic Elastic
                                       Strength (MPa)                                Static Elastic              Modulus (GPa)
   Mixtures                                                                            Modulus
                      Cube           Axial                           Splitting           (GPa)                                  Difference
                                                     Flexural                                             Ed1         Ed2
                   Compressive    Compressive                         Tensile                                                      (%)
      NC                   37.8       25.8             5.60             2.69              31.7            34.3        30.9          9.9
     RUC1                  36.2       23.5             5.31             2.48              25.9            33.0        29.6          10.3
     RUC2                  33.3       20.8             5.02             2.23              24.1            32.3        28.9          10.5
     RUC3                  29.0       17.9             4.38             1.93              21.8            30.7        27.3          11.1
     RUC4                  23.4       15.0             3.63             1.53              18.9            28.4        26.8           5.6
     PRC1                  37.3       24.0             5.59             2.60              28.3            33.8        30.0          11.2
     PRC2                  35.1       21.8             5.51             2.45              25.1            32.8        30.7           6.4
     PRC3                  32.2       18.6             5.00             2.10              22.3            31.2        28.4           9.0
     PRC4                  27.4       16.0             4.10             1.65              20.5            29.5        27.3           7.5

                                        As most papers reported, the addition of rubber particles weakened the concrete
                                  strength significantly [28,56–58]. In this test, compared with NC, for the concrete with
                                  10–20% rubber content, the cube and axial compressive strength reduced by about 15.0–42.0%,
                                  and static elastic modulus reduced by about 25.0–45.0%. To PRC with 5%, 10%, and 15%
                                  rubber content, their cube compressive strengths reached 1.3%, 7.1%, and 14.8% below
                                  that of NC, and their static elastic modulus were 13.5%, 23.2%, and 31.8% below that of
                                  NC. The concrete with added pretreated rubber particles showed a significant recovery
                                  of strength and satisfactory deformation. Pelisser et al. [46] reported that the compressive
                                  strength of PRC with 10% rubber content reduced by 14% (28 days) compared with NC,
                                  which is similar to the test result of this paper.
                                        The effects of rubber content and pretreatment of rubber particles on the ratio of
                                  splitting tensile and axial compressive strength, and the ratio of flexural and axial com-
                                  pressive strength, are shown in Figure 5, where f f , f cp and f ts represent the dimensionless
                                  values of flexural strength, axial compressive strength, and splitting tensile strength. As
                                  shown in Figure 5, f f /f cp is larger than f ts /f cp , and both the f f /f cp and f ts /f cp increase first
                                  and then decrease with the increase of rubber content. To f f /f cp and f ts /f cp of PRC, the
                                  values are larger than that of RUC. This indicated that the pretreatment of rubber particles
                                  with sodium hydroxide further enhanced the ductility of the rubberized concrete, and the
                                  recommended content of rubber was about 15%.
                                        The surface of the routine and pretreated rubber particles, as well as their bonding
                                  interface with cement matrix, were obtained by scanning electron microscopy. Figure 6a–e
                                  show the surface of the unpretreated rubber particle, the surface of the pretreated rubber
                                  particle, the bonding interface between unpretreated rubber particle and cement matrix, the
                                  bonding interface of pretreated rubber particle and cement matrix, and the distribution of
                                  the rubber particles in concrete, respectively. The rubber particles are uniformly distributed
                                  in the concrete.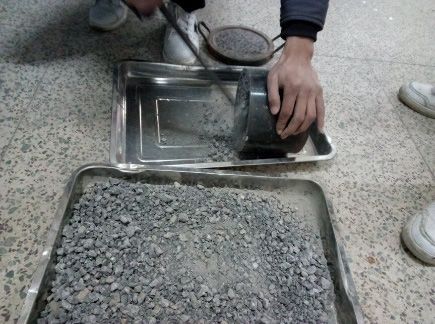
strength,
                               that of RUC. are
                                             Thisshown      inthat
                                                    indicated  Figure    5, where ffof
                                                                   the pretreatment  , fcp and particles
                                                                                        rubber  fts represent   the dimensionless
                                                                                                          with sodium  hydrox-     values of
                                 flexural
                               ide         strength,the
                                   further enhanced      axial  compressive
                                                            ductility           strength,
                                                                      of the rubberized     and splitting
                                                                                         concrete,            tensile strength.
                                                                                                    and the recommended   con- As shown in
                               tent of rubber
                                 Figure  5, ff/fwas
                                                cp isabout
                                                      larger15%.
                                                              than fts/fcp, and both the ff/fcp and fts/fcp increase first and then decrease
                                with the increase of rubber content. To ff/fcp and fts/fcp of PRC, the values are larger than
Materials 2021, 14, 2183        that of RUC. This indicated that the pretreatment of rubber particles with sodium hydrox-
                                                                                                                        9 of 19
                                ide further enhanced the ductility of the rubberized concrete, and the recommended con-
                                tent of rubber was about 15%.

                               Figure 5. fts/fcp and ff/fcp of rubberized concrete.

                                    The surface of the routine and pretreated rubber particles, as well as their bonding
                               interface with cement matrix, were obtained by scanning electron microscopy. Figure 6a–
                               e show the surface of the unpretreated rubber particle, the surface of the pretreated rubber
                               particle, the bonding interface between unpretreated rubber particle and cement matrix,
                               the bonding interface of pretreated rubber particle and cement matrix, and the distribu-
                               tion of the rubber particles in concrete, respectively. The rubber particles are uniformly
                                 Figure
                                 Figure 5.
                               distributed5. fin
                                               ftsts/fthe
                                                       cp and
                                                      /f      ff/fcp
                                                           concrete.
                                                          cp and      of cp
                                                                  f f /f  rubberized concrete.
                                                                            of rubberized concrete.

                                     The surface of the routine and pretreated rubber particles, as well as their bonding
                                interface with cement matrix, were obtained by scanning electron microscopy. Figure 6a–
                                e show the surface of the unpretreated rubber particle, the surface of the pretreated rubber
                                particle, the bonding interface between unpretreated rubber particle and cement matrix,
                                the bonding interface of pretreated rubber particle and cement matrix, and the distribu-
                                tion of the rubber particles in concrete, respectively. The rubber particles are uniformly
                                distributed in the concrete.

    Materials 2021, 14, 2183                                                                                                10 of 19

                                                        (a)                                            (b)

                                                        (c)                                             (d)
                                                              (a)                                                     (b)

                                                                                      (e)
                               Figure 6. The
                                 Figure       surface
                                          6. The      of theof
                                                  surface   rubber  particlesparticles
                                                               the rubber     and theirand
                                                                                        bonding
                                                                                            theirinterface
                                                                                                   bonding with cement matrix:
                                                                                                             interface          (a)
                                                                                                                        with cement     matrix: (a) The
                               The surface of routine rubber particles; (b) The surface of pretreated rubber particles; (c) The
                                 surface   of routine   rubber   particles;   (b) The  surface  of  pretreated   rubber   particles;
                               bonding interface of the rubber and cement matrix (×100); (d) The bonding interface of the pre-        (c) The bonding
                                 interface  of  the rubber   and  cement    matrix  ( × 100); (d) The   bonding   interface  of
                               treated rubber and cement matrix (×250); and (e) Distribution of the rubber particles in concrete.the pretreated rubber
                                 and cement matrix (×250); and (e) Distribution of the rubber particles in concrete.
                                    As shown in Figure 6, the surface of the pretreated rubber particle is clean and rough,
                               and the width of an obvious crack along the interface between rubber and cement matrix
                               reduces significantly after pretreatment. This can be attributed to the enhanced superficial
                               adsorption, roughness, and the attenuation of hydrophobicity of rubber powders due to
                               the corrosion of sodium hydroxide [28,46]. Therefore, the pretreatment of rubber particles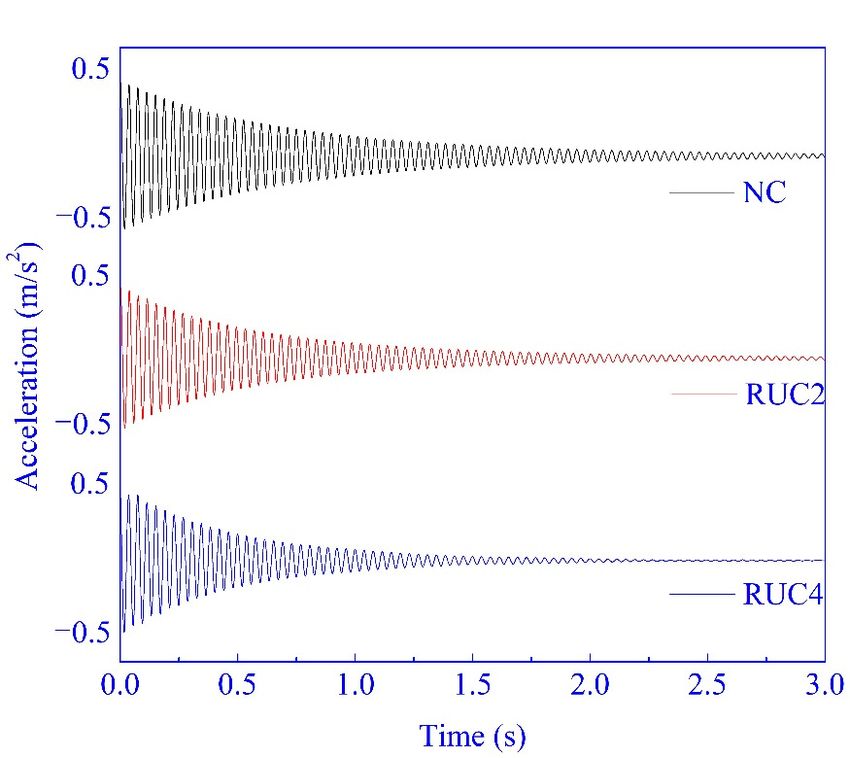
Materials 2021, 14, 2183 10 of 19
As shown in Figure 6, the surface of the pretreated rubber particle is clean and rough,
and the width of an obvious crack along the interface between rubber and cement matrix
reduces significantly after pretreatment. This can be attributed to the enhanced superficial
adsorption, roughness, and the attenuation of hydrophobicity of rubber powders due to
the corrosion of sodium hydroxide [28,46]. Therefore, the pretreatment of rubber particles
helped reduce the internal defects between the rubbers and cement matrix, and increased
the strength of RUC. However, the increase of concrete strength by enhancing the bonding
interface between the rubber and cement matrix is not unlimited, since the rubber particles
fill the voids in concrete as rubber aggregate, but they can’t act as the skeleton like sand
due to its lower strength and stiffness.
Gao et al. [44] and Bompa et al. [56] reported that the added rubber particles increased
the ductility of concrete, but concrete strength decreased significantly due to the rubber’s
low stiffness and surface bonding with cement matrix. Hence, the ductility of the rubber-
ized concrete may be further enhanced due to the elasticity of rubber and the enhanced
interface between the rubber and cement matrix by pretreating the rubber particles. More-
over, lots of concrete internal defects due to a large content of rubber particles may reduce
Materials 2021, 14, 2183 the splitting tensile and flexural strength more rapidly, which is adverse to concrete 11 duc-
of 19
tility, hence the values of f f /f cp and f ts /f cp decrease when the content of rubber particles
exceeds 15%.
3.2.2. The Ratio of Cracking and Ultimate Moment
3.2.2. The Ratio of Cracking and Ultimate Moment
The ratio of cracking and ultimate moment (Mc/Mu) of the cantilever beams reflects
The ratio of cracking and ultimate moment (Mc /Mu ) of the cantilever beams reflects
the ductility of the specimens. When Mc/Mu is too high, the material lacks ductility and
the ductility of the specimens. When Mc /Mu is too high, the material lacks ductility and
there will be a sudden brittle failure of the specimen without obvious warning signs. The
there will be a sudden brittle failure of the specimen without obvious warning signs. The
test
test results
results of Mc and
of M and MMu are
arelisted
listedin
inTable
Table 4.
4.
c u
Table 4. Cracking
Table 4. Cracking moment,
moment, ultimate
ultimate moment, and natural
moment, and natural frequency
frequency of
of cantilever
cantilever beams.
beams.
Frequency (Hz)
Frequency (Hz)
Mixtures Mc Mu
Mixtures Mc Mu Theoretical Test
Theoretical Test
NC 1.42 2.62 30.18 26.68
NC 1.42 2.62 30.18 26.68
RUC1/PRC1 1.13/1.17 2.55/2.53 29.01/29.36 26.51/26.50
RUC1/PRC1 1.13/1.17 2.55/2.53 29.01/29.36 26.51/26.50
RUC2/PRC2
RUC2/PRC2 1.03/1.07
1.03/1.07 2.43/2.44
2.43/2.44 28.70/28.92 26.26/26.10
28.70/28.92 26.26/26.10
RUC3/PRC3
RUC3/PRC3 0.87/0.91
0.87/0.91 2.30/2.32
2.30/2.32 27.98/28.21 26.01/26.09
27.98/28.21 26.01/26.09
RUC4/PRC4
RUC4/PRC4 0.80/0.89
0.80/0.89 2.18/2.22
2.18/2.22 26.91/27.43 25.92/26.01
26.91/27.43 25.92/26.01
The
The effects
effects of the content of
of rubber
rubber particles
particles and
and the
the pretreatment
pretreatment on
onM
Mc /M
c/Mu are
u
shown in Figure
shown in Figure 7.
Figure
Figure 7.
7. M
Mcc/Mu of
/M the
u of thespecimens.
specimens.
Mc/Mu of the specimens decreased with the increase of rubber content. Xie et al. [7]
reported that the addition of rubber particles generally reduced the cracking load of the
concrete specimens, but had a slight effect on the load-bearing capacity when the rubberMaterials 2021, 14, 2183 11 of 19
Mc /Mu of the specimens decreased with the increase of rubber content. Xie et al. [7]
reported that the addition of rubber particles generally reduced the cracking load of the
concrete specimens, but had a slight effect on the load-bearing capacity when the rubber
content was less than 10%, which was similar to that of this research. This indicated
that the addition of rubber particles increased the ductility of concrete significantly. As
listed in Table 4, both Mc and Mu increase by pretreating the rubber particles, and the
increase of Mc is more significant than that of Mu . This indicated that the addition of the
appropriate amount of pretreated rubber particles increased concrete ductility, as well as
the cracking property.
The uniformly distributed rubber particles in the cement matrix can effectively prevent
the extension and expansion of micro cracks in the initial stage of concrete failure. However,
it is completely possible that micro cracks will continue to extend along the cracks between
rubber particles and cement matrix due to the unbonded interfaces and micro cracks
between the rubber particles and cement matrix. The enhanced bonded interfaces between
rubber particles and cement matrix are more beneficial for rubber particles bringing the
advantage of elasticity and deformation into full play to effectively prevent micro cracks
from extending and expanding, and to increase the ductility and crack resistance of concrete.
It is also notable that the falling rates of Mc /Mu gradually decrease, and the decrease of
Mc /Mu was not distinct when the rubber content exceeded 15%. This can be attributed to
lots of concrete internal defects due to the large content of rubber particles. This indicated
that the pretreatment of rubber particles with sodium hydroxide further enhanced f f /f cp
and f ts /f cp , and the recommended content of rubber is about 15%. Also, the compressive
strength of PRC with 15% rubber content reached 14.8% below that of NC. Therefore,
taking into account the strength, deformation, ductility, and crack resistance of concrete,
the satisfactory content of pretreated rubber particles is about 15%.
3.3. Dynamic Properties
3.3.1. Dynamic Elastic Modulus
The dynamic elastic modulus (Ed1 ) about all the mixtures are listed in Table 3. Com-
pared with NC, when the rubber content was 5%, 10%, 15%, and 20%, the reduction of
dynamic elastic modulus was 3.8%, 5.8%, 10.5%, and 17.2% for RUC and 1.5%, 4.3%, 9.0%,
and 14.9% for PRC, respectively. As for static elastic modulus, the pretreatment of rubber
particles had a slight influence on dynamic elastic modulus.
As shown in Figure 8, with the same mix proportion, the dynamic elastic modulus
is larger than the static elastic modulus, and the reduction of dynamic elastic modulus is
smaller than that of the static elastic modulus. This is understandable since the dynamic
elastic modulus is determined through a non-destructive test [42,43,53], and the effects of
rubber particles on the concrete internal structure in the absence of external forces is much
slighter than that in the condition of external load.
The dynamic elastic modulus represents the behavior of concrete deformation under
dynamic load. The deflection of the specimen will decrease as the result of the increase
of concrete dynamic elastic modulus. In this test, to PRC with 10% and 20% rubber
content, their dynamic elastic modulus decreased by 4.3% and 14.9%, while the static
elastic modulus decreased about by 23.2% and 45%. To RUC and PRC with 20% rubber
content, the dynamic elastic modulus was higher than the static elastic modulus by 50.3%
and 43.9%, and the difference was 50.0%, reported by Zheng et al. [42]. This indicated that
the response of the specimen produced with PRC was smaller than that of the specimen
produced with NC under the same dynamic load, and the anti-vibration and deformation
of PRC were more satisfactory than that of NC.As shown in Figure 8, with the same mix proportion, the dynamic elastic modulus is
larger than the static elastic modulus, and the reduction of dynamic elastic modulus is
smaller than that of the static elastic modulus. This is understandable since the dynamic
elastic modulus is determined through a non-destructive test [42,43,53], and the effects of
Materials 2021, 14, 2183 rubber particles on the concrete internal structure in the absence of external forces is much
12 of 19
slighter than that in the condition of external load.
ls 2021, 14, 2183 13 of 19
Figure 8. The dynamic and static elastic modulus.
Figure 8. The dynamic and static elastic modulus.
3.3.2. Natural Frequency
3.3.2. Natural Frequency
The acceleration-versus-time
The dynamic elasticdatamodulus
in three seconds
representswere
thecollected
behaviorfrom the peak
of concrete ac-
deformation under
celeration of 0.5 m/s The acceleration-versus-time
2 through the free vibration data in
tests. Thethree seconds
curves were were collected
typical from the peak accel-
logarithmic
dynamic load. The 2deflection of the specimen will decrease as the result of the increase of
eration
attenuated curves, andof 0.5partial
the m/s through
curves theshown
are free vibration
in Figure tests. The curves were typical logarithmic
concrete dynamic elastic modulus. In this test, to9.PRC with 10% and 20% rubber content,
attenuated curves, and the partial curves are shown in Figure 9.
their dynamic elastic modulus decreased by 4.3% and 14.9%, while the static elastic mod-
ulus decreased about by 23.2% and 45%. To RUC and PRC with 20% rubber content, the
dynamic elastic modulus was higher than the static elastic modulus by 50.3% and 43.9%,
and the difference was 50.0%, reported by Zheng et al. [42]. This indicated that the re-
sponse of the specimen produced with PRC was smaller than that of the specimen pro-
duced with NC under the same dynamic load, and the anti-vibration and deformation of
PRC were more satisfactory than that of NC.
(a) (b)
Figure
Figure 9. Time 9. Time
history history of acceleration
of acceleration (with
(with the data the data
collected collected by Accelerometer
by Accelerometer 3): (a)
3): (a) The effects of The effects
rubber particle content;
of rubber particle content; and
and (b) The effects of the cumulative damage. (b) The effects of the cumulative damage.
The test valuesThe test values
of natural of natural
frequency were frequency
obtainedwere
withobtained with
the curves, asthe curves,
listed as listed in Table 4.
in Table
Thenatural
4. The theoretical theoretical naturaloffrequency
frequency of thecan
the specimens specimens can also be determined
also be determined by calculat- by calculating
with (7),
ing with Equation Equation
and the (7),values
and thearevalues
listedare
in listed
Table in
4. Table
Small4.differences
Small differences (less than 10.0%)
(less than
10.0%) between between
the testthe
andtest and theoretical
theoretical values values
verifiedverified the validity
the validity of the
of the test test results.
results.
As per the test As per the
natural test natural
frequency frequency
listed in Table 4,listed in Table 4,
the increase of the increase
rubber contentof rubber
leads content leads
to a slight
to a slight reduction, but reduction,
an obviousbut an obvious
decrease decrease
is observed is observed
with with
the increase of the increase
stress level, of stress level,
as shown
as shown in Figure 10. in Figure 10.
The test natural frequency of the cantilever beams produced with NC (NCB) was
26.684 Hz, while the value reduced 2.8% and 2.5% for the specimens produced with RUC
(RUCB) and PRC (PRCB), respectively, with 20% rubber content. To the simply supported
beams in the similar test condition reported by Zheng et al. [42], the reduction of the natural
frequency was almost the same with that in this test. Compared with NCB, under the
stress level of 0.8, the natural frequency reduced 23.7% for NCB and 25–27.0% for RUCB
and PRCB.4. The theoretical natural frequency of the specimens can also be determined by calculat-
ing with Equation (7), and the values are listed in Table 4. Small differences (less than
10.0%) between the test and theoretical values verified the validity of the test results.
As per the test natural frequency listed in Table 4, the increase of rubber content leads
Materials 2021, 14, 2183 to a slight reduction, but an obvious decrease is observed with the increase of stress13level,
of 19
as shown in Figure 10.
Figure 10.
Figure The effect
10. The effect of
of stress
stress level
level on
on the
the natural
natural frequency.
frequency.
The test
The natural frequency
natural is a major
frequency of the dynamic
cantileverparameter of concrete,
beams produced withwhich is mainly
NC (NCB) was
affected by dynamic elastic modulus and unit weight of the specimen. With the increase of
26.684 Hz, while the value reduced 2.8% and 2.5% for the specimens produced with RUC
rubber content, the natural frequency of concrete specimens decreases slightly since the
(RUCB) and PRC (PRCB), respectively, with 20% rubber content. To the simply supported
reduction of dynamic elastic modulus is smaller than that of unit weight. The reduction of
beams in the similar test condition reported by Zheng et al. [42], the reduction of the nat-
dynamic elastic modulus is the representation of development in concrete damage [53,59].
ural frequency was almost the same with that in this test. Compared with NCB, under the
The natural frequency of concrete specimens decreases notably with the increase of stress
level, which can be attributed to the increasing reduction of dynamic elastic modulus with
the increase of damage accumulation (stress level).
3.3.3. Flexural Dynamic Stiffness
The concrete dynamic elastic modulus (Ed2 ) can also be determined through the free
vibration test of cantilever beams, as listed in Table 3. There were some differences between
Ed1 and Ed2 , but all of the differences are less than 11.2%, and less than 10.0% reported
by Zheng et al. [42]. Therefore, it was an effective way to obtain the dynamic elastic
modulus of concrete with some damage, and the flexural dynamic stiffness of specimens
were determined by Equation (10). Compared with NCB, the flexural dynamic stiffness
calculated with Ed1 and Ed2 of PRCB with 20% rubber content reduced by less than 15.0%
and 11.6%. The flexural dynamic stiffness calculated with Ed2 reduced by 41.8% for NCB
with the stress level of 0.8 and about 43.1–47.2% for RUCB (PRCB).
The effects of stress level on the damage (degeneration of flexural dynamic stiffness,
DI = 1 − EI) of these specimens are shown in Figure 11. Notably, the values of DI
were approximate at the same stress level when the rubber content changed from 5% to
20%. This is understandable since the stress level has already included the influential
factor of rubber content on the stiffness. Generally, the increase of stress level will lead
to further concrete damage. During the concrete failure process, the redistribution of
microstructure and stress is happening for each micro unit of concrete, and the rigid element
transforms into the plastic element gradually with the increase of cumulative damage [60].
Therefore, the specimen can bear greater strength, but the stiffness reduces significantly.
Kaewunruen et al. [21], Najim and Hall [43], and Akono et al. [61] reported that there was
a correlation between stiffness (dynamic elastic modulus) and the compressive strength of
concrete. According to much research into concrete fatigue behavior and the performance of
damaged concrete, the stress level was an important parameter of concrete damage [62,63].
As shown in Figure 11, the data are limited by the number of experimental groups, but the
trend of DI with the increase of stress level is similar to the typical curve of stiffness in the
shape of an inverted “S”.lation between stiffness (dynamic elastic modulus) and the compressive strength of con-
crete. According to much research into concrete fatigue behavior and the performance of
damaged concrete, the stress level was an important parameter of concrete damage
[62,63]. As shown in Figure 11, the data are limited by the number of experimental groups,
Materials 2021, 14, 2183 14 of 19
but the trend of DI with the increase of stress level is similar to the typical curve of stiffness
in the shape of an inverted “S”.
Figure 11.
Figure The test
11. The test values
values of
of DI
DI and
and prediction
prediction equation.
equation.
In this test, the relationship of DI and stress level can be expressed with a cubic
equation, as shown in Figure 11. With this equation, the trend of DI with the increase of
stress level can be predicted approximately, and the predicted point of inflection is 0.275
near the cracking stress level of concrete, which is as expected. This also confirms using
the stress level to predict concrete damage related to the increase of the load.
3.3.4. Damping Ratio
As the typical logarithmic attenuated curves of the acceleration obtained in this test
show in Figure 9, the decay of acceleration increases with the increase of rubber content
and stress level. The energy dissipation capacity of the specimens increased with the
increase of rubber content and stress level. The damping ratio quantitatively expresses the
energy dissipation capacity of concrete, and is determined based on these curves of the
acceleration with Equation (8).
The pretreatment of rubber particles had little influence on the damping ratio in this
test. The cantilever beams exhibited an obvious increase in damping ratio with the increase
of rubber content and stress level. Compared with NCB, the damping ratio increased
10.6%, 24.5%, 44.4%, and 59.8% for RUCB and 6.3%, 19.5%, 40.5%, and 55.5% for PRCB
when the rubber content was 5%, 10%, 15%, and 20%, respectively. In some reported
references [26,42] under similar test conditions for undamaged specimens, the rise of
damping ratio with the increase of rubber content was approximately the same. When the
stress level was 0.6 and 0.8, the damping ratio increases by 60.0% and 179.7% for NCB, as
well as 70–170% and 200–300% for RUCB and PRCB with 5–20% rubber content.
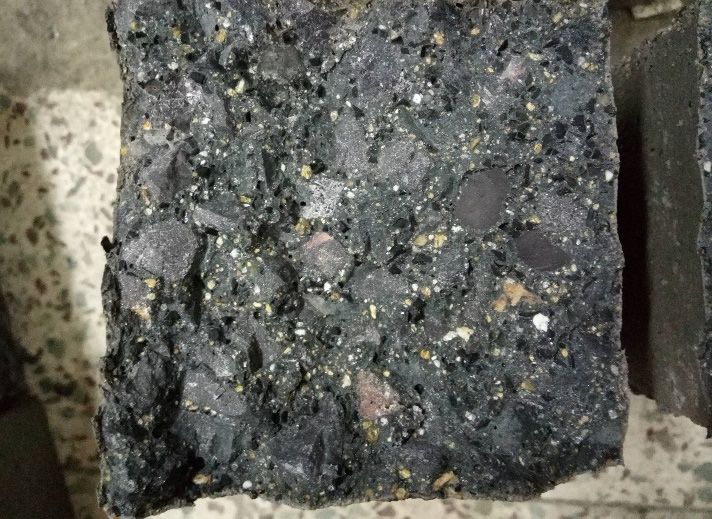
The addition of rubber particles will enhance the viscous energy dissipation capability
of the cement matrix composite [39,40]. A large number of micro-interfaces were formed
between rubber particles and the cement matrix because of the poor bonding between
them [56,57], and the rubber particles distributed on the micro-interface of concrete in-
creased Coulomb friction damping. Therefore, the damping ratio of PRC increased with
the increase of rubber content, as shown in Figure 12.
In general, the higher the strength of concrete, the relatively worse are its deformation
and dynamic properties [50,54]. The damping ratio of the specimen increases significantly
with the increase of pretreated rubber content. It has been indicated that the compressive
strength of PRC with 15% rubber content had reached 14.8% below that of NC. Therefore,
the method of the superficial pretreatment of rubber particles provided in this paper can
improve the strength of RUC to a certain extent, and ensure the original deformation and
dynamic properties of RUC. In the field of current civil engineering where the requirement
of strength is not too high, and the deformation and dynamic properties requirements are
relatively strict, PRC has a good prospect of application.as well as 70–170% and 200–300% for RUCB and PRCB with 5%–20% rubber content.
The addition of rubber particles will enhance the viscous energy dissipation capabil-
ity of the cement matrix composite [39,40]. A large number of micro-interfaces were
formed between rubber particles and the cement matrix because of the poor bonding be-
Materials 2021, 14, 2183 tween them [56,57], and the rubber particles distributed on the micro-interface of concrete
15 of 19
increased Coulomb friction damping. Therefore, the damping ratio of PRC increased with
the increase of rubber content, as shown in Figure 12.
Figure 12. The test values of the damping ratio and prediction equation.
Thegeneral,
In increasetheof damping
higher the ratio is slightofinconcrete,
strength the elasticthe
andrelatively
elastic–plastic
worsestage
are before the
its defor-
specimen
mation cracking
and dynamic (σMaterials 2021, 14, 2183 16 of 19
• The pretreatment of rubber particles with sodium hydroxide enhanced the strength,
the ductility, and crack resistance of the rubberized concrete, and the optimum content
of pretreated rubber particles was about 15%.
• With the same mix proportion, the concrete dynamic elastic modulus was larger
than the static elastic modulus, and the reduction of dynamic elastic modulus was
smaller than that of static elastic modulus with the increase of rubber content. Both
the anti-vibration and deformation of PRC were more satisfactory than that of NC.
• The natural frequency and flexural dynamic stiffness of PRCB decreased significantly
with the increase of cumulative damage, and the stiffness curve was in the shape of an
inverted “S” with a point of inflection near the cracking stress level.
• Both the rubber content and the cumulative damage affected the concrete damping
ratio significantly, and the damping ratio showed linear growth with the increase
of DI (less than 0.8) and rubber content, respectively. PRC is a good choice where
the requirement of strength is not too high, and the deformation as well as dynamic
properties are relatively strict.
The research of dynamic properties presented in this paper is of great significant for
reference to evaluate the dynamic properties of rubberized concrete with some damage.
Moreover, considering the limitation of the test data, improvement of the test setup and
specimens, to verify further applicability and validity of the method to measure the concrete
dynamic properties, the extended numerical tests are the focus of our next work.
Author Contributions: Conceptualization, A.C. and X.H.; validation, X.H. and Z.W.; formal analysis,
X.H.; investigation, X.H. and T.G.; data curation, A.C.; writing—original draft preparation, X.H.;
writing—review and editing, A.C. and X.H. All authors have read and agreed to the published
version of the manuscript.
Funding: This research was funded by the Science and Technology Innovation Team of Henan
Province, China, grant number 15IRTSTHN028, the NCWU Innovation Funds for Doctoral Candidate
and the Natural Science Foundation of China, grant number U1404526; 51878274.
Institutional Review Board Statement: Not applicable.
Informed Consent Statement: Not applicable.
Data Availability Statement: Data is contained within the article.
Conflicts of Interest: The authors declare no conflict of interest. The funders had no role in the design
of the study; in the collection, analyses, or interpretation of data; in the writing of the manuscript, or
in the decision to publish the results.
Nomenclature
NC Normal concrete
σ Concrete stress level
Mr Flexural cracking moment
EI Dimensionless flexural dynamic stiffness
σc The sectional concrete maximum compressive stress
NCB The cantilever beam produced with NC
PRCB The cantilever beam produced with PRC
RUC Rubberized concrete;
ξ Damping ratio
Mu Flexural ultimate moment
PRC Pretreated rubberized concrete
f Natural frequency
EI Flexural dynamic stiffness
DI Degeneration of flexural dynamic stiffness
σcu The concrete ultimate stress
RUCB The cantilever beam produced with RUCMaterials 2021, 14, 2183 17 of 19
References
1. Chen, M.; Zhong, H.; Zhang, M. Flexural fatigue behaviour of recycled tyre polymer fibre reinforced concrete. Cement Concr.
Compos. 2020, 105, 103441. [CrossRef]
2. Rodríguez, C.; Parra, C.; Casado, G.; Miñano, I.; Albaladejo, F.; Benito, F.; Sánchez, I. The incorporation of construction and
demolition wastes as recycled mixed aggregates in non-structural concrete precast pieces. J. Clean. Prod. 2016, 127, 152–161.
[CrossRef]
3. Huang, Z.; Sui, L.; Wang, F.; Du, S.; Zhou, Y.; Ye, J. Dynamic compressive behavior of a novel ultra-lightweight cement composite
incorporated with rubber powder. Compos. Struct. 2020, 244, 112300. [CrossRef]
4. Gupta, T.; Siddique, S.; Sharma, R.K.; Chaudhary, S. Behaviour of waste rubber powder and hybrid rubber concrete in aggressive
environment. Constr. Build. Mater. 2019, 217, 283–291. [CrossRef]
5. Hesami, S.; Salehi Hikouei, I.; Emadi, S.A.A. Mechanical behavior of self-compacting concrete pavements incorporating recycled
tire rubber crumb and reinforced with polypropylene fiber. J. Clean. Prod. 2016, 133, 228–234. [CrossRef]
6. Onuaguluchi, O.; Banthia, N. Long-term sulfate resistance of cementitious composites containing fine crumb rubber. Cement
Concr. Compos. 2019, 104, 103354. [CrossRef]
7. Xie, J.; Zheng, Y.; Guo, Y.; Ou, R.; Xie, Z.; Huang, L. Effects of crumb rubber aggregate on the static and fatigue performance of
reinforced concrete slabs. Compos. Struct. 2019, 228, 111371. [CrossRef]
8. Aly, A.M.; El-Feky, M.S.; Kohail, M.; Nasr, E.-S.A.R. Performance of geopolymer concrete containing recycled rubber. Constr.
Build. Mater. 2019, 207, 136–144. [CrossRef]
9. Ho, A.C.; Turatsinze, A.; Hameed, R.; Vu, D.C. Effects of rubber aggregates from grinded used tyres on the concrete resistance to
cracking. J. Clean. Prod. 2012, 23, 209–215. [CrossRef]
10. Chen, M.; Zhong, H.; Wang, H.; Zhang, M. Behaviour of recycled tyre polymer fibre reinforced concrete under dynamic splitting
tension. Cement Concr. Compos. 2020, 114, 103764. [CrossRef]
11. Bravo, M.; de Brito, J. Concrete made with used tyre aggregate: Durability-related performance. J. Clean. Prod. 2012, 25, 42–50.
[CrossRef]
12. Guo, J.; Huang, M.; Huang, S.; Wang, S. An experimental study on mechanical and thermal insulation properties of rubberized
concrete including its microstructure. Appl. Sci. 2019, 9, 2943. [CrossRef]
13. Zhang, B.; Poon, C.S. Sound insulation properties of rubberized lightweight aggregate concrete. J. Clean. Prod. 2018, 172,
3176–3185. [CrossRef]
14. Strukar, K.; Kalman Šipoš, T.; Miličević, I.; Bušić, R. Potential use of rubber as aggregate in structural reinforced concrete
element—A review. Eng. Struct. 2019, 188, 452–468. [CrossRef]
15. Mohammadi, I.; Khabbaz, H. Shrinkage, performance of Crumb Rubber Concrete (CRC) prepared by water-soaking treatment
method for rigid pavements. Cement Concr. Compos. 2015, 62, 106–116. [CrossRef]
16. Aslani, F.; Ma, G.; Yim Wan, D.L.; Muselin, G. Development of high-performance self-compacting concrete using waste recycled
concrete aggregates and rubber granules. J. Clean. Prod. 2018, 182, 553–566. [CrossRef]
17. Miller, N.M.; Tehrani, F.M. Mechanical properties of rubberized lightweight aggregate concrete. Constr. Build. Mater. 2017, 147,
264–271. [CrossRef]
18. Khusru, S.; Fawzia, S.; Thambiratnam, D.P.; Elchalakani, M. A parametric study: High performance double skin tubular column
using rubberised concrete. Compos. Struct. 2020, 235, 111741. [CrossRef]
19. Duarte, A.P.C.; Silvestre, N.; de Brito, J.; Júlio, E. Numerical study of the compressive mechanical behaviour of rubberized
concrete using the extended finite element method (XFEM). Compos. Struct. 2017, 179, 132–145. [CrossRef]
20. Issa, C.A.; Salem, G. Utilization of recycled crumb rubber as fine aggregates in concrete mix design. Constr. Build. Mater. 2013, 42,
48–52. [CrossRef]
21. Pham, N.P.; Toumi, A.; Turatsinze, A. Rubber aggregate-cement matrix bond enhancement: Microstructural analysis, effect on
transfer properties and on mechanical behaviours of the composite. Cement Concr. Compos. 2018, 94, 1–12. [CrossRef]
22. Al-Tayeb, M.M.; Abu Bakar, B.H.; Akil, M.H.; Ismail, H. Performance of rubberized and hybrid rubberized concrete structures
under static and impact load conditions. Exp. Mech. 2012, 53, 377–384. [CrossRef]
23. Al-Tayeb, M.M.; Abu Bakar, B.H.; Ismail, H.; Akil, M.H. Effect of partial replacement of sand by fine crumb rubber on impact
load behavior of concrete beam: Experiment and nonlinear dynamic analysis. Mater. Struct. 2013, 46, 1299–1307. [CrossRef]
24. Al-Tayeb, M.M.; Abu Bakar, B.H.; Ismail, H.; Akil, H.M. Effect of partial replacement of sand by recycled fine crumb rubber on
the performance of hybrid rubberized-normal concrete under impact load: Experiment and simulation. J. Clean. Prod. 2013, 59,
284–289. [CrossRef]
25. Gupta, T.; Siddique, S.; Sharma, R.K.; Chaudhary, S. Effect of elevated temperature and cooling regimes on mechanical and
durability properties of concrete containing waste rubber fiber. Constr. Build. Mater. 2017, 137, 35–45. [CrossRef]
26. Gurunandan, M.; Phalgun, M.; Raghavendra, T.; Udayashankar, B.C. Mechanical and damping properties of rubberized concrete
containing polyester fibers. J. Mater. Civ. Eng. 2019, 31, 04018395. [CrossRef]
27. Mohammadi, I.; Khabbaz, H.; Vessalas, K. Enhancing mechanical performance of rubberised concrete pavements with sodium
hydroxide treatment. Mater. Struct. 2016, 49, 813–827. [CrossRef]
28. Muñoz-Sánchez, B.; Arévalo-Caballero, M.J.; Pacheco-Menor, M.C. Influence of acetic acid and calcium hydroxide treatments of
rubber waste on the properties of rubberized mortars. Mater. Struct. 2017, 50, 75. [CrossRef]You can also read