EFAS Bulletin European Flood Awareness System
←
→
Page content transcription
If your browser does not render page correctly, please read the page content below
European Flood Awareness System

EFAS Bulletin
August – September 2021
Issue 2021(5)
EUROPEAN FLOOD AWARENESS SYSTEM: Bimonthly Bulletin – Issue 2021(5)

NEWS                                                           RESULTS
Event Reminder                                                 Summary of EFAS Flood and Flash Flood Notifications
Copernicus Emergency Management Service Week
                                                               The three formal and 23 informal EFAS flood
                                                               notifications issued in August - September are
                                                               summarised in Table 1. The locations of all
                                                               notifications are shown in Figure 48 and Figure 50 in
                                                               the appendix.

                                                               47 Flash flood notifications were issued in August -
                                                               September. They are summarised in Table 2. The
                                                               locations of all notifications are shown in Figure 49
                                                               and Figure 51 in the appendix.

Figure 1: CEMS Week 2021                                       Meteorological situation

The European Commission is organising the virtual              by EFAS Meteorological Data Collection Centre
event CEMS Week on the 25 – 29 Oct, 2021. The
morning sessions will take place at 9:00-12:45 and the         August
                                                               August 2021 was characterized by higher than normal
afternoon session at 14:00-17:15 CET.
                                                               sea surface pressure over the northern Atlantic Ocean
CEMS Week brings together experts, users and policy            and Russia, and close to normal sea surface pressure
makers to participate in a discussion about the future         anywhere else across the EFAS domain. Monthly
of our service and user community.Take part in live            precipitation totals were above the long-term mean in
virtual-sessions and -workshops from each of our               central and eastern Europe and mainly below in the
                                                               other parts of the EFAS domain. Monthly mean
service components, including the launch of the Global
                                                               temperatures were below the long-term mean in
Flood Monitoring product and the adoption of the
                                                               northern and central Europe and above over the
Global Human Settlement Layer as new service                   remaining part of the EFAS domain.
component.

The presentations on Day 1 (Monday, 25 October) are            At the beginning of August, the Azores high was around
                                                               its typical location and an upper-level trough extended
open to the public. Please follow this link to join the
                                                               from the Artic Ocean via Scandinavia over the Bay of
event. Participation for the other days is by invitation
                                                               Biscay with weak low-pressure cores at the surface
only. Ton find out more about the event, including the         over southern Scandinavia and northeast Russia.
agenda, click here. Keep a lookout and follow our              Surface pressure gradients in the southern and eastern
activities on Twitter @CopernicusEMS. We hope you              parts of the EFAS domain were weak and conditions
can join us for this virtual event!                            were normal. Within the next days, the trough shifted
                                                               eastward and a low-pressure system developed over
                                                               the Baltic Sea. It intensified along its north-eastward
New features                                                   track and disappeared reaching the Barents Sea.
                                                               Another low-pressure system developed over the
Three new EFAS partners                                        Atlantic Ocean and moved towards Great Britain and
We gladly welcome the Lower Saxony Water                       Ireland. It remained active for several days until it
Management, Coastal Defence and Nature                         disappeared. At the same time, a weak upper-level
Conservation Agency, Germany as new EFAS full                  low-pressure system developed over South-eastern
partner as well as the Civil protection Emilia Romagna,        Europe and Anatolia. It is associated with heavy
Italy and the Swiss Federal Railway Company,                   rainfalls at the southern coast of the Black Sea, which
Switzerland as new EFAS third party partners.                  caused flash floods. Another low-pressure system
                                                               developed in the lee of Greenland and it moved north

                                                           2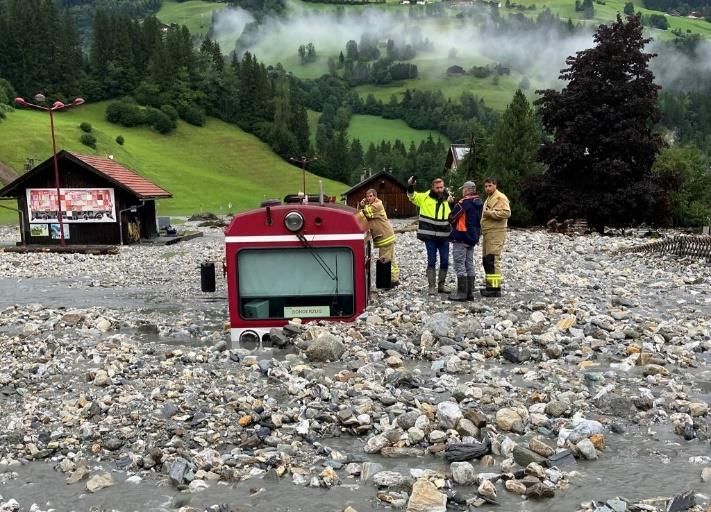
EUROPEAN FLOOD AWARENESS SYSTEM: Bimonthly Bulletin – Issue 2021(5)

of Great Britain and Ireland to Scandinavia. One more           September
low-pressure system moved along a slightly southward            September 2021 was characterized by higher than
track from the Atlantic Ocean to southern Scandinavia.          normal sea surface pressure over Scandinavia and
It caused, forced by orography, heavy precipitation and         close to normal sea surface pressure anywhere else
flash floods at the Alps. Again, a weak upper-level low-        across the EFAS domain. Monthly precipitation totals
pressure system was cut-off and moved to the Black              were above the long-term mean in the western and
Sea. Another low-pressure system, mainly visible in the         eastern regions, and mainly below the long-term mean
upper levels, moved from the Atlantic Ocean via                 in the central and southern parts of the EFAS domain.
central to eastern Europe. In the next days, the Azores         Monthly mean temperatures were below the long-
high extended northwards reaching the Norwegian Sea             term mean in the northern and eastern parts, and
and was later located over Great Britain and Ireland. A         above the long-term mean over the southern and
low-pressure system developed at the eastern edge of            western parts of the EFAS domain.
this high-pressure system over northern Scandinavia. It
moved slightly southwards, but the associated upper-            At the beginning of September, a high-pressure system
level trough extended to the western Mediterranean              was located over Great Britain and Ireland. A low-
region and caused heavy rainfalls in France and Spain.          pressure system was situated over the Barents Sea and
The low-pressure system moved further to central and            other weak systems over eastern Europe and
eastern Europe and remained active in this region until         westward of the Iberian Peninsula. The last-mentioned
the end of the month. Another low-pressure system               low-pressure system moved to the central
developed over the Atlantic Ocean and arrived at the            Mediterranean Sea and brought intense rainfall,
Iberian Peninsula at the end of August, so it became            associated with floods, along its track. The low-
more prevalent in September.                                    pressure system located over the Barents Sea moved
                                                                to northwest Russia and remained active for a few
The highest precipitation totals were observed in the           more days. A new high-pressure system formed over
Alps, western Carpathian Mountains, across most of              southern Scandinavia and moved south-eastwards to
eastern Europe, and in localised areas surrounding              the Caspian Sea. A low-pressure system developed
Black Sea (Figure 34). No or almost no precipitation fell       over the Atlantic Ocean and moved to the west of the
north of the Caspian Sea, in western Anatolia, over the         Iberian Peninsula. Then, it changed its direction to
eastern and southern parts of the Mediterranean Basin           move across Great Britain and Ireland to Scandinavia,
(except for the Atlas Mountains), Cyprus, Crete, Sicily,        where it disappeared. Another low-pressure system
and southern Iberian Peninsula. Monthly precipitation           moved from the Atlantic Ocean to the Iberian
totals above the long-term mean occurred in central             Peninsula and went up in an existing weak trough. This
and eastern Europe and Scandinavia (excluding                   trough was associated with several heavy precipitation
southern Norway), central and eastern Anatolia,                 events over central and southwest Europe. One more
eastern Atlas Mountains and southeast Iberian                   low-pressure system developed over Jutland and
Peninsula (Figure 35). Monthly totals below the long-           moved to eastern Europe. At the same time, the Azores
term mean were reported over Iceland, southern                  high formed around its usual position. Another high-
Norway, to the north of the Caspian Sea and around              pressure system was established over the Kola
the Mediterranean Sea except the above-mentioned                Peninsula. An upper-level low-pressure system was cut
regions.                                                        off over the Bay of Biscay and moved to the Iberian
                                                                Peninsula, again associated with heavy precipitation.
The monthly mean air temperature ranged from -0.5°C             The low-pressure system located over eastern Europe
to 38.8°C with the highest values in the southern parts         moved over the northern Baltic Sea and intensified
of the EFAS domain. The lowest temperature values               there. It weakens soon as it moved towards Russia. A
were reported in the northern and mountainous parts             strong low-pressure system developed over the
of the domain (Figure 38). Air temperature anomalies            Greenland Sea and moved to Iceland, associated with
ranged from -10.9°C to 9.3°C (Figure 39). Monthly               strong winds. A new high-pressure system developed
mean air temperature values below the long-term                 over northeast Europe. A trough extended from a low-
mean occurred in central Europe and in Scandinavia,             pressure system located over Iceland towards Great
while positive air temperature anomalies appeared in            Britain and Ireland. A small low-pressure system was
the remaining part of the EFAS domain.                          cut-off and moved to Jutland by the end of the month.

                                                            3
EUROPEAN FLOOD AWARENESS SYSTEM: Bimonthly Bulletin – Issue 2021(5)

The Azores high was around its usual position and               southern Sweden, Iceland, Ireland, eastern Spain
another high-pressure system was located over                   (around the Jucar river basin and Catalonia) and Tiber
northeast Europe. A weak upper-level low-pressure               basin (central Italy).
system was located over the Black Sea.
                                                                Regarding stations registering values above the 90%
The highest precipitation totals were observed over             quantile,115 stations exceeded this value during
Iceland, the Norwegian coast, central France,                   August. The majority of these stations were located in
eastwards of the Black Sea, and over eastern Europe             central Europe throughout France, Germany,
(Figure 36). No or almost no precipitation fell over            Luxembourg, Switzerland, Belgium, and the
western Anatolia as well as the southern and south-             Netherlands, where the Rhine and Seine basins stood
eastern parts of the EFAS domain. Monthly                       out with nearly 33% of the total stations exceeding the
precipitation totals above the long-term mean                   90% quantile. Other basins surpassing this quantile
occurred mainly over eastern and northern Europe but            were the Scheldt, Rhône, Meuse, and Elbe. Another
also southwestern Europe and Anatolia (Figure 37).              portion of stations also exceeding the 90% quantile
Monthly totals below the long-term mean were                    (just over 22%) can be seen in the Vistula and Oder
reported mainly over central and southeast Europe, as           basins in Poland, and in the Danube basin through
well as over the southern and south-eastern parts of            Germany, Austria, Slovakia, Serbia, and Bosnia and
the EFAS domain.                                                Herzegovina. To a lesser degree, other stations over
                                                                their 90% quantile were in Spanish basins
The monthly mean air temperature ranged from -5.0°C             (Guadalquivir, Minho and Ebro) and in England where
to 36.9°C with the highest values in the southern parts         a many of the stations were located in the Thames
of the EFAS domain. The lowest temperature values               basin. Isolated stations exceeding the 90% quantile
were reported in the northern and mountainous parts             occurred in basins in Sweden, Norway, and in Ukraine
(Figure 40). Air temperature anomalies ranged from -            (Dnieper basin).
7.6°C to 10.0°C (Figure 41). Monthly mean air
temperature values above the long-term mean                     Finally, according to those stations registering values
occurred in western and southern parts of the EFAS              below the 10% quantile (41 in total), the highest
domain, while negative air temperature anomalies                concentration is located in southern Norway, where 13
appeared in the eastern and northern parts of the EFAS          stations reached these values. Secondly, and with a
domain.                                                         more dispersed pattern, we have several locations in
                                                                the western Ukraine (5 stations), in the centre of the
Hydrological situation                                          Danube basin ( 5 stations located in Serbia, Romania,
                                                                and Hungary), in the Oder basin in Poland (4 stations)
by EFAS Hydrological Data Collection Centre                     and in eastern Spain (4 stations). A lower density of
                                                                stations occurred in Belarus, the Rhine basin, northern
August                                                          Scandinavia, and England with 2 stations each. At last,
In August, the highest concentration of stations                we can also find isolated stations with values under the
exceeding their low threshold level is located in central       10% quantile in the Esla river (Spain) and the Muonio
Europe in the Po and Danube basins. Firstly, 20 per cent        river (Finland).
of stations which exceeded at least the first threshold
levels were in the Po river basin (northern Italy).             September
Regarding the Danube river basin, the highest                   In September, Poland was the country with the highest
concentration of stations with exceedances are located          concentration of stations exceeding their threshold
in its western regions (southern Germany and western            level (36 stations), with stations distributed in the
Austria), but there are some other isolated stations            Vistula and Oder basins. In Spain, 18 stations exceeded
located in Slovakia, Hungry, Serbia, Romania, and               their threshold, specifically in the east of the country
Croatia too. In Poland, some stations along the Vistula         (Llobregat, Ebro, Jucar, Turia, Seco, Algar, Barranc de
and the Oder river exceeded their thresholds also.              Torrent, and Serpis basins). Also remarkable is the
Lastly, in a more dispersed way, we can find one station        situation in the Po river basin in Italy, with exceedances
in the Elbe river basin and another in the Neman basin          in 16 stations, and the situation in central Italy, with
(Belarus), in the centre of Norway, central and                 one station in the Garigliano river basin. In Germany,

                                                            4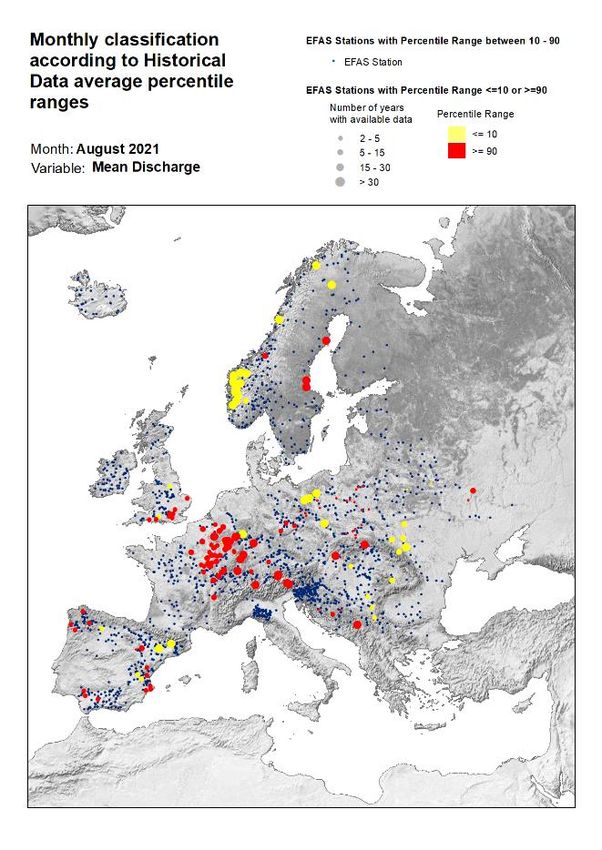
EUROPEAN FLOOD AWARENESS SYSTEM: Bimonthly Bulletin – Issue 2021(5)

the exceedances occurred in nine stations located in           Verification
the Danube river basin and one in the Elbe. In a more
dispersed way, the Danube basin contains three other
stations distributed across Austria and Croatia, and
along the border between Croatia and Serbia. Norway,
Iceland, Belarus, and Ukraine also experienced some
isolated stations exceeding thresholds.

Regarding stations registering values above the 90%
quantile, 160 stations exceeded this value in
September. The majority of these stations were
located in central Europe. Nearly 26% of these stations
were in the Danube basin throughout Austria, Serbia,
Slovakia, Germany, Czech Republic, Bulgaria, Hungary,
Romania, Serbia, and Ukraine. This is followed by the
Rhine basin with 18 stations in Switzerland, France, and
Luxembourg. It was also noteworthy in Spain, where
the following basins have stations which values are            Figure 2: EFAS CRPSS at lead-time 1 day for August-September
above the 90% quantile: Ebro (13 stations),                    2021, for catchments >2000km2. The reference score is
Guadalquivir, Minho, and Jucar. France is also notable         persistence of using previous day’s forecast.
with 19 stations surpassing the 90% quantile, mainly
located in the Loire basin. Another considerable
                                                               Figure 2 and Figure 3 shows the EFAS headline score,
number of stations also exceeding the 90% quantile             the continuous ranked probability skill score (CRPSS)
                                                               for lead times 1 and 5 days for August-September
can be seen in the Elbe, Dnieper, Oder, and Vistula
basins. To a lesser degree, other stations over their          across the EFAS domain for catchments larger than
90% quantile were in basins located in Norway,                 2000km2. A CRPSS of 1 indicates perfect skill, 0
Finland, Sweden, and England. Isolated stations                indicates that the performance is equal to that of the
exceeding the 90% quantile occurred in other stations          reference, and any value 2000km2. The reference score is
                                                               persistence of using previous day’s forecast.

                                                           5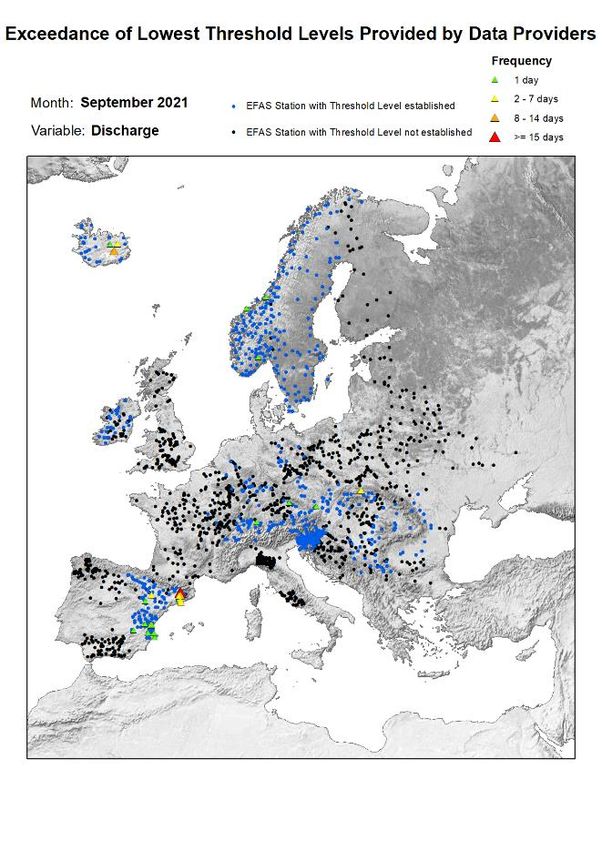
EUROPEAN FLOOD AWARENESS SYSTEM: Bimonthly Bulletin – Issue 2021(5)
These maps indicate that across much of Europe for ARTICLES
forecasts are more skilful than persistence at both lead
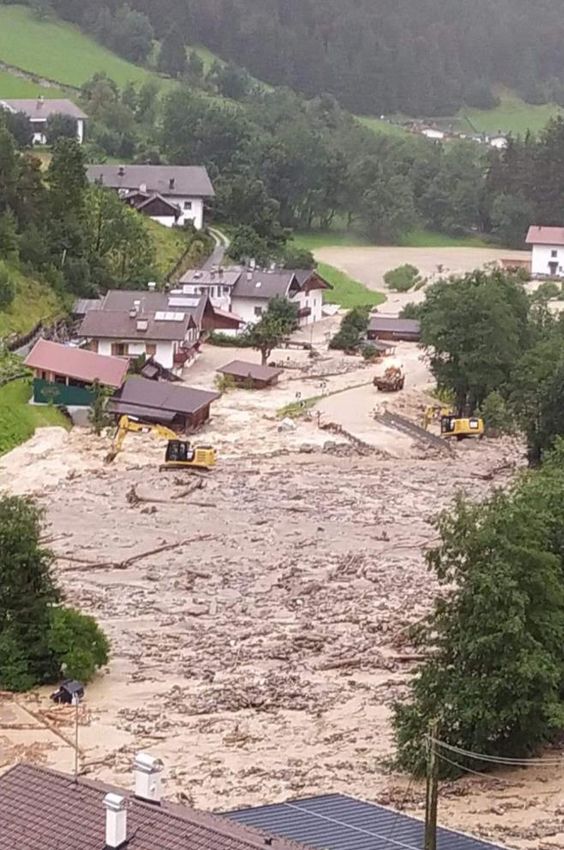
times. Regions shown in blue are those where EFAS Flash Floods in Southern Germany, Austria, and
forecasts are more skilful than persistence, with darker Northern Italy - August 2021
shading indicating better performance.
by Richard Davies, floodlist
The skill of the forecast was quite good over the period,
and similar to the same period last year (Figure 4). An Flash flooding caused severe damage and prompted
inter-annual variability of the scores is to be expected. numerous high-water rescues in Alpine regions of
The long-term trend is neutral over the first two years Germany, Austria, and northern Italy in mid-August.
since the domain was extended, but there is an
indication of increase in skill with EFAS 4.0, especially
for the areas with generally lower skill.
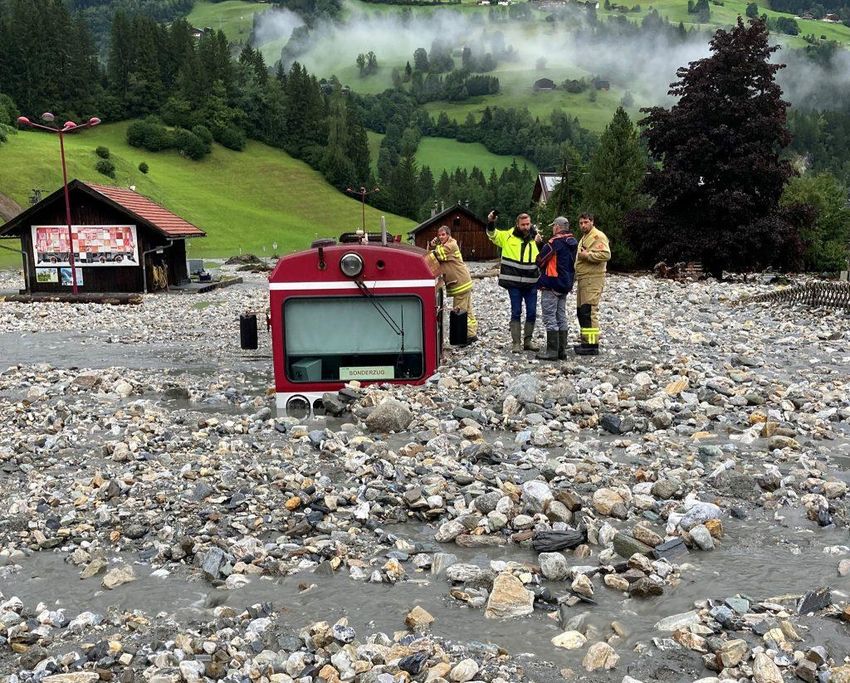
Figure 5: The Krimml station, track and a train of the Pinzgauer
local railway in Wald im Pinzgau were completely buried.
Photo Wald Municipality
Figure 4. Monthly means of CRPSS the for lead-time 5 days for
all the major river points in Europe with ECMWF ENS as forcing.
Germany
Reference forecast was climatology. The skill is largest during
the winter months, when there is less variation in the flow in In Germany, heavy rain on 16 August triggered floods
large parts of Europe. The blue line indicates the release of in Grainau in Garmisch-Partenkirchen district,
EFAS 4.0. southern Bavaria. Police reported 12 hikers were
swept away or stranded after the flooding.
Hammersbach stream swept through the narrow
Publications Höllental gorge situated at the foot of the Zugspitze,
the highest peak of the Wetterstein Mountains.
Skøien, J. O; Bogner, K; Salamon, P & Wetterhall, F.
(2021). On the Implementation of Postprocessing of A team of around 150 rescue workers was deployed to
Runoff Forecast Ensembles. Journal of the area. As of 16 August, eight people had been
Hydrometeorology, Volume 22 (10), 2731-2749. DOI: rescued, while the body of one person had been found
https://doi.org/10.1175/JHM-D-21-0008.1 and one was still missing.
Austria
Heavy rain in parts of Salzburg State in Austria from 16
August caused mudslides and flash floods in the
Pongau and Pinzgau regions. The small city of Sankt
6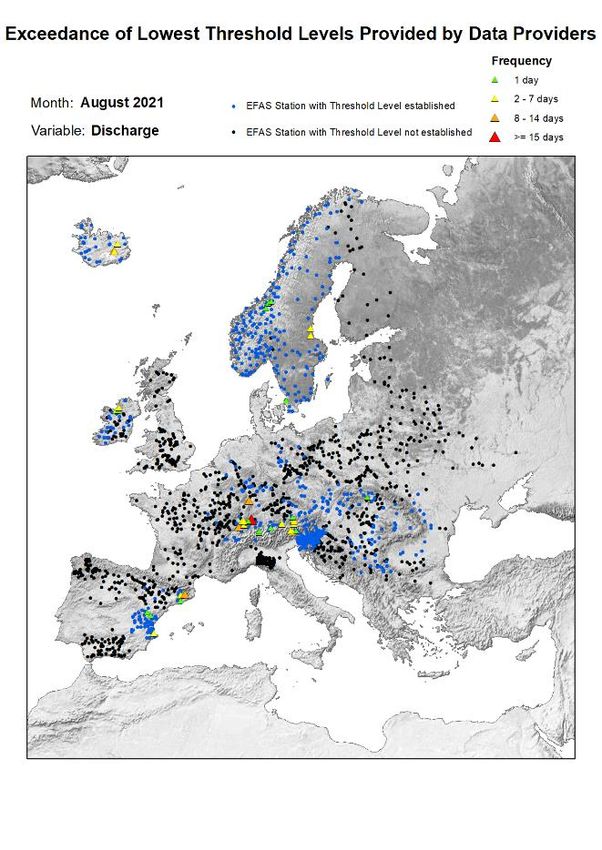
EUROPEAN FLOOD AWARENESS SYSTEM: Bimonthly Bulletin – Issue 2021(5)

Johann im Pongau recorded 36 mm of rain in one hour                    Sankt Johann im Ahrntal recorded 43mm of rain in one
and 51 mm in two hours on 16 August 2021.                              hour on 16 August 2021.

Figure 6: Floods in St Johann Austria, 16 August 2021. Photo: St
Johann Feuerwehr

Emergency teams including 1,400 firefighters and
around 70 high water rescue specialists carried out
around 500 interventions. Salzburg Water Rescue
Service said it was lucky nobody was killed considering
the severity of the situation.

In Dienten municipality in Pinzgau, three people were
rescued by firefighters after a bus and a car were both
swept into a stream by a mudslide. All three people
suffered injuries, one of them was eriously injured.
Approximately 90 people were rescued in areas around
Sankt Johann im Pongau.

The Krimml train station, track, and a train of the                    Figure 7: Floods in Pflersch, South Tyrol, Italy, 16 August 2021
                                                                       Vigili Del Fuoco Volontari Fleres (Freiwillige Feuerwehr
Pinzgauer local railway in Wald im Pinzgau were
                                                                       Pflersch)
completely buried in rocks and flood debris. Areas of
the town were also badly affected, and residents had
to evacuate with the assistance of the Federal Army.                   Feedback on EFAS Notifications for 2020

Parts of the states of Lower Austria, Styria, and Tyrol                by Marc Girons Lopez, EFAS Dissemination Centre
also reported storm damage.                                            Formal Flood Notifications are the core of EFAS and it
Austria                                                                is therefore important that they are as accurate and
The severe weather also caused damage in parts of                      relevant to the EFAS partners as possible. To this end,
                                                                       partner feedback is collected and analysed yearly. This
South Tyrol Province of northern Italy on 16 August.
                                                                       way, potential weak spots can be identified and future
The communes of Ahrntal and Pflersch were the worst
                                                                       developments of EFAS prioritised. The feedback
affected. Firefighters responded to 200 incidents,
                                                                       submitted during 2020 is presented and analysed here
including flooded buildings and roads. Thirty people                   together with feedback statistics from previous years
were evacuated after floods and mudslides in areas of                  (2016 – 2019).
Pflersch.

                                                                   7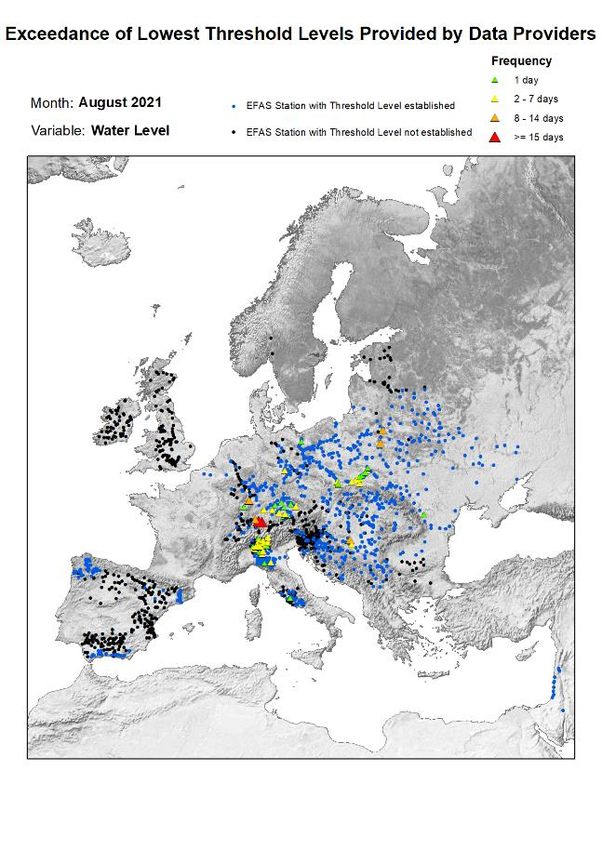
EUROPEAN FLOOD AWARENESS SYSTEM: Bimonthly Bulletin – Issue 2021(5)

Figure 8: Percentage of EFAS Formal Flood Notifications for which feedback was provided for 2020, aggregated per country (in
colour). The total number of Formal Flood Notifications sent for each country during 2020 is shown on the map. EFAS partner
countries for which no Formal Flood Notifications were issued during 2020 are shaded in grey.

With the implementation of the new system in 2019,               feedback form are not mandatory, some statistics may
the entire feedback collection system is now                     be based on a lower number of responses.
integrated in the EFAS-IS platform and partners may
submit feedback directly from the link embedded in               Summary of received feedback during 2020
Formal Flood Notifications. If no feedback is provided           A total of 240 Formal Flood Notifications were sent out
within a reasonable time, a reminder is sent to the              during 2020 and 99 feedback reports were received,
                                                                 which accounts for 41% of all issued Formal Flood
relevant partner. Quality control managers at
                                                                 Notifications. This is the same percentage as for 2019
Rijksvaterstaat (RWS), Slovak hydrometeorological
                                                                 but a decrease compared to the year before (71%).
institute (SHMU), and Swedish Meteorological and                 Even if no detailed survey was performed on the
Hydrological Institute (SMHI) are responsible for                reasons why partners did (not) provide feedback, it is
monitoring the collection of feedback for Formal Flood           conceivable that the decrease and following stagnation
Notifications.                                                   in feedback reporting was due to, first, the transition
                                                                 to a new feedback reporting system and, second, the
Even if the following analysis focuses on feedback
                                                                 significant increase in the number of Formal Flood
provided for Formal Flood Notifications sent during
                                                                 Notifications being sent, which puts more load on
2020, it builds up on feedback statistics since 2016.
                                                                 partners. Even so, the provided feedback rate varied
However, since feedback collection has been
                                                                 significantly among EFAS partners.
continuously improving throughout the years, the
completeness of some questions in this analysis may
vary. Additionally, since some of the questions in the

                                                             8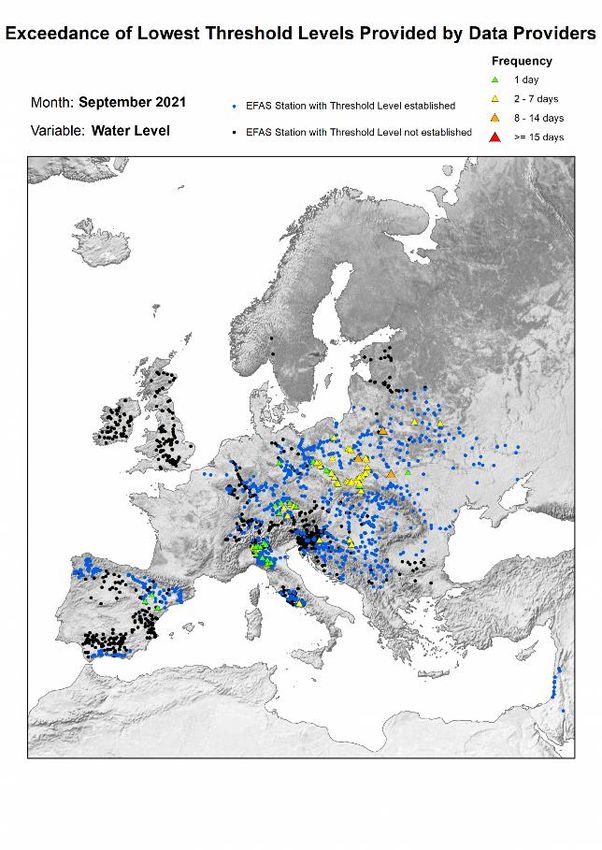
EUROPEAN FLOOD AWARENESS SYSTEM: Bimonthly Bulletin – Issue 2021(5)

                                                                    from 2019 (61%) and is related to a decrease in
                                                                    reported events being “In the wider region”. Overall,
                                                                    the location accuracy during 2020 was comparable to
                                                                    that of 2017 and 2018, and significantly better than
                                                                    that         of        2016        and         2019.

Figure 9: Issued EFAS Formal Flood Notifications and received
feedback reports.

The initial question in the feedback form is whether or
not a flood event was observed in connection with a
given Formal Flood Notification. The definition of a
flood event is included in the question to help partners
assess the event (i.e. return period equal or larger than           Figure 11: EFAS performance in terms of accurately predicting
2 years). The 2-year return period was chosen as a                  the location of an event.
definition for flood here as it allows to differentiate
between correct rejections and flood events that                    Regarding the timing of the onset of the event, 34% of
happened but did not reach the 5-year return period                 the participants stated that the start of the flood event
threshold used in EFAS. In total, 38 out of 99                      happened on the day predicted by EFAS. This
participants (38%) answered that a flood event was                  represents a significant decrease with respect to 2019
observed after a Formal Flood Notification had been                 (61%) and 2016 (66%), which corresponds to an
sent out. This value is significantly lower than that from          increase in those events that started 1-2 days earlier
2019 (61%), indicating an increased number of false                 than predicted and ≥ 3 days later than predicted. Even
alarms.                                                             if no clear pattern in forecast timing can be identified
                                                                    for the reported events in 2020 as a whole, the
                                                                    increase in the number of events that started earlier
                                                                    than EFAS predicted may limit reaction time, especially
                                                                    since Formal Flood Notifications may be sent with
                                                                    relatively short notice (at least with 48 hours in
                                                                    advance of the predicted start of an event).

Figure 10: Participants responses to the question “Was the
flood event observed?” of the feedback form.

The feedback form is adapted to whether a flood event
was observed in connection to a given Formal Flood
Notification or not, so relevant information for each
case can be collected. Next, we are going to cover the              Figure 12: EFAS performance in terms of accurately predicting
feedback from those notifications for which a flood                 the onset time of an event.
event was observed.
                                                                    Looking instead at the timing of the peak flow, the
                                                                    difference is in this case not so large with respect to
Feedback from observed flood events
                                                                    2019. Indeed, a similar number of participants stated
Most of the participants who answered that a flood
                                                                    that the flood peak was observed on the predicted day
event had indeed occurred in connection to an issued
                                                                    (40%) or 1-2 days earlier than predicted (25%).
Formal Flood Notification rated the accuracy of the
                                                                    Nevertheless, while in 2019 EFAS had a clear tendency
EFAS information in terms of location as “As indicated
                                                                    to predict the peak flow too late, under 2020 EFAS
in EFAS information” (76%). This is an improvement

                                                                9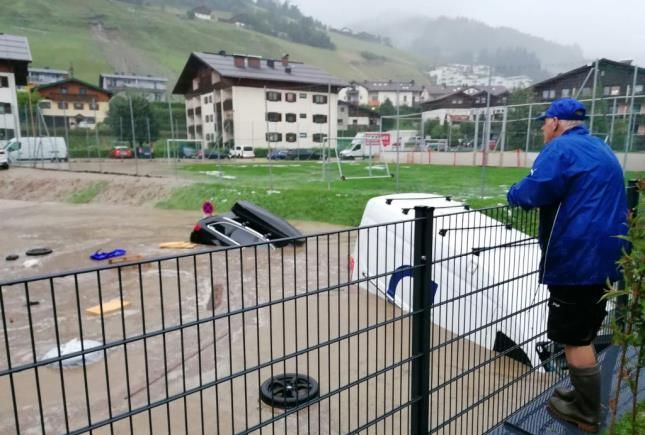
EUROPEAN FLOOD AWARENESS SYSTEM: Bimonthly Bulletin – Issue 2021(5)

predicted the peak too early for a significant number                different parts of Europe. Nevertheless, considering
of reported events (21%), which corresponds well with                that one of the criteria for issuing Formal Flood
the statistics shown for the timing of onset. This                   Notifications is that the lead time to the onset of an
question was first introduced with the new integrated                event needs to be longer than 48 hours, it is significant
feedback reporting system and no data is therefore                   that so many notifications result in much shorter lead
available prior to 2019.                                             times, giving very little reaction time in some cases.
                                                                     This change from previous years may be correlated
                                                                     with the increase number of events that were
                                                                     predicted 1-2 days too late (see previous figure
                                                                     regarding timing of onset). It is also important to notice
                                                                     here the significant fraction of events that were
                                                                     predicted with 9 or more lead days.

Figure 13: EFAS performance in terms of accurately predicting
the peak time of an event.

In terms of the peak magnitude of predicted events,
24% of participants reported that the actual flood
magnitude was comparable to the EFAS predicting.
Additionally, 45% answered that the magnitude was                    Figure 15: Participants response to the question “What was the
less or much less severe than the EFAS prediction, and               actual lead time?” of the feedback form.
22% stated that the flood was more or much more
                                                                     Regarding the severity of the reported flood events,
severe than the EFAS prediction. While the distribution
                                                                     42% of participants stated that the return period of the
is, at large, comparable to that of 2019, during 2020
                                                                     event was less than a 5-year flood. Since the criterion
there was a significant increase of events whose peaks
                                                                     for sending out a Formal Flood Notification requires an
were significantly overestimated by EFAS predictions.
                                                                     exceedance of a 5-year return period for runoff, it is
While it can be considered positive that EFAS does not
                                                                     remarkable that so many events were reported to be
tend to underestimate the peak flow magnitude, the
                                                                     less severe than that. Additionally, when compared to
values for 2020 are far from those from 2018, where
                                                                     previous years, during 2020 there was a significant
close to 60% of participants reported that the peak
                                                                     increase in severe floods (return periods between 20
magnitude was comparable to the EFAS prediction.
                                                                     and 99 years, 21%).

Figure 14: EFAS performance in terms of accurately predicting        Figure 16: Participants response to the question “What is the
the peak magnitude of an event.                                      return period of the observed flood event?” of the feedback
                                                                     form.
The lead time of EFAS notifications varied greatly
between the different flood events, with most                        It is however important to notice here that the time
notifications being sent up to three days before the                 periods that partners use to calculate return periods
actual start of the event. This should not come to a                 may vary significantly from EFAS. For instance, the 5-
surprise given the large differences in predictability of            year return period in EFAS is often lower than the 5-
different weather patterns leading to flooding in                    year return period threshold that is used in Sweden by

                                                                10
EUROPEAN FLOOD AWARENESS SYSTEM: Bimonthly Bulletin – Issue 2021(5)
the SMHI. This may be due to the quality of historical
forcing data, the hydrological model performance, and
the different time periods used in the return period
analysis. In addition, EFAS based return periods are
calculated based on simulated discharges, whereas
partners are more likely to base their thresholds on
discharge observations. Calculating return periods
from simulated discharge values may lead to
systematic biases between observed and simulated
Figure 18: Participants response to the question “How would
discharge values at certain locations. Consequently, it you rate the added value of the forecast?” of the forecast form.
would be better for the partners to evaluate the A value of 1 corresponds to little to no added value while a
Formal Flood Notifications including also a comparison value of 5 corresponds to a significant added value.
between simulated discharge in EFAS and their
recorded observed discharge values. Feedback from non-observed flood events
If no flood was observed in connection with a given
The main drivers behind flood events in 2020 (highest Formal Flood Notification, partners were asked if they
ranked causes) were reported to be extreme rainfall had any explanation why the forecasted flood event
(47% of participants), long-lasting rainfall (37% of did not actually take place. Possible reasons were
participants), and snow melt (16%). These causes were, listed: reservoir operation, ice jam, forecasted
together with soil saturation, also the most important precipitation did not occur or fell in a different area,
secondary drivers. Extreme rainfall is the only driver and not enough snowpack melt. No responses were
that has been reported as being relevant for a unfortunately obtained to this question for the events
significant percentage of reported flood events reported during 2020 (this is not a mandatory
throughout the different reporting periods. The question). Nevertheless, out of those who responded
percentage of reported events mainly caused by long- in previous years, which were not many either, the
lasting rainfall during 2020 was comparable to that of most common answer was “other”, followed by “not
2019, and significantly larger than for previous years. enough precipitation”. Overall, the limited number of
Finally, soil saturation was a relevant secondary driver responses to this question by point to the difficulty of
of many reported events throughout the different attributing specific causes to false alarms.
reporting periods.
Figure 17: Participants response to the question “What caused Figure 19: Participants response to the question “If no flood,
the flood event?” of the feedback form. do you have an idea why the event did not occur?” of the
feedback form.
Finally, partners were asked about the perceived
added value they got from the EFAS Formal Flood The added value of false alarms was obviously low, but
Notification. Most participants reported that the EFAS there were anyway partners that appreciated receiving
Formal Flood Notification conveyed an added value to such notifications. No responses to this question for
their activity. Indeed, about 80% of participants false alarms were recorded prior to the transition to
considered that notifications conveyed medium to the new integrated feedback collection system and
significant added value, hinting to a positive reception therefore no data is available prior to 2019.
of EFAS predictions by their users. This question was
introduced in 2017 and no data is therefore available
for 2016.
11EUROPEAN FLOOD AWARENESS SYSTEM: Bimonthly Bulletin – Issue 2021(5)
EFAS partner survey 2020
by Marc Girons Lopez and Diana Fuentes Andino, EFAS
Dissemination Centre
The 15th EFAS Annual Meeting took place online on the
22nd of October 2020 and the participants were
invited to answer the yearly survey regarding the
satisfaction with the EFAS performance, services and
Figure 20: Participants response to the question “How would products. A link for the web-based survey was made
you rate the added value of the forecast?” of the feedback available to all EFAS partners and a total of 54
form. A value of 1 corresponds to little to no added value and responses were received, compared to 36 in 2019 and
a value of 5 corresponds to a significant added value.
43 in 2018. The survey was, as in previous years,
Summary anonymous.
The above analysis allows drawing some key messages
as follows: Overall satisfaction
• Feedback was provided for about a third of all No major changes in the overall satisfaction were
the disseminated Formal Flood Notifications reported in 2020 with respect to the previous three
during 2020. This was a similar percentage years. The satisfaction in the overall performance of
than that of 2019 and a decrease from EFAS, however, increased slightly with respect to 2019.
previous years and might be attributed to the Even so, there was still a small percentage of
increased number of Formal Flood participants who rated the EFAS performance as being
Notifications in recent years. low.
• Formal Flood Notifications were generally
perceived to convey an added value to the
partners.
• An increased percentage of the Formal Flood
Notifications sent out during 2020 resulted in
false alarms when compared to previous
years.
• The accuracy of the Formal Flood Notifications
sent out during 2020 was perceived to be good
and to a general degree comparable to
previous years.
• The return period of the majority of the Figure 21: Average user response on overall satisfaction with
observed flood events in connection with a EFAS.
Formal Flood Notification was less than 5
years, which is below the lowest EFAS According to most participants, the main benefit of
threshold. being an EFAS member were the forecasts. Other
• The main drivers behind flood events in 2020 important benefits according to participants were
were extreme rainfall and long-lasting rainfall receiving flood notifications, the learning practices
and, to a lesser extent, snow melt. during annual meetings, and getting access to
• Based on the lack of responses to why certain observed and forecasted precipitation.
forecasted events did not occur, it may be The Operational EFAS consists of four different
deduced that establishing causes to false centres: the computational centre, dissemination
alarms is not obvious. centre, hydrological data collection centre, and
meteorological data collection centre. The satisfaction
of the participants with each of the EFAS centres in
2020 decreased slightly when compared to that of
2019. Nevertheless, it was still very good and, in
general, higher than that of 2018.
12EUROPEAN FLOOD AWARENESS SYSTEM: Bimonthly Bulletin – Issue 2021(5)
Focusing on the flash flood forecast products, more
than half of the participants used EFAS flash flood
forecasts on a daily/weekly basis while about 30% of
the participants used them on a monthly basis. Around
10% of participants reported that they never used
them.
Figure 22: Average user response about the satisfaction of the
work of the different EFAS centres
Figure 25: Average user response about the use of EFAS flash
Skill, model performance and trust flood forecasts
The use of model skill scores provided in the EFAS
bulletin increased for the year 2020. Most participants Participants tended to use flash flood forecast
used the EFAS model skill scores provided both in the products when significant rainfall was to be expected
bulletin and in the skill layers in the EFAS-IS. and to get alerts from likely events. Nevertheless,
Conversely, the skill scores provided on the wiki page several participants commented on the large number
were only used by a small percentage of participants. of flash flood notifications they received and their
uncertainties, and some of them did not find these
products useful. In general, there was a demand for
further development and refinement of flash flood
forecast products, such as increased coverage, and
presenting more information about precipitation,
among others.
Regarding the use of alternative sources of
information, 61% of participants compared EFAS
forecasts with other providers, while 13% of them did
not. The remaining percent did not answer this
question. Most of the participants who answered
Figure 23: Average user response about the use of model skill
positively reported that they compared EFAS with
score.
national and/or regional forecasts and some of the
In general, there were no major differences in the participants also compared them directly against
perceived added value of the three different types of outputs from other meteorological/hydrological
EFAS notifications (i.e. Formal Flood Notifications, models.
Informal Flood Notifications, and Flash Flood
Notifications) with respect to previous years. EFAS training and resources
Nevertheless, a slight increase could be observed in the EFAS provides training to partners on a variety of topics
added value of Informal Flood Notifications and Flash and in different formats. When asked about which
Flood Notifications with respect to 2019. topics they would like to receive training about in the
future, most participants responded EFAS skill and
EFAS layers and products, followed by flash flood
forecasts and notifications. Other popular topics where
the models used by EFAS (e.g. LISFLOOD), new
products, and uncertainty and its communication.
Regarding the preferred training format, participants
favoured having regular webinars (42 votes), followed
by short online tutorials (36). Online documentation
and workshops during the annual meeting were the
least preferred methods, with 26 and 23 votes
Figure 24: Average user response to the added value of respectively.
notifications.
13EUROPEAN FLOOD AWARENESS SYSTEM: Bimonthly Bulletin – Issue 2021(5)
Figure 26:Average user response about the preferences for
receiving training.
Relevant information on the EFAS system is provided
online in different formats such as the bulletin, wiki
page, annual hydrological report, and annual
performance report. Out of these sources of
information, most participants reported that they read Figure 28: Average user response to awareness about some
the bulletin, annual hydrological report, and annual EFAS products/features.
performance report, at least sometimes. The EFAS wiki
EFAS products
page was the least used of these sources of
In general, participants were positive about the
information. In fact, the EFAS wiki, together with the
usability and added value of all EFAS products. The
annual performance report, where the least known
highest rated product was the 6-hourly flood forecast
documents among participants.
information while the lowest rated ones were the risk
assessment layer and the sub-seasonal forecasts.
Figure 27: Average user response to EFAS informative
resources.
In addition to the aforementioned information sources
about EFAS, partners have the opportunity to use a
number of resources from EFAS. However, the
participants’ awareness of the existence of the
different EFAS resources differed significantly. On the
one side, the possibility to activate EMS Mapping for
satellite imagery, the fact LISFLOOD model is now open
source, and the availability of training material on the
EFAS-IS platform was well-known among participants.
On the other side, the participants’ awareness on the Figure 29: Average user response to the functionality/added
possibility to request training from the EFAS value for some of the EFAS products/features.
Dissemination Centre and of downloading EFAS
hydrological forecasts from the Climate Data Store was Only a minor percentage of participants stated that
somewhat limited. The most unknown EFAS resource their organisations were using some of the EFAS data
were the Jupyter notebooks. (runoff, snow and soil moisture) available through the
Sensor Observation Service (SOS) and The Climate Data
Store (CDS) web services, and about 20% of them
14EUROPEAN FLOOD AWARENESS SYSTEM: Bimonthly Bulletin – Issue 2021(5)
stated that their organisations were planning on using Even so, more than half of the participants were willing
these data in the future. What’s more, nearly half of to provide feedback also for Informal Flood
the participants reported that their organisations did Notifications and Flash Flood Notifications. Most
not use these data and another 25% of the participants participants were however not sure about writing
were not sure about it. The least used variable was short articles to be published on the EFAS website or
simulated snow and the most used was runoff. conducting verifications analyses.
Figure 30: Average user response to the use of some EFAS
products.
Regarding data quality and standardization, most Figure 33: Average user response about the willingness to
participants stated that the would like to receive both provide feedback or analyses/articles for EFAS.
quality flags for their meteorological and/or
hydrological data, and their data in a standard format Concluding remarks
(i.e. harmonised time step and units, and quality Overall, partners were satisfied with the performance
controlled). and added value of EFAS service as well as in its
products and resources. However, a number of
remarks were also provided on aspects of the system
that need be further improved, such as on the
performance of flash flood forecasts and notifications
or the need to promote and provide training for some
of the EFAS products and resources (e.g. EFAS wiki,
Jupyter notebooks). Additionally, other suggestions
include the expansion of the EFAS domain, and the
increased resolution of certain variables (initial
conditions, forecasted accumulated precipitation).
Figure 31: Average user response about obtaining specific EFAS
product/data.
Feedback and contributions
Most participants stated that providing feedback to
EFAS Formal Notifications with the built-in feedback
form on EFAS-IS was easier than with the old system,
following the same trend as in previous years.
Nevertheless, some partners pointed out the existence
of bugs in the system that hindered the reporting of
feedback and the lack of resources available to provide
feedback to all notifications.
Figure 32: Average user response about the ease of providing
feedback.
15EUROPEAN FLOOD AWARENESS SYSTEM: Bimonthly Bulletin – Issue 2021(5)
Acknowledgements
The following partner institutes and contributors are gratefully acknowledged for their contribution:
• DG DEFIS - Copernicus and DG ECHO for funding the EFAS Project
• All data providers including meteorological data providers, hydrological services & weather forecasting
centres
• The EFAS Operational Centres
• Richard Davies, Floodlist.com
Cover image: Photo of Erfstadt-Blessem, Germany – credit: Rhein-Erft-Kreis
16EUROPEAN FLOOD AWARENESS SYSTEM: Bimonthly Bulletin – Issue 2021(5)
Appendix – figures
Figure 34: Accumulated precipitation [mm] for August 2021. Figure 36: Accumulated precipitation [mm] for September
2021.
Figure 35: Precipitation anomaly [%] for August 2021, relative
to a long-term average (1990-2013). Blue (red) denotes Figure 37: Precipitation anomaly [%] for September 2021,
wetter (drier) conditions than normal. relative to a long-term average (1990-2013). Blue (red)
denotes wetter (drier) conditions than normal.
17EUROPEAN FLOOD AWARENESS SYSTEM: Bimonthly Bulletin – Issue 2021(5)
Figure 38: Mean temperature [°C] for August 2021. Figure 40: Mean temperature [°C] for September 2021.
Figure 39: Temperature anomaly [°C] for August 2021, relative Figure 41: Temperature anomaly [°C] for September 2021,
to a long-term average (1990-2013). Blue (red) denotes colder relative to a long-term average (1990-2013). Blue (red)
(warmer) temperatures than normal denotes colder (warmer) temperatures than normal.
18EUROPEAN FLOOD AWARENESS SYSTEM: Bimonthly Bulletin – Issue 2021(5)
Figure 42: Monthly discharge anomalies August 2021. Figure 44: Monthly discharge anomalies September 2021.
Figure 43: Lowest alert level exceedance for August 2021. Figure 45: Lowest alert level exceedance for September 2021.
19EUROPEAN FLOOD AWARENESS SYSTEM: Bimonthly Bulletin – Issue 2021(5)
Figure 46: Lowest threshold exceedance for August 2021. Figure 47: Lowest threshold exceedance for September 2021.
20EUROPEAN FLOOD AWARENESS SYSTEM: Bimonthly Bulletin – Issue 2021(5)
Figure 48: EFAS flood notifications sent for August 2021. Figure 50: EFAS flood notifications sent for September 2021.
Figure 49: Flash flood notifications sent for August 2021. Figure 51: Flash flood notifications sent for September 2021.
21Appendix - tables
Table 1: EFAS flood notifications sent in August – September 2021
Lead
Type Forecast date Issue date River Country
time
Informal 01/08/2021 00UTC 01/08/2021 30 NEVEZIS Lithuania
Informal 02/08/2021 00UTC 02/08/2021 42 KOVDA Russia
Informal 02/08/2021 00UTC 02/08/2021 30 Pielisjoki section Finland
Informal 02/08/2021 00UTC 02/08/2021 30 Lake Ladoga sub-catchment Russia
Informal 02/08/2021 00UTC 02/08/2021 42 Voronja Russia
Informal 02/08/2021 00UTC 02/08/2021 42 Coastal zone Russia
Informal 02/08/2021 12UTC 03/08/2021 18 BOLSHOY KEMCHUG Poland
Informal 03/08/2021 00UTC 03/08/2021 42 Ziller Austria
Informal 03/08/2021 00UTC 03/08/2021 12 Oulankajoki Russia
Informal 03/08/2021 12UTC 04/08/2021 66 Rhine Switzerland
Informal 03/08/2021 12UTC 04/08/2021 36 Adige Italy
Formal 04/08/2021 00UTC 04/08/2021 66 Rhine Switzerland
Formal 09/08/2021 00UTC 09/08/2021 54 Coastal Catchment Black Sea Russia
Informal 11/08/2021 00UTC 11/08/2021 6 Abin, Adagum Russia
Formal 17/08/2021 00UTC 17/08/2021 18 Testeboån Sweden
Informal 19/08/2021 00UTC 19/08/2021 0 Abin, Adagum Russia
Informal 22/08/2021 12UTC 23/08/2021 12 Mur Austria
Informal 24/08/2021 00UTC 24/08/2021 6 Pripyat, above Yaselda Ukraine
Informal 27/08/2021 12UTC 28/08/2021 42 Mures, below Tirnava Romania
Informal 01/09/2021 12UTC 02/09/2021 24 Rioni Georgia
Informal 07/09/2021 00UTC 07/09/2021 48 ORB France
Informal 08/09/2021 00UTC 08/09/2021 120 Coastal zone Iceland
Informal 08/09/2021 00UTC 08/09/2021 114 Djupa Iceland
Informal 09/09/2021 00UTC 09/09/2021 90 OELFUSA Iceland
Informal 22/09/2021 12UTC 23/09/2021 84 Coastal zone Iceland
Informal 27/09/2021 00UTC 27/09/2021 36 Skien Norway
a. * Lead time [days] to the first forecasted exceedance of the 5-year simulated discharge threshold.
Table 2: EFAS flash flood notifications sent in August – September 2021
Lead
Type Forecast date Issue date Region Country
time
Flash Flood 01/08/2021 00UTC 01/08/2021 24 Mazowiecki regionalny Poland
Flash Flood 01/08/2021 12UTC 02/08/2021 36 Pskov Russia
Flash Flood 01/08/2021 12UTC 02/08/2021 36 Louna-Eesti Estonia
Flash Flood 03/08/2021 00UTC 03/08/2021 48 Lombardia Italy
Flash Flood 04/08/2021 12UTC 05/08/2021 42 Lodzkie Poland
Flash Flood 04/08/2021 12UTC 05/08/2021 48 Warszawski stoleczny Poland
Flash Flood 04/08/2021 12UTC 05/08/2021 48 Mazowiecki regionalny Poland
Flash Flood 05/08/2021 00UTC 05/08/2021 42 Eastern Scotland United Kingdom
Flash Flood 05/08/2021 00UTC 05/08/2021 48 Podlaskie Poland
Flash Flood 05/08/2021 00UTC 05/08/2021 30 Lubelskie Poland
Flash Flood 06/08/2021 12UTC 07/08/2021 36 Graubunden Switzerland
Flash Flood 07/08/2021 00UTC 07/08/2021 24 Ticino Switzerland
22Flash Flood 07/08/2021 00UTC 07/08/2021 24 Stredocesky kraj Czech Republic
Flash Flood 07/08/2021 00UTC 07/08/2021 24 Ustecky kraj Czech Republic
Flash Flood 15/08/2021 12UTC 16/08/2021 42 Brest Belarus
Flash Flood 15/08/2021 12UTC 16/08/2021 36 Swietokrzyskie Poland
Flash Flood 16/08/2021 00UTC 16/08/2021 18 Tirol Austria
Flash Flood 17/08/2021 00UTC 17/08/2021 42 Uppsala lan Sweden
Flash Flood 17/08/2021 00UTC 17/08/2021 30 Vastmanlands lan Sweden
Flash Flood 17/08/2021 00UTC 17/08/2021 36 Sodermanlands lan Sweden
Provincia Autonoma di
Flash Flood 21/08/2021 00UTC 21/08/2021 48 Italy
Bolzano/Bozen
Flash Flood 21/08/2021 00UTC 21/08/2021 48 Steiermark Austria
Flash Flood 22/08/2021 00UTC 22/08/2021 30 Burgenland Austria
Flash Flood 22/08/2021 12UTC 23/08/2021 48 Lubelskie Poland
Flash Flood 22/08/2021 12UTC 23/08/2021 42 Warszawski stoleczny Poland
Flash Flood 22/08/2021 12UTC 23/08/2021 42 Mazowiecki regionalny Poland
Flash Flood 22/08/2021 12UTC 23/08/2021 18 Niederosterreich Austria
Flash Flood 22/08/2021 12UTC 23/08/2021 48 Brest Belarus
Flash Flood 24/08/2021 00UTC 24/08/2021 24 Swietokrzyskie Poland
Flash Flood 28/08/2021 00UTC 28/08/2021 36 Sibiu Romania
Flash Flood 28/08/2021 00UTC 28/08/2021 36 Alba Romania
Flash Flood 28/08/2021 00UTC 28/08/2021 36 Valcea Romania
Flash Flood 28/08/2021 12UTC 29/08/2021 48 Rivne Ukraine
Flash Flood 30/08/2021 00UTC 30/08/2021 36 Mazowiecki regionalny Poland
Flash Flood 09/09/2021 00UTC 09/09/2021 24 Haute-Garonne France
Flash Flood 17/09/2021 00UTC 17/09/2021 36 Brest Belarus
Flash Flood 17/09/2021 00UTC 17/09/2021 42 Podlaskie Poland
Flash Flood 17/09/2021 00UTC 17/09/2021 30 Volyn Ukraine
Flash Flood 17/09/2021 12UTC 18/09/2021 48 Kursk Russia
Flash Flood 17/09/2021 12UTC 18/09/2021 30 Hrodna Belarus
Flash Flood 17/09/2021 12UTC 18/09/2021 24 Brest Belarus
Flash Flood 18/09/2021 00UTC 18/09/2021 24 Allier France
Flash Flood 18/09/2021 00UTC 18/09/2021 30 Kherson Ukraine
Flash Flood 19/09/2021 12UTC 20/09/2021 24 Puy-de-Dome France
Flash Flood 22/09/2021 00UTC 22/09/2021 36 Vastra Gotalands lan Sweden
Flash Flood 27/09/2021 00UTC 27/09/2021 30 Vastra Gotalands lan Sweden
Flash Flood 28/09/2021 12UTC 29/09/2021 24 Vastmanlands lan Sweden
a. * Lead time [hours] to the forecasted peak of the event
23The European Flood Awareness System (EFAS) produces European overviews of ongoing and forecasted floods
up to 10 days in advance and contributes to better protection of the European citizens, the environment,
properties and cultural heritage. It has been developed at the European Commission’s in-house science service,
the Joint Research Centre (JRC), in close collaboration with national hydrological and meteorological services and
policy DG's of the European Commission.
EFAS has been transferred to operations under the European Commission's COPERNICUS Emergency
Management Service led by DG GROW in direct support to the EU’s Emergency Response Coordination Centre
(ERCC) of DG ECHO and the hydrological services in the Member States.
ECMWF has been awarded the contract for the EFAS Computational centre. It is responsible for providing daily
operational EFAS forecasts and 24/7 support to the technical system.
A consortium of Swedish Meteorological and Hydrological Institute (SMHI), Rijkswaterstaat (RWS) and Slovak
Hydro-Meteorological Institute (SHMU) has been awarded the contract for the EFAS Dissemination centre. They
are responsible for analysing EFAS output and disseminating information to the partners and the ERCC.
A Spanish consortium (REDIAM and SOOLOGIC) has been awarded the contract for the EFAS Hydrological data
collection centre. They are responsible for collecting discharge and water level data across Europe.
A German consortium (KISTERS and DWD) has been awarded the contract for the EFAS Meteorological data
collection centre. They are responsible for collecting the meteorological data needed to run EFAS over Europe.
Finally, the JRC is responsible for the overall project management related to EFAS and further development of the
system.
Contact details:
European Centre for Medium-Range Weather Forecasts (ECMWF)
Shinfield Park, Reading,
RG2 9AX, UK
Tel: +44-118-9499-303
Fax: +44-118-9869-450
Email: comp@efas.eu
www.efas.eu
www.ecmwf.int
24You can also read