Eight Great Technologies The Internet of Things - A patent overview
←
→
Page content transcription
If your browser does not render page correctly, please read the page content below
W
                                                                         W
                                                                         W
Eight Great Technologies
The Internet of Things
A patent overview

Intellectual Property Office is an operating name of the Patent Office
#8Great

This report was prepared by the
UK Intellectual Property Office Informatics Team
August 2014

e-mail: informatics@ipo.gov.uk

© Intellectual Property Office 2014
Intellectual Property Office
Concept House
Cardiff Road
Newport
NP10 8QQ
United Kingdom

www.ipo.gov.uk/informatics
Contents

1     Introduction                             2
2     Worldwide patent analysis                4
2.1    Overview                                4
2.2    Top applicants                          10
2.3    Technology breakdown                    12
3     The UK landscape                         14
3.1    UK applicants                           14
3.2    Collaboration                           15
3.3    UK inventor mobility                    16
3.4    How active is the UK?                   17
4     Patent landscape map analysis            20
5     Conclusions                              23
Appendix A     Interpretation notes            24
Appendix B     Relative Specialisation Index   26
Appendix C     Patent landscape maps           27

                                               1
1 Introduction
The UK Government has identified ‘eight great technologies’ plus a further two which will
propel the UK to future growth. These are:
the big data revolution and energy-efficient computing;
satellites and commercial applications of space;
robotics and autonomous systems;
life sciences, genomics and synthetic biology;
regenerative medicine;
agri-science;
advanced materials and nanotechnology;
energy and its storage;
quantum technologies;
the internet of things.
Patent data can give a valuable insight into innovative activity, to the extent that it has
been codified in patent applications, and the IPO Informatics team is producing a series of
patent landscape reports looking at each of these technology spaces and the current level
of UK patenting on the world stage. As an aid to help people understand the eight great
technologies and to consider the direction of future funding, the IPO is offering a
comprehensive overview of what is already patented in the each of these technologies.
This information should not be taken as a direct measure of the level of innovation in the
UK; it should be considered in conjunction with other sources of information to form a fuller
picture.
This is the final report in the series and gives an analysis of the worldwide patent
landscape for the Internet of Things (IoT). The IoT is a concept where a network of
everyday physical objects are accessed through the internet and are able to automatically
identify themselves to other devices because of their inherent “ambient intelligence” 1,
creating a smarter world2. In 2012 it was estimated that there were 8.7 billion connected
devices and this is predicted to rise to between 50 billion and 75 billion devices by 2020 3.
Examples in the home include smart metering and remote control appliances, and in the
wider world include traffic congestion/optimisation, intelligent shopping, smart monitoring,
e-health, industrial auto-diagnosis and smart farming.
The IoT is the most widely used term to describe this concept but a number of other terms
are also used in the field4, including the Cloud of Things (CoT), Industrial Internet, Internet
1
http://www.techopedia.com/definition/28247/internet-of-things-iot
2
http://images.libelium.es/content/applications/libelium_smart_world_infographic_big.png
3
http://www.businessinsider.com/75-billion-devices-will-be-connected-to-the-internet-by-
2020-2013-10
4
http://www.wired.com/2014/02/web-semantics-synonyms-internet-things/
2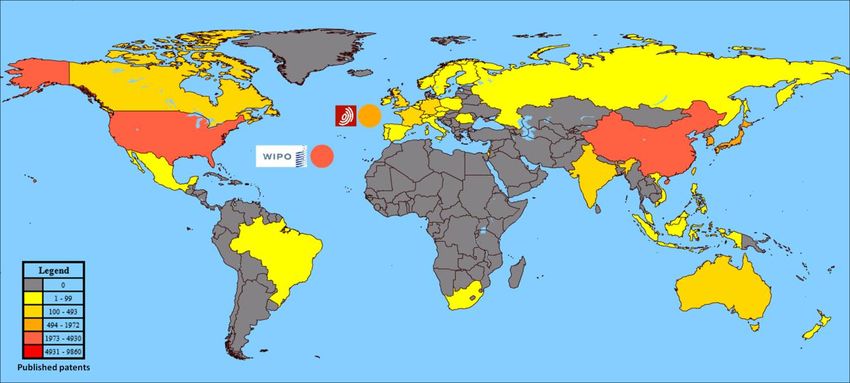
of Everything, Web of Things, Machine to Machine (M2M), Smarter Planet, and Digital
Life.

The dataset used for analysis was extracted from worldwide patent databases following
detailed discussion and consultation with patent examiners from the Intellectual Property
Office who are experts in the field. The search strategy for this dataset was designed to
reflect smart internet-connected devices as well as genuine IoT technologies with ambient
intelligence for automatic identification and connection. For example, current smart
electricity meters are internet-connected devices but they are not a core IoT technology
because they do not automatically identify themselves to the network and to other devices
and they require manual user setup. However these smart meters are only one small step
away from being a true IoT device and it would be misleading to exclude them from
analysis of the IoT patent landscape.

This report is based on the analysis of published patent application data rather than
granted patent data. Published patent application data gives more information about
technological activity than granted patent data because a number of factors determine
whether an application ever proceeds to grant; these include the inherent lag in patent
processing at national IP offices worldwide and the patenting strategies of applicants who
may file more applications than they ever intend to pursue.

                                                                                             3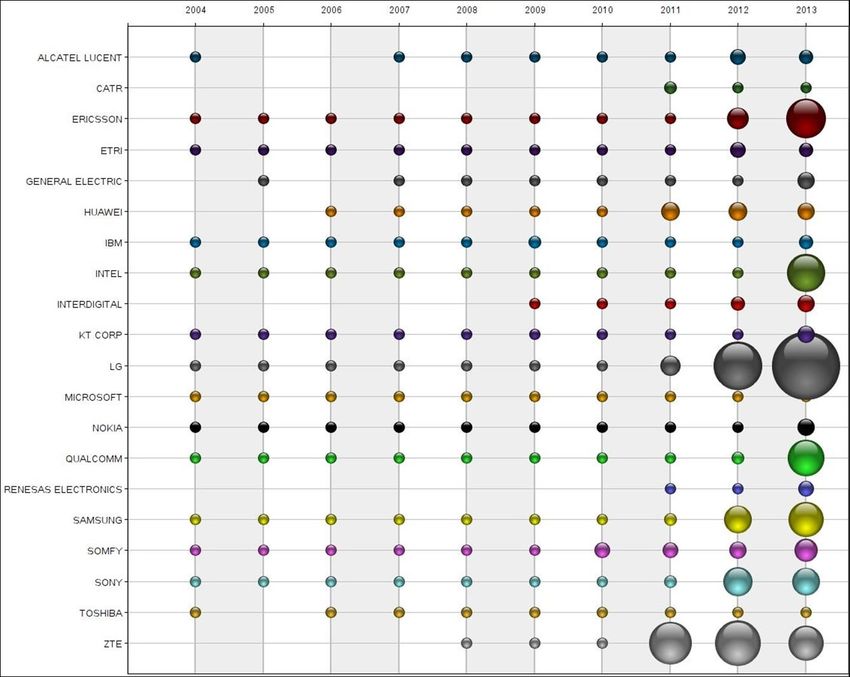
2     Worldwide patent analysis

2.1 Overview
Table 1 gives a summary of the worldwide dataset used for the analysis of the IoT patent
landscape. All of the analysis undertaken in this report was performed on this dataset or a
subset of this dataset. The worldwide dataset for IoT patents published between 2004 and
2013 contains almost 22,000 published patents equating to almost 10,000 patent families.

Published patents may be at the application or grant stage, so are not necessarily granted
patents. A patent family is one or more published patent originating from a single original
(priority) application. Analysis by patent family more accurately reflects the number of
inventions present because generally there is one invention per patent family, whereas
analysis by raw number of patent publications inevitably involves multiple counting
because one patent family may contain dozens of patent publications if the applicant files
for the same invention in more than one country. Hence analysis by patent family gives
more accurate results regarding the inventive effort that patenting activity represents.

Table 1: Summary of worldwide patent dataset for the internet of things

                   Number of patent families           9860

                   Number of patent publications       21,956

                   Publication year range              2004-2013

                   Peak publication year               2013

                   Top applicant                       ZTE (China)

                   Number of patent assignees          7238

                   Number of inventors                 17,756

                   Priority countries                  42

                   IPC sub-groups                      4547

4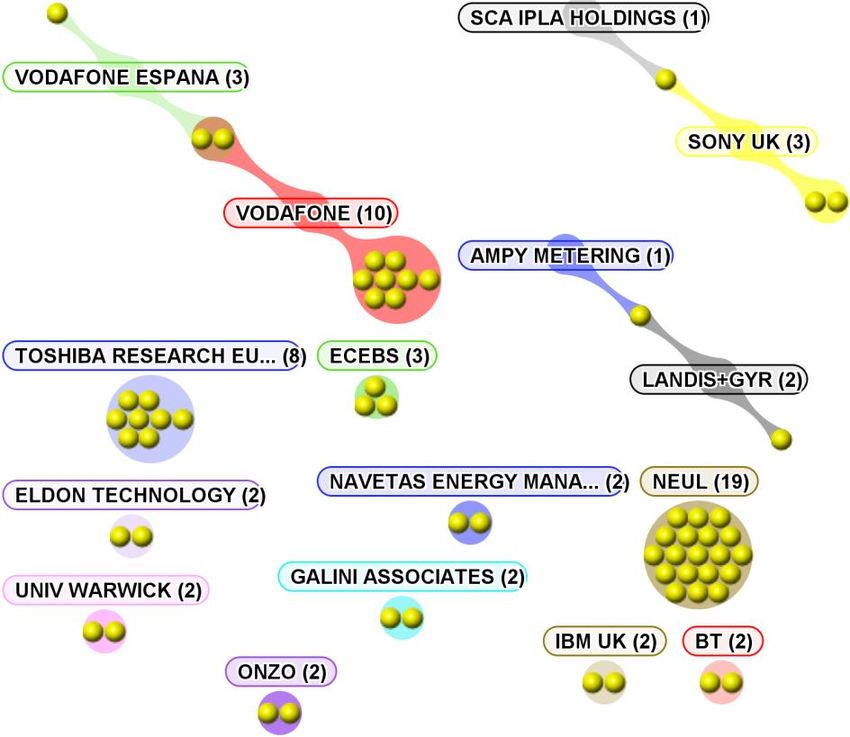
Figure 1 shows the total number of published patents by publication year (top) and the
total number of patent families by priority year (bottom – considered to be the best
indication of when the original invention took place). Figure 1 suggests a significant and
rapid increase in IoT patenting in recent years with over five times the number of IoT
patents published in 2013 compared to 2010. The patent family chart in red does not show
any patents filed after 2011 because a patent application is normally published 18 months
after the priority date or the filing (application) date, whichever is earlier. Hence, the 2012
and 2013 data is incomplete and has been ignored.

                                6000

                                5000
          Patent publications

                                4000

                                3000

                                2000

                                1000

                                   0
                                       2004   2005    2006     2007      2008   2009     2010     2011    2012   2013
                                                                      Publication year

                                3000

                                2500

                                2000
           Patent families

                                1500

                                1000

                                 500

                                   0
                                       2003    2004     2005      2006      2007       2008     2009     2010    2011
                                                                  Earliest priority year

Figure 1: Patent publications by publication year (top) and patent families by priority
                                                                         year (bottom)

                                                                                                                        5
In real-world terms only limited information can be gleaned from the upward trends shown
in Figure 1 because overall patenting levels globally continue to grow at an ever-increasing
rate. Figure 2 addresses this issue by normalising the data shown in Figure 1 and
presenting the annual increase in the size of worldwide patent databases across all
technologies against the year-on-year increase in the size of the IoT dataset. For example,
between 2011 and 2012 worldwide patenting across all areas of technology increased by
12.7% and this can be compared to an 82.0% increase in IoT patenting over the same
time period.

Figure 2 shows that the year-on-year change in IoT patenting has been well above the
annual increase in overall patent publications over the last ten years. Patenting within the
IoT technology space is clearly rapidly expanding with an average year-on-year growth of
over 40% between 2004 and 2013 compared to an average 6% year-on-year increase
across all technologies.

                                   120%

                                   100%
    % change in annual patenting

                                   80%

                                   60%

                                   40%

                                   20%

                                    0%
                                    2004-2005 2005-2006 2006-2007 2007-2008 2008-2009 2009-2010 2010-2011 2011-2012 2012-2013
                                                                         Publication year

                                                    Internet of Things     All technologies (worldwide patenting)
                                      Figure 2: Year-on-year change in the internet of things patenting compared to
                                                                       worldwide patenting across all technologies

6
Figure 4 shows the priority country distribution across the dataset with over three-quarters
of IoT patent families having their first filing in China, the USA or Korea. 2% of IoT patent
families are first filed in the UK. Traditionally priority country analysis has been a good
indicator of where the invention is actually taking place because many applicants will file
patent applications first in the country in which they reside5, but in recent years drawing
firm conclusions from this data is harder because there may be other strategic reasons for
an applicant choosing the country of first filing (e.g. tax treatment).

                                           Other
                                     UK     5%
                                 EPO 2%
                          France 2%
                             3%
                  WIPO (PCT)
                     3%

                  Japan
                   5%                                                   China
                                                                        38%

               Korea
                11%

                                          USA
                                          31%

                                                    Figure 3: Priority country distribution

5
 In some countries this is/was a requirement (e.g. in the UK this was a requirement until
2005).

                                                                                            7
It is very difficult to draw accurate conclusions from simply presenting data based on the
country of residence of patent applicants because there is a greater propensity to patent in
certain countries than others. However the Relative Specialisation Index (RSI) 6 for each
applicant country (Figure 4) has been calculated to give an indication of the level of
invention in IoT patenting for each country compared to the overall level of invention in that
country.
The priority country distribution shown in Figure 4 is dominated by China, the USA and
Korea and suggests that these three countries are relatively specialised in IoT since they
account for almost three-quarters of the first filings of all IoT patent families. However the
RSI shown in Figure 4 appears to suggest a slightly different picture. When the RSI is
applied, China is still ranked 1st, but the USA is ranked 8th and Korea 4th, below countries
such as Sweden and Finland. These high-ranking countries show much greater levels of
patenting in IoT than expected despite their absolute levels of patenting, although these
high rankings are primarily due to high patenting activities from a single company –
Ericsson in Sweden and Nokia in Finland. The UK is ranked 11th with a negative RSI
value of -0.30, suggesting that there are fewer IoT patents filed by UK applicants
compared to the overall level of patenting from UK applicants across all technology areas.
-1 -0.8 -0.6 -0.4 -0.2 0 0.2 0.4 0.6 0.8 1
China
Sweden
Finland
Korea
France
Australia
Canada
USA
Japan
Taiwan
UK
Italy
Switzerland
Germany
Figure 4: Relative Specialisation Index (RSI) by applicant country
Figure 5 shows the countries in which applicants in the IoT field are interested in seeking
patent protection, with the strength of colour reflecting the quantity of published patents in
6
See Appendix B for full details of how the Relative Specialisation Index is calculated.
8each jurisdiction. The strong coverage of China and the USA is expected given the
propensity to patent in these countries. Published patents filed via the EPO [ ] and WIPO
(PCT) [ ] routes are also presented, with Figure 5 showing a strong level of patenting
via the PCT route evidenced by the dark orange colour given to the blob that represents
WIPO.
Figure 5: Patent coverage (publication country coverage)
92.2 Top applicants
Patent applicant names within the dataset were cleaned to remove duplicate entries
arising from spelling errors, initialisation, international variation and equivalence7. Figure 6
shows the top 20 applicants which primarily consists of a mix of Chinese, Korean, US and
Japanese companies.
Patent families
0 50 100 150 200 250 300 350
ZTE (China)
LG (Korea)
Samsung (Korea)
Ericsson (Sweden)
IBM (USA)
Sony (Japan)
Intel (USA)
Somfy (France)
Qualcomm (USA)
Huawei (China)
ETRI (Korea)
KT Corporation (Korea)
Nokia (Finland)
Alcatel Lucent (France)
General Electric (USA)
Microsoft (USA)
CATR (China)
Interdigital (USA)
Toshiba (Japan)
Renesas Electronics (Japan)
Figure 6: Top applicants
ZTE is a Chinese multinational telecommunications equipment and systems company and
it has the most patent families of any of the applicants in the IoT patent landscape. The
inventions that these families seek to protect relate to a variety of different aspects of the
IoT with many inventions relating to machine-to-machine (M2M) communication, vehicle
remote control, IoT security (e.g. authentication devices) and wireless network
arrangements.
LG and Samsung both have a number of IoT patent applications relating to data
transmission and data storage, but primarily they are interested in home automation. For
example many applications relate to smart TVs, smart washing machines, smart
refrigerators and air-conditioning units that can be controlled via smartphones, connect
with smart meters to turn on when lower-cost energy is available, and analyse food
quantities available against stored recipes.
7
See Appendix A.4 for further details.
10The media have reported the interest of the ‘tech-giants’ Apple and Google in the IoT8 but
detailed information is limited at present9. Apple is ranked 27th in the list of top IoT
applicants with 129 published patent applications relating to 37 patent families
(inventions). Google is ranked 84th with 39 published patent applications relating to 14
patent families, although Google has recently acquired home-security company Nest Labs
for $3.2 billion10, who specialise in smart thermostats and smart smoke alarms, and Nest
Labs own a further 16 published patent applications relating to 7 patent families.
Figure 7 is a bubble map showing a timeline for the top 20 applicants and shows the filing
activity of these applicants in the last 10 years. It shows absolute number of patent
publications whereas Figure 6 shows patent families (inventions). Figure 7 highlights the
large increase in recent years with very little patenting activity before 2011. For example,
LG had only 6 published IoT patent applications in 2010 compared to 189 in 2013.
Figure 7: Applicant timeline of published patents by publication year
8
http://www.forbes.com/sites/brucerogers/2014/07/08/apple-and-google-dominate-
internet-of-things-influence-with-home-automation-efforts/
9
http://thestack.com/apple-and-google-eye-up-opportunity-for-internet-of-things
10
http://www.theverge.com/2014/1/13/5305282/google-purchases-nest-for-3-2-billion
112.3 Technology breakdown
Figure 8 shows the top IPC subgroups, and Table 2 lists the description of each of these
subgroups. The IPC provides for a hierarchical system of language-independent symbols
for the classification of patent applications according to the different areas of technology to
which they relate. However the classifications are not mutually exclusive and each patent
family may have several of these classifications applied.
Patent families
0 100 200 300 400 500 600 700 800 900 1000
H04L29/08
H04L12/28
H04L29/06
G06F15/16
G05B19/418
H04W84/18
H04W4/00
G08C17/02
H04W72/04
H04B7/26
Figure 8: Top IPC sub-groups
12Table 2: Key to IPC subgroups referred to in Figure 8
Communication control; Communication processing -> characterised by a
H04L29/08 protocol -> Transmission control procedure, e.g. data link level control
procedure
Data switching networks -> characterised by path configuration, e.g. LAN
H04L12/28
(Local Area Networks) or WAN (Wide Area Networks)
Communication control; Communication processing -> characterised by a
H04L29/06
protocol
Digital computers in general; Data processing equipment in general ->
Combinations of two or more digital computers each having at least an
G06F15/16
arithmetic unit, a programme unit and a register, e.g. for a simultaneous
processing of several programmes
Programme-control systems -> electric -> Total factory control, i.e. centrally
controlling a plurality of machines, e.g. direct or distributed numerical
G05B19/418
control (DNC), flexible manufacturing systems (FMS), integrated
manufacturing systems (IMS), computer integrated manufacturing (CIM)
Network topologies -> Self-organising networks, e.g.ad hoc networks or
H04W84/18
sensor networks
Services or facilities specially adapted for wireless communication
H04W4/00
networks
Arrangements for transmitting signals characterised by the use of a
G08C17/02
wireless electrical link -> using a radio link
Local resource management, e.g. selection or allocation of wireless
H04W72/04
resources or wireless traffic scheduling -> Wireless resource allocation
Radio transmission systems, i.e. using radiation field -> for communication
H04B7/26
between two or more posts -> at least one of which is mobile
133 The UK landscape
3.1 UK applicants
Figure 9 shows Neul is the top UK applicant for IoT patents with 19 patent families
(inventions). Neul is based in Cambridge and was incorporated in 2010. Neul develop and
supply the technology to allow network operators to provide a scalable, low-power network
service to connect small, low-power devices to their online digital presence in the Cloud11.
To date they have two granted UK patents (GB2491908B and GB2494724B) relating to
networked data communications.
Toshiba Research Europe has a telecommunications research laboratory in Bristol12 and
they have six granted UK patents within their eight IoT patent families. These granted
patents relate to smart grid and smart electricity meter systems and methods for managing
smart utility supplies. Landis+Gyr, Navetas Energy Management and Onzo also own a
number of patent applications that relate to smart metering.
IoT patents applied for by ECEBS relate to contactless smartcards for financial payments
and e-ticketing, Eldon Technology’s relate to set-top boxes for home automation, and the
University of Warwick are researching smart gas sensors.
Patent families
0 5 10 15 20
Neul
Vodafone
Toshiba Research Europe
ECEBS
Sony UK
BT
Eldon Technology
Galini Associates
IBM UK
Landis+Gyr
Navetas Energy Management
Onzo
University of Warwick
Figure 9: UK applicants
11
http://www.neul.com
12
http://www.toshiba.eu/eu/Telecommunications-Research-Laboratory/
143.2 Collaboration
Figure 10 is a collaboration map showing all collaborations between the top UK applicants
in the dataset and their collaborators. Each dot on the collaboration map represents a
patent family and two applicants are linked together if they are named as joint applicants
on a patent application. A collaboration map indicates instances where joint work in solving
a problem has resulted in a shared application for a patent. Figure 10 shows that there is
very little collaboration amongst the top UK IoT patent applicants.
Figure 10: Map of collaborations between the top UK applicants and their
collaborators
153.3 UK inventor mobility
Figure 11 shows the top worldwide applicants with named UK inventors on their published
patents. Comparison with the number of patent families from the top UK applicants, Figure
9, suggests that many UK inventors work for international applicants, including Alcatel
Lucent, Nokia and Research in Motion. This potentially highlights the mobility of the UK
knowledge base since UK inventors are innovating for other non-UK companies.
Patent families
0 5 10 15 20 25
SCA IPLA Holdings(USA)
Neul (UK)
Wireless Technology Solutions (USA)
Vodafone (UK)
Alcatel Lucent (France)
Nokia (Finland)
Research in Motion (Canada)
Toshiba Research Europe (UK)
Interdigital (USA)
Renesas Electronics (Japan)
Figure 11: Top worldwide applicants with named UK-based inventors
163.4 How active is the UK?
A subset of the main worldwide patent dataset designed to reflect UK patenting activity
was selected. Figure 12 shows the annual change in IoT patenting arising from UK
patenting activity against the worldwide year-on-year change in this field shown in Figure
2. It is clear from Figure 1 that worldwide IoT patenting has risen sharply in the last three
years; this is reflected in Figure 12 which shows that worldwide patenting activity jumped
98% between 2010 and 2011, with UK patenting activity taking a little longer to react and
showing a similarly large jump between 2011 and 2012 of 152%. Although the surge in
patenting activity in the UK took a year longer, over the time period measured the UK year-
on-year change in IoT patenting activity appears to be on a par with the worldwide year-
on-year change because it averages out to a similar level.
160%
140%
120%
% change in annual patenting
100%
80%
60%
40%
20%
0%
-20%
2004-2005 2005-2006 2006-2007 2007-2008 2008-2009 2009-2010 2010-2011 2011-2012 2012-2013
Publication year
Worldwide UK patenting activity
Figure 12: Year-on-year change in UK and worldwide internet of things patenting
17Similar patent subsets were created to reflect patenting activity taking place in several
comparator countries (France, Germany, USA, Korea, Japan and China) to produce the
comparison chart shown in Figure 13.
Chinese patenting activity overshadows most countries across many of the data points in
the time period analysed, especially the 319% increase in Chinese patenting activity
between 2006 and 2007 and the even larger 447% increase between 2010 and 2011. As
seen in several of the other reports in the series, a large proportion of Chinese patenting
activity in the step-shift since 2006 are applications from Chinese universities. This sharp
increase in Chinese university patenting is explained by a change in Chinese government
policy to give Chinese universities grants to pay for filing patent applications and a change
to rank Chinese universities against each other according to how many patents they have
filed13. In 2005 Chinese IoT patenting activity resulted in just 16 patent families compared
to over 6000 in 2013 and the average annual growth of Chinese IoT patenting activity over
the time period measured is over 130% (the average annual growth in the last four years is
over 200%). This significant and rapid growth resulting from Chinese patenting activity is
not specific to the IoT and is often seen in a wide range of different technology areas.
450%
400%
350%
% change in annual patenting
300%
250%
200%
150%
100%
50%
0%
-50%
2004-2005 2005-2006 2006-2007 2007-2008 2008-2009 2009-2010 2010-2011 2011-2012 2012-2013
Publication year
UK Germany France USA Korea Japan China Worldwide
Figure 13: Year-on-year change in UK internet of things patenting against
comparison countries
13
Fisch et al - http://www.uni-patente.de/wordpress/wp-content/uploads/Download.pdf
18The influence of the significant increase in Chinese patenting activity makes it difficult to
draw comparisons between the other countries presented in Figure 13, so the same
content has been reproduced in Figure 14 but with Chinese patenting activity removed.
Figure 14 makes it a lot easier to compare UK patenting activity against the other
comparator countries and the worldwide trend.
Although the quantity of US patenting in the IoT is high (as shown in Figure 3), Figure 14
highlights that US patenting activity has shown a smaller change than all of the other
comparison countries with an average year-on-year growth over the time period analysed
of 32%. This is in direct comparison to the growth arising from Japanese patenting activity
which has averaged over 45% year-on-year growth over the ten-year time period studied,
with a 139% increase between 2010 and 2011 that was then followed by a 152% increase
on this between 2011 and 2012.
Figure 3 shows that UK patenting activity in the IoT is relatively small but Figure 14 shows
that, on a side-by-side comparison, UK growth appears to be on a par with all of the
comparator countries (except China). The UK has an average year-on-year growth of the
time period studied of 36% which compares favourably with Germany (39%), France
(38%), Korea (38%), Japan (45%) and the USA (32%), and it is only slightly lower than the
worldwide average year-on-year growth of 42% between 2004 and 2013.
160%
140%
120%
% change in annual patenting
100%
80%
60%
40%
20%
0%
-20%
-40%
2004-2005 2005-2006 2006-2007 2007-2008 2008-2009 2009-2010 2010-2011 2011-2012 2012-2013
Publication year
UK Germany France USA Korea Japan Worldwide
Figure 14: Year-on-year change in UK internet of things patenting against
comparison countries (excluding China)
194 Patent landscape map analysis
In order to give a snapshot as to what the IoT patent landscape looks like, a patent map
provides a visual representation of the dataset. Patent families are represented on a
patent map by dots and the more intense the concentration of patents (i.e. the more
closely related they are) the higher the topography as shown by contour lines. The patents
are grouped according to the occurrence of keywords in the title and abstract and
examples of the reoccurring keywords appear on the patent map14. Figure 15 shows the
IoT patent landscape map for all IoT patents between 2004 and 2013.
Figure 15: Patent landscape map of all patents relating to the internet of things
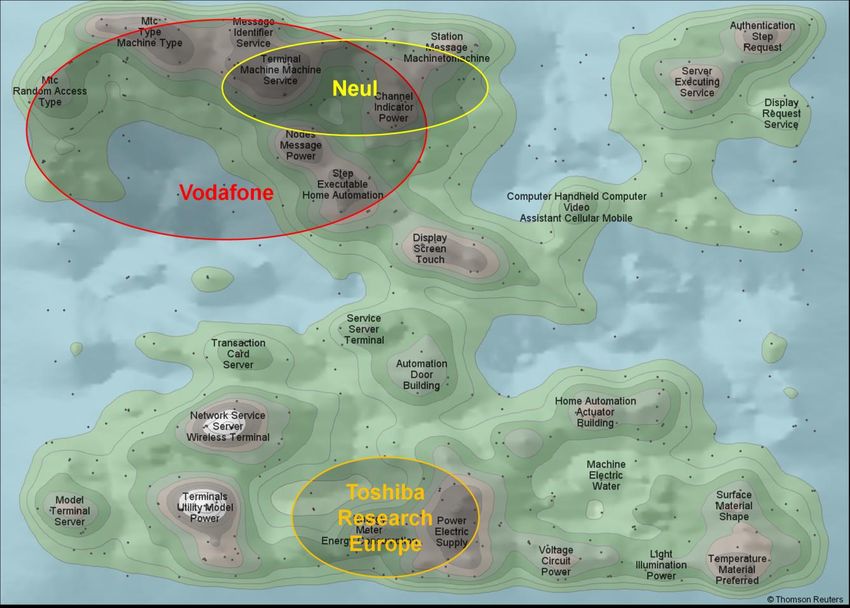
The largest ‘mountain range’ in the top-left of the map shows that a large proportion of the
IoT patent landscape relates to machine-to-machine (M2M) technologies. M2M allows
both wireless and wired systems to communicate with other devices of the same type. It
has a wide range of applications including industrial automation, logistics, smart cities,
14
Further details regarding how these patent landscape maps are produced is given in
Appendix C.
20health and defence, and is used for both monitoring and control purposes15.
The other region highlighted in Figure 15 relates to smart metering patents. Smart meters
are one of the first IoT home automation technologies that many of the public will see and
use in their homes because the UK government has announced that they aim to fit every
home in the UK with a smart meter by 202016 with the official national smart meter roll-out
commencing in 2015. Smart meters are connected via the internet to energy suppliers,
allowing more accurate meter readings and domestic energy management17 with the
ability to offer ‘time of day’ energy tariffs with cheaper rates of electricity at off-peak times
to smooth out national energy usage throughout the day.
The patent landscape map shown in Figure 16 is the same patent map shown in Figure
15, but with the individual IoT patents of the top five worldwide applicants (shown in Figure
6) highlighted. Figure 16 shows that the top applicant, ZTE, is predominately seeking
patent protection around M2M technologies whereas LG, Samsung and Ericsson have a
broader portfolio of both M2M and smart home automation IoT patent applications.
Figure 16: Patent landscape map of all patents relating to the internet of things with
top three UK applicants highlighted
15
http://en.wikipedia.org/wiki/Machine_to_machine
16
http://news.bbc.co.uk/1/hi/business/8389880.stm
17
http://www.uswitch.com/gas-electricity/guides/smart-meters-explained/
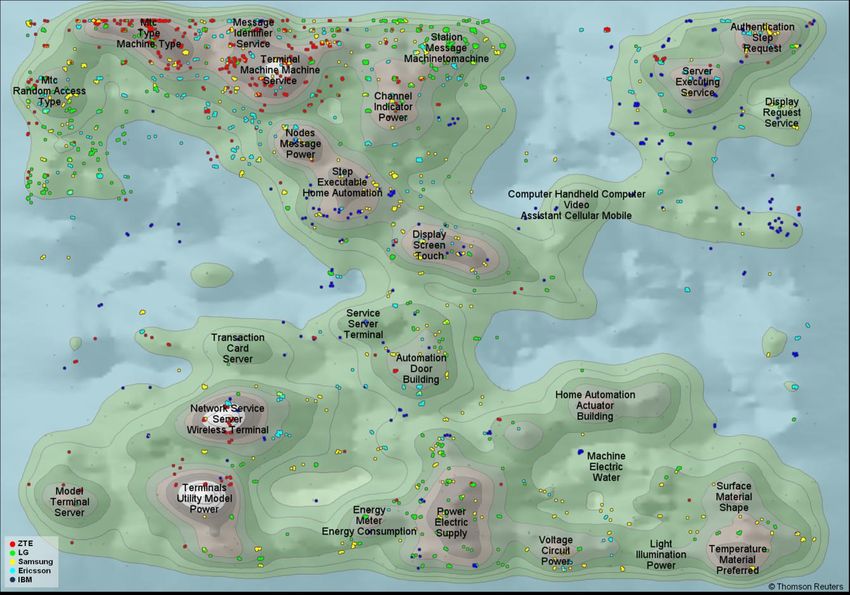
21The patent landscape map shown in Figure 17 highlights the top three UK applicants,
namely Neul, Vodafone and Toshiba Research Europe. As mentioned previously, Neul
operate in the M2M side of the IoT with patents in the area of networked data
communication. Vodafone also operate in a similar part of the IoT technology space with
patents relating to M2M control and messaging. Figure 17 confirms the discussion in
section 3.1 and shows that Toshiba Research Europe focus on smart electricity meters
and methods for controlling the smart grid by reporting electricity consumption data over
the internet and allowing a user to verify the data using their smartphone.
Figure 17: Patent landscape map of all patents relating to the internet of things with
top three UK applicants highlighted
225 Conclusions
There are almost 22,000 published patent applications between 2004 and 2013 relating to
the internet of things (IoT), resulting in almost 10,000 patent families (inventions). Not
surprisingly patenting activity in this field has grown sharply and rapidly in recent years and
in the last three years the annual increase in IoT patenting activity has been over eight
times larger than the general worldwide increase in patenting.
The Chinese telecommunications company ZTE has the most patent families with several
other well-known multinational companies appearing in the list of top applicants, including
LG, Samsung, IBM and Sony. The leading UK applicant is Neul, a dedicated IoT company
incorporated in 2010 to exploit the full potential of the IoT. Neul has been a major
contributor to a new wide-area wireless networking technology designed specifically for the
IoT with better coverage, battery life, module cost and efficiency than current mainstream
wireless solutions18. In 2013 Neul produced the first single chip baseband implementation
of this standard in the world and this technology is capable of delivering high coverage,
low-power and low-cost wireless networks for the IoT19. Neul has recently worked
alongside BT20 and Google21 to fast-track the development and push the boundaries of
these technologies.
UK patenting activity in the IoT has significantly increased in recent years with a rise of
over 150% in the number of published IoT patent applications between 2011 and 2012. In
2013 there were almost 250 IoT patents published from UK patenting activity compared to
less than 50 in 2009. Although UK patenting activity in the IoT is relatively small, on a
direct comparison it is on a par with the growth in patenting activity from several other
countries including Germany, France, Korea, Japan and the USA.
There are an increasing number of internet-connected devices in modern life and a smart
home environment that creates a framework for communication and control is on the cusp
of being a mainstream consumer technology. For example Apple have recently
announced22 that their latest mobile operating system due for release in late 2014 will have
the added functionality to allow manufacturers of smart home appliances to develop
software that will allow their devices to interact with each other and be controlled using
Apple’s mobile devices. With an estimated23 75 billion connected devices by 2020, it
appears that the IoT is likely to radically change the way we live our lives in a smarter
digital world.
18
http://www.neul.com/neul/?page_id=3614
19
http://www.weightless.org/silicon-neul and http://hexus.net/tech/news/network/51681-
first-tv-white-space-network-chip-unveiled-uk-based-neul-ltd/
20
http://www.theregister.co.uk/2014/05/22/uk_government_bt_neul_milton_keynes_iot_m2m
21
http://www.businesswire.com/news/home/20130326005400/en/Carlson-Wireless-Neul-
Ltd.-Join-Forces-Google
22
http://www.cnet.com/uk/news/apple-introduces-homekit-for-ios-8/
23
http://www.businessinsider.com/75-billion-devices-will-be-connected-to-the-internet-by-
2020-2013-10
23Appendix A Interpretation notes
A.1 Patent databases used
The Thomson Reuters World Patent Index (WPI) was interrogated using Thomson
Innovation24, a web-based patent analytics tool produced by Thomson Reuters. This
database holds bibliographic and abstract data of published patents and patent
applications derived from the majority of leading industrialised countries and patent
organisations, e.g. the World Intellectual Property Organisation (WIPO), European Patent
Office (EPO) and the African Regional Industry Property Organisation (ARIPO). It should
be noted that patents are generally classified and published 18 months after the priority
date. This should be borne in mind when considering recent patent trends (within the last
18 months).
The WPI database contains one record for each patent family. A patent family is defined
as all documents directly or indirectly linked via a priority document. This provides an
indication of the number of inventions an applicant may hold, as opposed to how many
individual patent applications they might have filed in different countries for the same
invention.
A.2 Priority date, application date and publication date
Priority date: The earliest date of an associated patent application containing information
about the invention.
Publication date: The date when the patent application is published (normally 18 months
after the priority date or the application date, whichever is earlier).
Analysis by priority year gives the earliest indication of invention.
A.3 WO and EP patent applications
International patent applications (WO) and European patent applications (EP) may be
made through the World Intellectual Property Organization (WIPO) and the European
Patent Office (EPO) respectively.
International patent applications may designate any signatory states or regions to the
Patent Cooperation Treaty (PCT) and will have the same effect as national or regional
patent applications in each designated state or region, leading to a granted patent in each
state or region.
European patent applications are regional patent applications which may designate any
signatory state to the European Patent Convention (EPC), and lead to granted patents
having the same effect as a bundle of national patents for the designated states.
24
http://info.thomsoninnovation.com
24Figures for patent families with WO and EP as priority country have been included for
completeness although no single attributable country is immediately apparent.
A.4 Patent documents analysed
The dataset for analysis was identified in conjunction with patent examiner technology-
specific expertise. A search strategy was developed and the resulting dataset was
extracted in July 2014 using keyword searching of titles and abstracts in the Thomson
Reuters World Patent Index (WPI) and limited to patent families with publications from
2004 to 2013.
The applicant and inventor data was cleaned to remove duplicate entries arising from
spelling errors, initialisation, international variation (Ltd, Pty, GmbH etc.), or equivalence
(Ltd., Limited, etc.).
A.5 Analytics software used
The main computer software used for this report is a text mining and analytics package
called VantagePoint25 produced by Search Technology in the USA. The patent records
exported from Thomson Innovation were imported into VantagePoint where the data is
cleaned and analysed. The patent landscape maps used in this report were produced
using Thomson Innovation.
25
http://www.thevantagepoint.com
25Appendix B Relative Specialisation Index Relative Specialisation Index (RSI) was calculated as a correction to absolute numbers of patent families in order to account for the fact that some countries file more patent applications than others in all fields of technology. In particular, US and Japanese inventors are prolific patentees. RSI compares the fraction of technology area specific patents found in each country to the fraction of patents found in that country overall. A logarithm is applied to scale the fractions more suitably. The formula is given below: where ni = number of technology area specific patents in country i ntotal = total number of technology area specific patents in dataset Ni = total number of patents in country i Ntotal = total number of patents in dataset The effect of this is to highlight countries which have a greater level of patenting in the specific technology area than expected from their overall level of patenting, and which would otherwise languish much further down in the lists, unnoticed. 26
Appendix C Patent landscape maps

A patent landscape map is a visual representation of a dataset and is generated by
applying a complex algorithm with four stages:

   i)     Harvesting documents – When the software harvests the documents it reads
          the text from each document (ranging from titles through to the full text). Non-
          relevant words, known as stopwords, (e.g. “a”, “an”, “able”, “about” etc) are then
          discounted and words with common stems are then associated together (e.g.
          “measure”, “measures”, “measuring”, “measurement” etc).

   ii)    Analysing documents – Words are then analysed to see how many times they
          appear in each document in comparison with the words’ frequency in the overall
          dataset. During analysis, very frequently and very infrequently used words (i.e.
          words above and below a threshold) are eliminated from consideration. A topic
          list of statistically significant words is then created.

   iii)   Clustering documents – A Naive Bayes classifier is used to assign document
          vectors and Vector Space Modelling is applied to plot documents in n-
          dimensional space (i.e. documents with similar topics are clustered around a
          central coordinate). The application of different vectors (i.e. topics) enables the
          relative positions of documents in n-dimensional space to be varied.

   iv)    Creating the patent map – The final n-dimensional model is then rendered into
          a two-dimensional map using a self-organising mapping algorithm. Contours are
          created to simulate a depth dimension. The final map can sometimes be
          misleading because it is important to interpret the map as if it were formed on a
          three-dimensional sphere.

Thus, in summary, patents are represented on the patent map by dots and the more
intense the concentration of patents (i.e. the more closely related they are) the higher the
topography as shown by contour lines. The patents are grouped according to the
occurrence of keywords in the title and abstract and examples of the reoccurring keywords
appear on the patent map. Please remember there is no relationship between the patent
landscape maps and any geographical map.

Please note that the patent maps shown in this report are snapshots of the patent
landscape, and that patent maps are best used an interactive tool where analysis of
specific areas, patents, applicants, inventors etc can be undertaken ‘on-the-fly’.

                                                                                           27
Concept House Cardiff Road Newport NP10 8QQ United Kingdom www.ipo.gov.uk #8Great
You can also read