Tsunami: Science and Safety - UH System Repository for the ...
←
→
Page content transcription
If your browser does not render page correctly, please read the page content below
Tsunami: Science and Safety
Sarah Glancy, Lecturer
University of Hawaiʻi – West Oʻahu
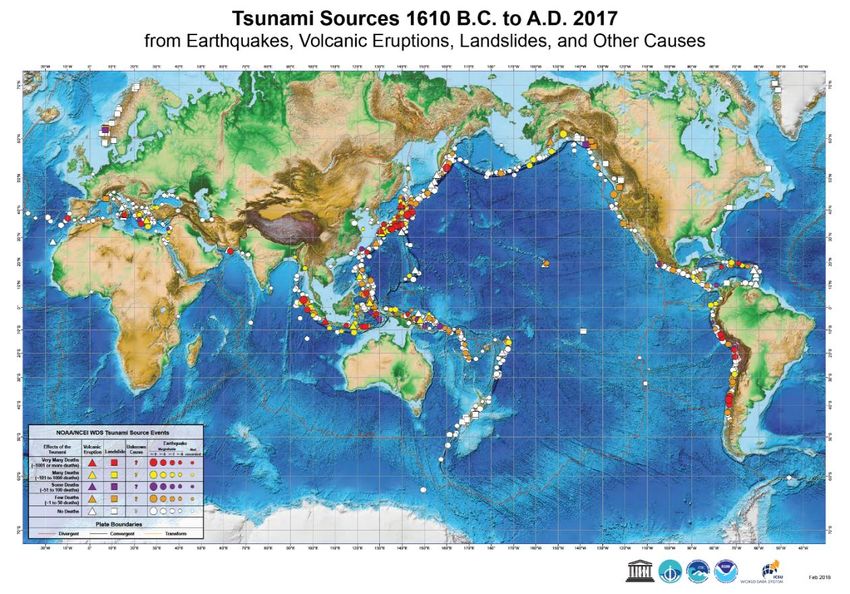
South-West suburb of Banda Aceh, Indonesia after the 2004 tsunami.
On December 26th, 2004, Tom and Arlette Stuip were vacationing in Thailand. While
eating breakfast on a terrace overlooking the beach and the Andaman Sea, Tom
“noticed the waiters were all pointing at the sea which was receding rapidly. It was a
fascinating sight. People got their cameras out and walked towards the dry seabed.
The beach was full of sunbathing tourists.” Tom was puzzled. While living along the
beach in California, He had never observed the ocean behaving like this. “Then it
clicked: the brambling he heard earlier was an earthquake. The receding water was
the prelude to a tsunami.” Arlette recalled, “Tom grabbed my hand and screamed,
“Run!”. At that same moment, he saw a high wall of water come crashing over the
reef towards us at a speed of 40-50 mph. We ran uphill fast. The water was right
behind us. The noise was deafening.” When they returned to the hotel, destruction
was everywhere. Many people were badly injured and many more were dead.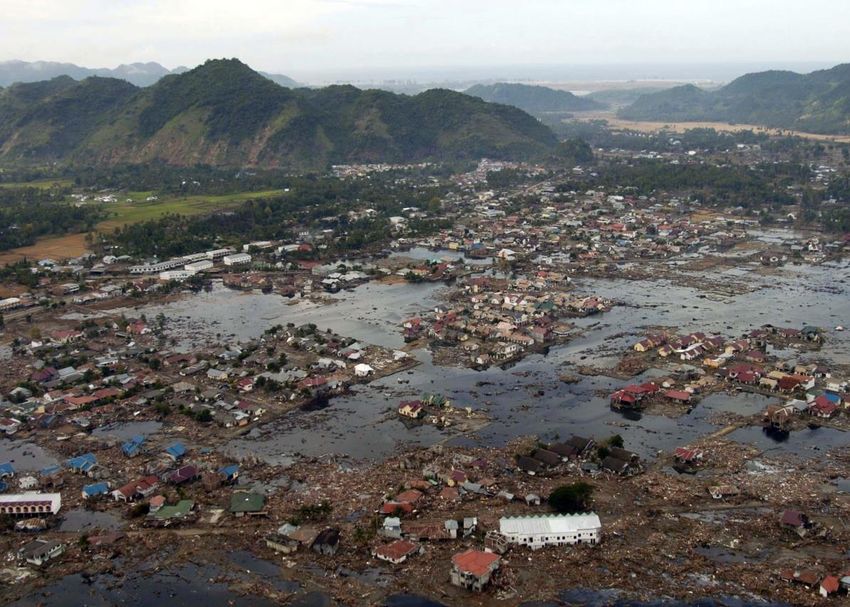
About the author

                                               Sarah Glancy is a lecturer at the University of Hawaiʻi –
                                               West Oʻahu in the Math, Natural and Health Sciences
                                               Department. She teaches earth sciences classes and
                                               labs, primarily Introductory Geology, Geological
                                               Hazards, and Climate. She is passionate about teaching
                                               both science and non-science majors why hazards, such
                                               as tsunami, occur and what we can do about these
                                               natural phenomena.

                                              Sarah received a Bachelor’s of Science degree from the
                                              University of Puget Sound and a Master’s degree in
                                              Geology and Geophysics from the University of Hawaiʻi
at Mānoa. Sarah has been recognized for her excellence in teaching at the University of Hawaiʻi – West
Oʻahu, having been awarded the Associated Students of the University of Hawaiʻi – West Oʻahu Senate’s
Appreciation Medal (2020) and the Open Educator Award (2019).

License and usage information

This chapter is meant to teach a broad audience about tsunami and could be used in a variety of classes.
If you feel that this chapter would be useful in your class, you are welcome to share it with your
students. If you would like to modify or make additions to this chapter and require a Microsoft Word
Document version, please contact the author. (Copyright information is provided below.) Also, feel free
to contact the author if you have any questions or comments about this chapter. The author can be
reached at: sglancy@hawaii.edu Thanks for reading!

This work is licensed under a Creative Commons Attribution-NonCommercial-ShareAlike 4.0
International License.

                                                   2
What is a tsunami?

        As seen by this couple’s experience, a tsunami can be extremely dangerous and damaging. But
what is a tsunami? What does a tsunami look like? What causes a tsunami? And is there anything we
can do about them?

       A tsunami is a series of waves created when the ocean receives a large amount of energy. The
most common causes are underwater earthquakes, volcanic eruptions, and landslides. Over 80% of
tsunami are generated by earthquakes. Tsunami are not caused by the tides, so scientists do not
consider them “tidal waves.”

        While people often visualize a tsunami as a large crashing wave, a tsunami does not always look
that way. Sometimes a tsunami looks like a quickly rising tide. Some people mistakenly and
dangerously think that a tsunami is only one wave and are not prepared for multiple waves. Tsunami
waves are much wider than normal ocean waves and can last for a long time. The first wave may not be
the largest or the most damaging. Tsunami waves can wrap around islands or land, so not just the
coastline immediately facing the tsunami’s source is at risk.

        “Tsunami” is a Japanese word. Some people use the term “tsunami” as both a singular and
plural noun. Others say “tsunami” for a singular noun and “tsunamis” as a plural noun. You will often
see these terms used either way. In this chapter, “tsunami” will be used as both a singular and plural
noun.

Comparison of typical ocean waves and tsunami waves

        How do regular ocean waves compare to tsunami waves? Ocean waves are caused by wind
blowing over the ocean. Energy is transferred from the wind to the top of the water column. In
contrast, a tsunami wave is created by a major event such as an undersea earthquake, a landslide, or a
volcanic eruption. A large amount of energy is transferred from the event to the water. Instead of just
affecting the top of the water column, the energy in a tsunami can move through much or all of the
water column.

        In order to understand a tsunami, it is helpful to know some wave properties. These are
properties that all waves, including tsunami waves, share. Waves have a peak or crest (the highest
point) and a trough (the lowest point). The vertical distance from the trough to the peak is the wave
height. Half of the wave height is called the amplitude of the wave. The horizontal distance from peak
to peak or from trough to trough is called the wavelength. These properties can be viewed in Figure 1.

                                                   3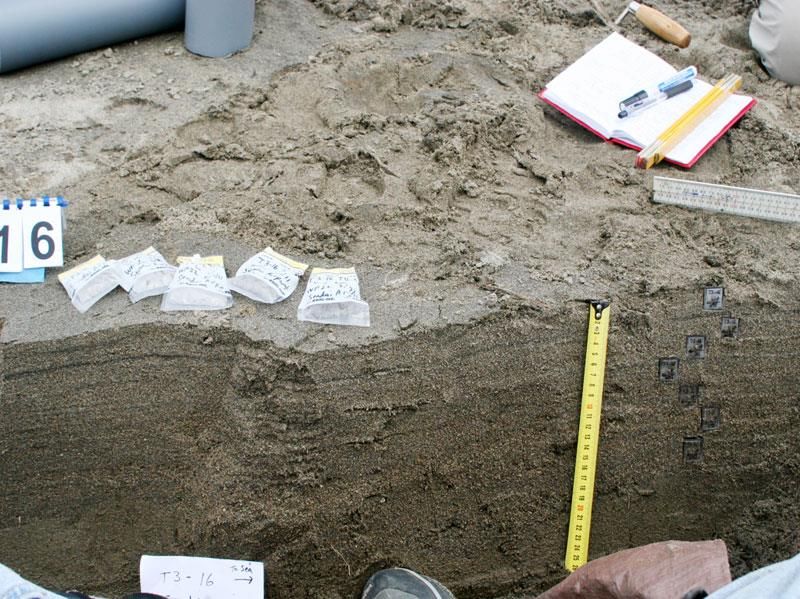
Figure 1. Diagram of wave properties

       The frequency of waves is the number of waves that pass a point in a given period of time. How
can you calculate wave frequency? Imagine floating in the ocean farther away from shore, where no
waves are breaking. You will feel yourself float up with each wave crest and down with each trough.
Count how many wave crests pass you in an amount of time that you choose, such as a few minutes or
an hour. Now, divide the number of wave crests by the amount of time that you chose to calculate the
wave frequency. For example, let’s say that you count 12 wave crests in one minute (60 seconds). The
wave frequency would be 12/60 = 0.2 waves per second, which is one wave crest every five seconds.

        Wave period is how long it takes to complete one cycle of a wave. Again, imagine floating in the
ocean where no waves are breaking. You feel a wave peak arrive. Now time how long it takes for the
next peak to arrive. This amount of time is the wave period. You could alternately use the wave trough
to determine the wave period.

         Tsunami waves are long wavelength waves. This means that there is more distance between
wave crests than normal ocean waves. The wavelength of an average ocean wave is 300-600 feet while
the wavelength of a tsunami measures 60-300 miles! Since there is more distance between wave crests,
there is more time between waves than for normal ocean waves. In other words, the frequency is
lower. If the wave frequency is lower, than the period must be longer. A typical ocean wave’s period is
5-20 seconds while a tsunami wave’s period can range from 5 minutes to 2 hours.

        The lower frequency and longer periods of tsunami waves mean that you will usually observe
more ocean waves than tsunami waves in a given period of time. When you are on the beach, how
often do you see waves crashing in the same location? Most likely, you will see waves crashing several
times a minute. However, it might be two hours between tsunami waves arriving on shore. This can be
dangerous for people who are not knowledgeable about tsunami waves. If someone does not know
that there can be more than one large tsunami wave and that there can be minutes to hours between
waves, they may think that the tsunami event is over after the first wave if they do not see another
wave immediately approaching shore.

        To illustrate these concepts, look at Figure 2. On May 23rd, 1960 Hilo Bay in Hawaiʻi was hit by a
tsunami that originated from an earthquake in Chile. This figure shows water level measurements from
Wailuku River Bridge, located near the river’s entrance to Hilo Bay. These measurements were taken
during the first few hours of the tsunami. Look at the left hand side of the figure, which shows the wave
height in feet above or below normal low tide level (zero feet). (You can find the same information in
meters on the righthand side of the graph). The first wave is labeled on the figure. You can see that the

                                                    4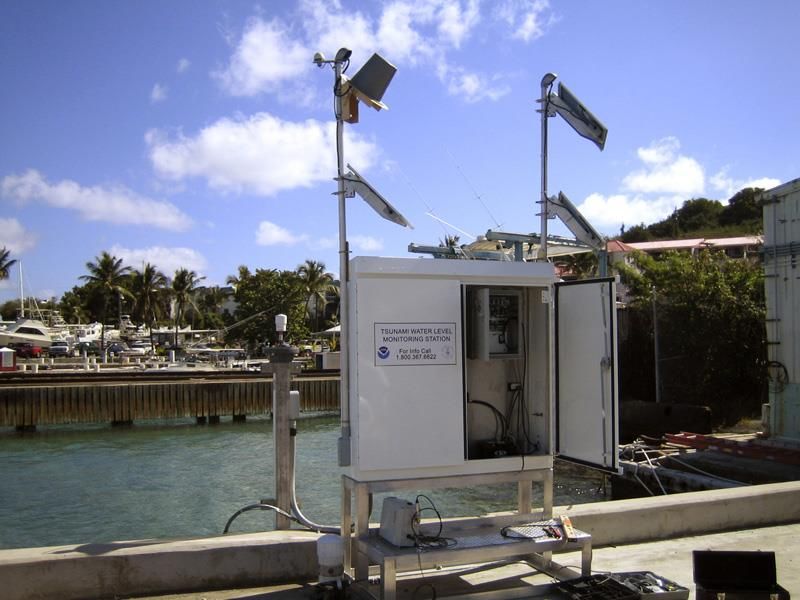
wave height at this time is displayed as higher than the normal low tide level. The first wave receded
approximately 15 minutes later, causing the water level to drop to almost four feet below normal low
tide level. But this was not the end of the 1960 tsunami event in Hilo. Approximately thirty minutes
after the arrival of the first wave, another large wave arrived. You will notice that after this, water level
continued to fluctuate dramatically, raising to about 14 feet above normal low tide at one point, and
falling to more than six feet below low tide level at other points. Each high point represents the
maximum height that an individual tsunami wave reached. These fluctuations mean that as the tsunami
waves came onshore and went back out to sea, the water level in the bay would have been much higher
than normal at certain times (tsunami waves could inundate land) and much lower than normal at other
times. You will notice that there are multiple fluctuations (tsunami waves). The wave that devastated
part of the town of Hilo is labeled on the figure. It is important to note that this was not the first nor the
last wave. Additionally, the waves varied in size before and after the largest wave. Look at the time of
the waves (shown at the top of the figure). You will notice that there are multiple minutes between the
waves. The waves do not always occur at regular intervals. You will also notice that this figure shows
over two hours of measurements. Multiple waves occurred during this period of time. The tsunami
event was not over after the first wave and lasted for over two hours.

Figure 2. Measurements of water height at Wailuku River Bridge, Hilo, Hawaiʻi during the night of May 23rd, 1960. These
measurements document the arrival of multiple tsunami waves, which originated from an earthquake in Chile. These
measurements were taken by Jerry Eaton and colleagues.

                                                              5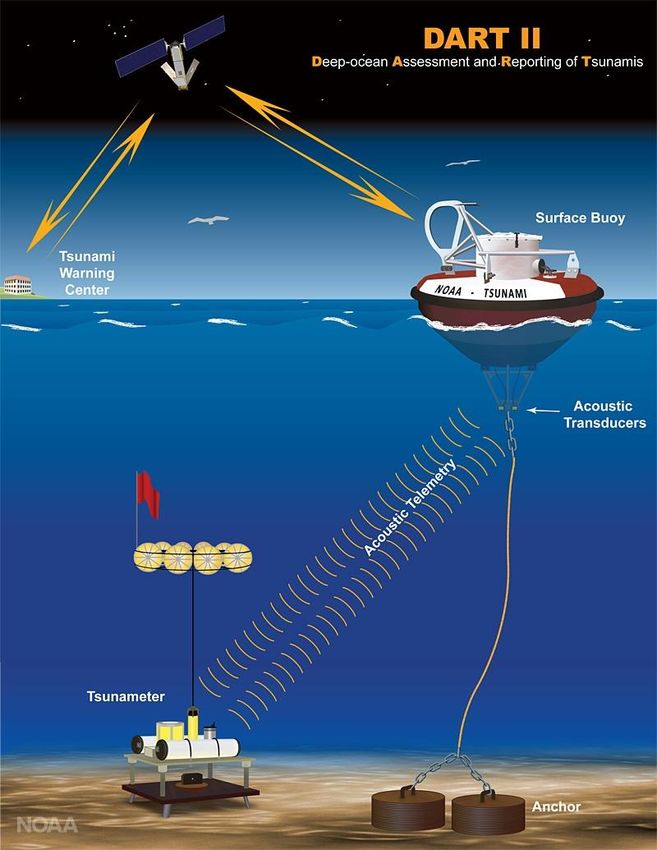
What causes a tsunami?

       A tsunami starts when a large amount of energy is transferred to the water suddenly, for
example, during an earthquake.

        To explain what this means, let’s use an example. Visualize diving into a pool of perfectly still
water. When you dive into the pool, your sudden entry causes water to move. The force and energy
from your dive now transfers to the water in the pool. You will notice concentric rings of ripples moving
away from your point of entry. These ripples show the location of the energy and the movement of
energy throughout the pool.

        Now, let’s use the example of an underwater earthquake. Similarly, when an earthquake
happens on or below the ocean floor, water is suddenly moved or displaced. The energy from that
displacement is transferred to the water. This energy then ripples out in all directions.

       Tsunami waves are energy moving through the water. This means that rather than individual
water molecules moving all the way from far out in the ocean to shore, energy is moving from the
tsunami source to shore through the water. An analogy is people in a stadium doing “the wave.” When
people do “the wave” in a stadium, it is not one group of people walking though the stadium waving
that makes it look like there is a wave going through the stadium. Instead, it is one group standing up
and waving, and then the next group standing up and waving, and so on. The “energy” has moved
through the stadium even though the original group of people have not walked away from their seats.

        A large transfer of energy through the water allows tsunami waves to move very quickly through
the open ocean. They can travel at the speed of a commercial jet in deep water (at over 500 miles per
hour). Close to shore, they slow down to about the speed of a car in a residential neighborhood (20 or
30 miles per hour).

What happens as a tsunami wave moves inland?

        When the tsunami moves farther from the source, the energy spreads out and starts to
dissipate. As the tsunami comes to shore, friction with the ocean bottom causes the waves to slow
down. When tsunami waves slow down, their wave heights increase, often dramatically. The same
amount of energy is now concentrated in less water. The tsunami wave is still powerful.

        Even though energy dissipates as the tsunami moves further away from the source, it is
important to realize that a tsunami can still be dangerous and deadly, even far from the source of the
tsunami. For example, on May 22nd, 1960, Chile was hit by a magnitude 9.5 earthquake, the largest
earthquake ever recorded. 15 hours later, a 35-foot wave hit Hilo Bay in Hawaiʻi, killing sixty-one
people.

         The height of the tsunami wave above sea level is called the tsunami’s runup. Inundation is how
far inland the tsunami waves travel. Inundation will vary from place to place, even on one island,
because it is dependent on the shape of the ocean floor and the land. In a very flat area, the tsunami

                                                    6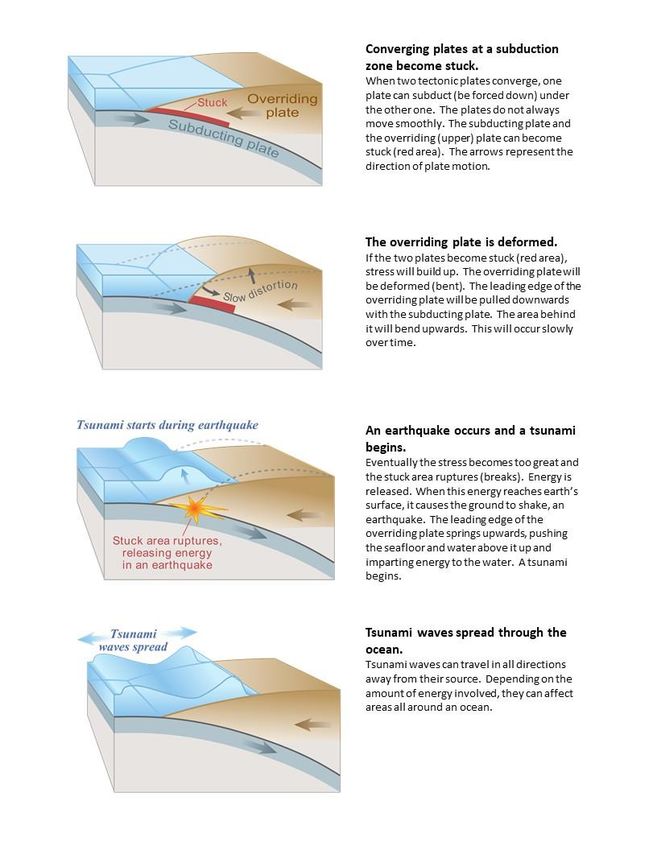
can move farther inland than in a steep area. Therefore, even if the runup is the same in two areas, the
inundation may be different.

Tsunami and plate tectonics

         Why do tsunami occur more frequently in some areas than in others? The answer: Earthquakes
are distributed unequally throughout the world due to plate tectonics.

        What is plate tectonics? Plate tectonics is the underlying cause of many hazards on Earth,
including earthquakes and tsunami. The outer layer of the Earth is broken into pieces, called plates, that
move. Plates can converge (move towards each other), diverge (move away from each other), or slide
past each other. Interactions between these moving tectonic plates can cause earthquakes, which in
turn, can cause tsunami waves to form. Figure 3 shows where different plates are located around the
world, with the different colored areas representing different tectonic plates.

        Now, we will explore the relationship between plate tectonics and a tsunami. Look at Figure 4,
which shows the source locations for world-wide tsunami that occurred between 1610 B. C. to 2017 A.D.
The different symbols represent different causes: volcanic eruptions, landslides, earthquakes, and
unknown causes. Earthquakes (circles) are the most common cause. This figure illustrates that some
areas of the world produce more tsunami than others.

         Now, to illustrate the relationship between plate tectonics and tsunami compare Figure 3 and
Figure 4. Look at the Pacific Ocean. In Figure 3, you will notice that the middle of the Pacific Ocean is on
the Pacific Plate, with plate boundaries surrounding the Pacific Ocean. We will now compare the two
figures, using the Aleutian Islands in Alaska as a starting point. Look at the northernmost part of the
Pacific Plate. Where it borders the North American Plate, you will find the Aleutian Islands on the North
American Plate. Now, find the Aleutian Islands on Figure 4. You will notice that this area has been the
source for many tsunami.

        Look for other plate boundaries in the Pacific Ocean. You will see that most of the western
coasts of North and South America are plate boundaries and have produced numerous tsunami.
Compare this to an area with no plate boundaries, such as the East Coast of the United States. You will
notice that far fewer tsunami started in areas with no plate boundaries than areas on a plate boundary.

        Finally, look at Antarctica. You will notice that it sits on the Antarctic Plate (blue in Figure 3).
Follow the boundary between the Antarctic and Pacific Plate on both Figure 3 and Figure 4. You will
notice that few to no tsunami formed here during this time period. While tsunami tend to start at plate
boundaries, not all plate boundaries have the same number of tsunami-producing events associated
with them. Why? The answer is that there are different types of plate boundaries. Recall that plates
can converge, diverge, or slide past each other. Different types of plate motion will create different
types of plate boundaries.

                                                     7
Figure 3. Earth’s tectonic plates

Figure 4. Locations where tsunami were generated throughout the world from 1610 B.C. to 2017 A.D. Different symbols
represent different tsunami causes. Note that most of the tsunami were caused by earthquakes (circles).

                                                            8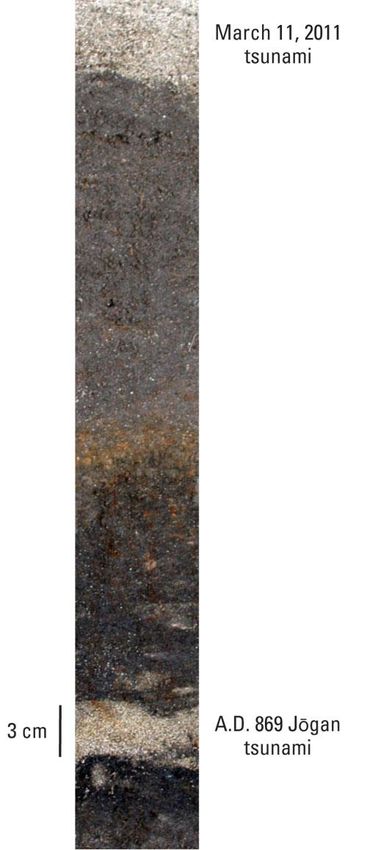
We will now examine subduction zones, a type of plate boundary that can create very large
earthquakes and very powerful tsunami. Where the plates converge, one plate may subduct (be forced
down) under another one. This type of plate boundary is called a subduction zone. The plates do not
slide smoothly past each other. Instead, friction between the plates can cause them to become “stuck.”
More and more pressure builds up as the plates try to move and the overriding (upper) plate deforms.
Eventually, the pressure is too great, the plates move, and an earthquake occurs. The overriding plate
(the plate above the subducting plate) tries to snap back to its previous position and in the process
displaces the water above it, imparting energy into the water and producing tsunami waves. Figure 5
illustrates and describes this process.

        Globally, more than 80% of tsunami are generated in this way. Extremely large earthquakes can
be generated at subduction zones. Subduction zone generated earthquakes can cause some of the most
dangerous tsunami waves in the world. A very large earthquake from a subduction zone can travel
across entire ocean basins, causing damage on coastlines surrounding that ocean. One example is the
2004 Indian Ocean Tsunami. While the tsunami was generated by an earthquake in a subduction zone
near Sumatra, Indonesia, the tsunami was not limited to Indonesia. Countries around the Indian Ocean
were devastated.

       Another hazard found at subduction zones are volcanoes. Volcanoes can also trigger tsunami.

                                                  9
Figure 5. A series of illustrations showing how tsunami can form in subduction zones.

                                                              10
One region that is of particular interest when studying tsunami events is the “Ring of Fire.” The
“Ring of Fire,” is a zone in the Pacific Ocean where tectonic plates interact to create volcanoes,
earthquakes, and therefore tsunami waves. To see the location of the “Ring of Fire,” look at Figure 6,
which is a map of the Pacific Ocean with the “Ring of Fire” indicated. You will notice that the “Ring of
Fire” mostly circles the Pacific Ocean. Why? Let’s look at the “Ring of Fire” in more detail.
Look at Figure 3 and focus on the Pacific Plate (light yellow). You will notice that most of the
Pacific Ocean is located on the Pacific Plate. Compare Figure 3 to Figure 4 and Figure 6. You will notice
that the shape of the Pacific Plate mostly matches the shape of the “Ring of Fire,” as drawn on Figure 6.
You will also notice that the “Ring of Fire” was the source of many tsunami between 1610 B.C. and 2017
A.D.
Why? Remember that the type of interaction between the tectonic plates governs what hazards
occur at those locations. Look at Figure 6, which also shows where major subduction zones are located
throughout the Pacific Ocean. You will notice that many of the plate boundaries around the Pacific are
subduction zones, meaning that this region is at risk for large tsunami waves.
Figure 6. Map of the “Ring of Fire.” Blue lines are subduction zones. Notice how many subduction zones there are around the
Pacific Ocean.
11Tsunami warning system in the United States
On April 1st, 1946, a large earthquake struck Alaska. Near the earthquake, the tsunami waves
were as high as 138 feet or 42 meters. About five hours later, a 45 foot (13.7 meter) tsunami hit Hilo
Bay in Hawaiʻi, killing 159 people. If those 159 people had received a warning, many or all of them could
have survived. As a result, in 1949, the United States started a tsunami warning system.
There are now two tsunami warning centers in the United States: The National Tsunami
Warning Center in Palmer, Alaska and The Pacific Tsunami Warning Center in Honolulu, Hawaiʻi. Both
operate 24 hours a day and seven days a week, year-round. Figure 7 shows a scientist monitoring for a
tsunami.
Figure 7. A scientist monitors for tsunami.
How can these centers forecast a tsunami? Remember that most tsunami waves are caused by
earthquakes. Therefore, the tsunami warning centers monitor and analyze earthquakes.
When an earthquake occurs, scientists must first determine where the earthquake occurred. If
the earthquake occurred underwater, there may be a tsunami risk. They also measure the magnitude of
the earthquake, as a larger magnitude earthquake tends to be more likely to cause a tsunami. Lastly,
they estimate how deep in the Earth the earthquake was. Shallow earthquakes are more likely to cause
a tsunami.
12If an earthquake occurs that scientists think may cause a tsunami, they then turn to sea level
gauges to look for evidence of a tsunami. Is the water level higher than normal? DART buoys located at
sea are useful tools to detect a tsunami. Figure 8 shows a diagram of what the DART system looks like.
Sea level gauges (Figure 9) at harbors and other coastal areas are also useful in detecting any unusual
changes in the level of the sea.
Figure 8. Diagram of the DART system
13Figure 9. Image of a coastal water-level station
If information about the earthquake and data from sea level gauges indicate that a tsunami may
occur, scientists must then forecast tsunami behavior and what areas are likely to be impacted by the
tsunami. Tsunami behavior is dependent on several factors. The first factor is the nature of the
earthquake. For example, how deep in the Earth was the earthquake? What was the magnitude of the
earthquake? How did the seafloor move (vertically or horizontally and by how much)? Another factor
is the shape of the sea floor. The speed that the tsunami travels is dependent on the water depth. The
deeper the water, the faster the tsunami can move. Using maps of seafloor depth, scientists can predict
how long it will take for the tsunami to arrive at different locations around the world.
Once scientists have determined that a tsunami is likely, they must forecast the potential runup
of the tsunami at different locations around the world. To do so, they use computer models that predict
tsunami behavior as a tsunami travels across the ocean and as it nears land.
After scientists have studied the earthquake, determined if a tsunami is likely, and forecasted
the runup of any potential tsunami, they can then advise the public by issuing a message. Here are the
messages that you will hear from a warning center:
14• If there is no predicted tsunami hazard, scientists will issue an Information Statement.
• If there is a risk of a tsunami, scientists can issue one of three messages:
o A Tsunami Watch warns citizens and emergency managers that a tsunami threat is
possible in the near future. Citizens should stay tuned for more information.
o A Tsunami Advisory tells the public and emergency managers that there is a marine
threat and/or a near-shore threat. An advisory is issued when the tsunami runup is
forecasted to be 1-3 feet. Beaches will be cleared and people will be asked to stay out
of the ocean and away from the water, but a large evacuation will not be mandated
o A Tsunami Warning is issued when there is a risk that the tsunami will impact farther
inland than the shoreline. A warning is issued if the runup is forecasted to be greater
than three feet. In this case, people in tsunami evacuation zones will be asked to
evacuate.
Figure 10 summarizes tsunami messages from warning centers.
When the tsunami’s runup no longer meets these thresholds, the Tsunami Warning Center will
issue a Cancellation. However, this does not necessarily mean that it is safe to return to the areas that
were impacted by the tsunami. These areas may be covered in potentially hazardous debris and there
may be dangerous ocean and shoreline conditions well after the main tsunami threat has passed. Local
emergency managers and officials decide when to lift the evacuation order and when it is safe for
people to return to their homes and businesses.
Figure 10. Tsunami messages from Tsunami Warning Centers in the United States
15How do you know if there is a threat of a tsunami?
Unfortunately, as tsunami waves are caused by powerful forces of nature, such as earthquakes,
that we cannot control, we cannot prevent a tsunami from forming. All we can do is be prepared.
In the United States, there is a tsunami warning system in place to forecast tsunami events and
inform local officials. In some places, such as Oʻahu, Hawaiʻi, a siren system is designed to alert the
public about a tsunami warning. The Tsunami Warning Centers post information statements, watches,
advisories, and warnings on their websites. Some other places around the world also have tsunami
warning systems. If you live by the water or plan to travel somewhere by the water, it is good to do
some research and learn if that area has a tsunami warning system.
If you are really close to the source of a tsunami, there might not be time for a tsunami warning
system to inform you of the risk of a tsunami. Furthermore, not everywhere in the world along a
coastline has a tsunami warning system, or the warning system may be damaged or destroyed due to
the earthquake that caused the tsunami. Therefore, it is important to know some of the natural
warning signs of a tsunami. This knowledge can save your life. If you experience any one of these
natural warning signs, do not wait for a siren or an official warning. Move to higher ground
immediately.
Some natural warning signs of a tsunami are:
• You may feel an earthquake. If you are near the water and feel an earthquake, it is important to
get to higher ground immediately. The earthquake may have triggered a tsunami.
• If the trough of the wave arrives first, the ocean will recede like an extremely low tide and areas
that are normally underwater will be exposed. Note: The sea does not always recede before a
tsunami arrives.
• If the crest of the wave arrives first, the ocean will surge onto the beach. It can look like a
rapidly rising tide, but it does not stop.
• You may see a bore, a wall of water.
• You may hear a loud roar from the ocean.
Note: You may not observe all of these signs before a tsunami arrives.
One person’s knowledge of the natural signs of a tsunami saved many lives during the 2004
Indian Ocean Tsunami in Thailand. While on vacation in Thailand with her family, 10 year old Tilly Smith
noticed that the sea was high on the beach. Waves were coming in but not leaving. The water looked
“frothy and fizzy”. She noticed a log that kept spinning around in the water. Then, she realized what
was happening: a tsunami was approaching. Just two weeks earlier, in her geography class, she had
learned about tsunami waves and watched a video of a tsunami in Hawaiʻi. Incredibly, she remembered
and recognized the natural signs of a tsunami and urged her family and others to run away from the
beach and move to higher ground. Her father alerted a security guard who then yelled for people to
evacuate. Tilly then saw a wall of water approaching. Tilly, her family, hotel employees, and guests took
shelter on an upper floor of the hotel. After the initial wave, she warned the people that more waves
could arrive and that they should remain in the upper floors of the hotel. Luckily, no one on their beach
died in the tsunami that killed almost 230,000 people.
16What should you do in the case of a tsunami?
Knowledge about tsunami safety is important for everyone. Even if you do not currently live by
the ocean, you may one day live or vacation there, so it is important to understand what to do in the
case of a tsunami.
If you are in an area that is at risk of being flooded during a tsunami, it is important to get to
higher ground as soon as possible. This may mean traveling inland. In many areas of the world, if you
are able to walk inland towards higher ground, that may be a better choice than driving because traffic
jams can occur when many people attempt to evacuate at once. If there is not time to move inland and
there are sturdy buildings in the area with at least four levels, you may need to “vertically evacuate.”
Buildings with an open floor plan are best. Go to one of those tall buildings and climb the stairs to at
least the 4th floor. Because there may be many other people on the stairs behind you that are also
trying to evacuate, it is advisable to keep climbing if possible. Note that not all buildings are built to
withstand a tsunami.
How do you know if the area you are in is at risk if a tsunami arrives? In some area of the world,
scientists, community leaders, and emergency managers have developed evacuation plans. To do so,
scientists prepare maps that predict the risk of inundation from different sizes of tsunami. In order to
prepare these maps, they study past tsunami events and earthquakes and use models to understand
what may occur in the future. Emergency managers then use these maps to create evacuation plans for
the region. These plans include evacuation maps, evacuation routes, and designated evacuation
shelters. It is important to familiarize yourself with the evacuation plan in the area where you are living
or are visiting.
Let us look at the island of Oʻahu, Hawaiʻi as an example. There are two evacuation zones on
Oʻahu: 1. The Tsunami Evacuation Zone and 2. The Extreme Tsunami Evacuation Zone. If you are in one
of these two evacuation zones when a tsunami occurs, you may need to evacuate. During a tsunami
evacuation, you will need to either move inland to a safe zone or practice vertical evacuation.
The map below shows the Waikīkī area of Oʻahu (Figure 11). The red zone is the Tsunami
Evacuation Zone. It is the zone closest to the ocean and people in this zone must evacuate in the case of
any tsunami warning. People in the yellow zone, the Extreme Tsunami Evacuation Zone, evacuate only
in the case of a larger tsunami. People in the Safe Zone (green) do not have to evacuate. When a
tsunami threatens, emergency managers tell citizens which zone(s) must evacuate. A series of detailed
evacuation maps has been made for all coastal areas on Oʻahu.
17Figure 11. Tsunami evacuation map for Waikīkī, Hawaiʻi
If you live by the ocean, familiarize yourself with the evacuation zone(s), evacuation plans,
evacuation routes, and the evacuation shelters for your community. Do you live, work, shop, or go to
school in an evacuation zone? Think about what you would do during a tsunami. Would you be
required to leave your work, home, or school? If so, where would you go?
If you are vacationing in an area near an ocean, read the tsunami safety and evacuation plans so
you will know what to do and where to go in the case of a tsunami.
18Paleotsunami research and indigenous knowledge aid tsunami
understanding and emergency preparedness
How can we predict future tsunami strength and risk? To do this, scientists examine multiple
types of records throughout the world.
Written records can provide detailed information about past tsunami events. Scientists can use
these records to determine when a tsunami occurred and the damage it caused. While these records
can be very detailed and useful to scientists, they often do not extend back far into time.
In many places around the world, information about past tsunami events and tsunami safety are
recorded in oral traditions. These stories and legends tell scientists where a tsunami occurred in the
past. For example, local Native Americans shared stories about the 1700 Cascadia earthquake and
tsunami, which originated in what is now the states of Oregon, Washington and Northern California,
plus Vancouver Island in Canada.
Oral traditions containing information about tsunami safety can save lives. For example, on
December 26th, 2004, a tsunami in the Indian Ocean killed almost 230,000 people. Although Simeulue
Island was close to the epicenter of the earthquake which triggered the tsunami, only seven of 75,000
people living on the island died. Why? Many people survived because of oral traditions passed down
over generations. These oral traditions warned Simeulue Island residents that feeling an earthquake
and observing receding water were signs that a tsunami would quickly arrive and to move immediately
to higher ground.
Scientists also use paleotsunami studies of rock, sediment, and/or soil layers to better
understand tsunami threats. Scientists examine the layers for signs of tsunami deposits, such as the
presence of sand or large grain size and/or rock debris in areas where such deposits would not normally
occur. For example, scientists might find many layers of mud and then a layer of sand and rock debris.
The layer of sand and rock debris could be a tsunami deposit, which has brought in larger particles than
typically found in the area of study.
For surface or near surface deposits, geologists dig pits or trenches to look at sediment layers.
Figure 12Figure 12 is an image of such a trench where tsunami and non-tsunami layers can be seen. For
deeply buried sediment or rock, geologists drill into the ground and pull out sediment or rock cores.
Cores are cylinders of sediment or rock that contain layers deposited over time. These layers sometimes
contain tsunami deposits. Figure 13 is an image of a sediment core from Japan showing two tsunami
deposits, as well as non-tsunami related layers.
If geologists discover tsunami deposits, they trace the extent of the tsunami by looking for the
same deposit in many nearby areas. Geologists can then determine how far inland the tsunami went. In
some cases, the damage caused by a tsunami is still present. In Washington and Oregon, a tsunami
caused by the large 1700 Cascadia earthquake caused the ground near the ocean to fall five feet. The
ensuing tsunami waters rushed inland, killing large cedar trees. These “ghost trees” are visible today. If
a similar event were to occur today, the damage would be catastrophic.
19Geologists age date the tsunami layers to determine when the tsunami occurred. If multiple
layers of tsunami deposits exist, geologists then count the number of tsunami events over the period of
time represented by the rock or soil layers to determine the recurrence interval.
The recurrence interval is a measure of how often a tsunami occurs. If the recurrence interval of
a tsunami with a 10-foot runup is 100 years, this means that a tsunami with a runup of 10 feet occurs on
average every 100 years. Note that the recurrence interval gives the average amount of time between
tsunami events, not the exact amount of time. In other words, it cannot be used to predict the exact
timing of a future tsunami event. In the example, if a tsunami with a 10-foot runup occurred in 2010,
that does not mean that there will not be a tsunami with a 10-foot runup until 2110. A tsunami could
happen this year or it could happen after the year 2110.
Figure 12. Image of a trench that scientists have dug into sediment layers to look for tsunami deposits. The dark grey squares
represent locations where sediment samples were collected for further analysis.
20Figure 13. A sediment core from Arahama, Japan showing two tsunami deposits, as well as non-tsunami related sediment layers.
21Conclusion
A tsunami is a powerful and dangerous event, where a series of large waves can inundate the
shoreline and sometimes far inland. Waves can flood the land for a long period of time and the first
wave is not always the largest. Tsunami waves are most frequently generated by underwater
earthquakes, volcanic eruptions or landslides, with earthquakes being the most common cause. While
tsunami cannot be prevented or predicted days, months, or years in advance, there are steps that we as
a society can take to try to minimize the impacts of tsunami. Scientists can use paleotsunami research
and modeling to understand what can happen in an area in the future and create maps of areas that are
at the most risk. Emergency managers and community leaders can use this information to make
evacuation maps and plans. In some locations, oral traditions and traditional knowledge of tsunami
safety are being revitalized. After an underwater earthquake occurs, scientists can forecast if, when,
and where a tsunami may occur. In the United States, two tsunami warning centers study tsunami and
make these forecasts. Emergency managers and community leaders can then use this information to
order evacuations, if necessary.
There are steps that everyone can take to help keep themselves, their family, friends, and
community safer. Study the tsunami evacuation maps of the area where you live or vacation and know
what you would need to do if a tsunami occurs. Realize that it is not always possible for an official
warning to reach you before the first tsunami wave arrives in an area if that area is close to the source
of the tsunami. Furthermore, some areas may not have warning systems in place. Therefore, it is
important to know the possible warning signs of a tsunami and to be alert for these signs while at the
beach.
22Some further reading
• Information from The National Oceanic and Atmospheric Administration’s Tsunami Program
can be found at the following link: https://www.tsunami.noaa.gov/
• Information from The National Oceanic and Atmospheric Administration / National Weather
Service’s U.S. Tsunami Warning System can be found at the following link:
https://www.tsunami.gov/
• Information from The International Tsunami Information Center can be found at the following
link: http://itic.ioc-unesco.org/index.php
• Information from The Pacific Tsunami Museum can be found at the following link:
http://tsunami.org/
• Information from The Intergovernmental Oceanic Commission Tsunami Programme can be
found at the following link: http://ioc-tsunami.org
• A list of International Tsunami Information Centers can be found at the following link:
http://itic.ioc-
unesco.org/index.php?option=com_content&view=category&layout=blog&id=2006&Itemid=20
06
Acknowledgments
Thank you to Dr. Jonathan Sleeper for edits.
Thank you to Dr. Nathan Becker, Dr. Gerard Fryer, and Dr. Cindi Preller from the Pacific Tsunami
Warning Center for helpful presentations and conversations.
Sources
Source for title page photograph
United States Navy (Accessed May 2021). Catastrophic damage from the 2004 Indian Ocean Tsunami. As
accessed on Wikipedia.
https://en.wikipedia.org/wiki/2004_Indian_Ocean_earthquake_and_tsunami#/media/File:US_N
avy_050102-N-9593M-
040_A_village_near_the_coast_of_Sumatra_lays_in_ruin_after_the_Tsunami_that_struck_Sout
h_East_Asia.jpg
23Source for the title page quotation
Ryder, S. and Dafedjaiye, H. (Accessed July, 2020). Tsunami stories: Your experiences. BBC.
https://www.bbc.com/news/30462238
Sources for Figures
Figure 1: Omegatron on Wikipedia. (Accessed July 2020). Waveforms. Modified with labels.
https://en.wikipedia.org/wiki/Waveform#/media/File:Waveforms.svg
Figure 2: United States Geological Survey. (Accessed May 2021). Measurements of water height at
Wailuku River Bridge, Hilo, Hawaiʻi during the May 23rd, 1960 Tsunami.
https://pubs.usgs.gov/circ/c1187/#fig08
Figure 3: United States Geological Survey. (Accessed June 2020). Tectonic Plates of the Earth.
https://www.usgs.gov/media/images/tectonic-plates-earth
Figure 4: The National Geophysical Data Center (now known as The NOAA National Centers for
Environmental Information)/World Data Center. (Accessed May 2021). Global tsunami sources
from 1610 B.C. to 2017 A.D. http://itic.ioc-
unesco.org/images/stories/awareness_and_education/map_posters/2017_tsu_poster_2018031
3_a2_low_res.pdf
Figure 5: United States Geological Survey. (Accessed May 2021). A series of illustrations showing how
tsunami can form in subduction zones. Modified. https://pubs.usgs.gov/circ/c1187/c1187.pdf
Figure 6: United States Geological Survey. (Accessed June 2020). Volcanic arcs and oceanic trenches
partly encircling the Pacific Basin form the so-called Ring of Fire, a zone of frequent earthquakes
and volcanic eruptions. https://pubs.usgs.gov/gip/dynamic/fire.html
Figure 7: National Oceanic and Atmospheric Administration. (Accessed July 2020). Scientists at the
tsunami warning centers monitor for tsunamis and the earthquakes that cause them.
https://www.noaa.gov/explainers/us-tsunami-warning-system
24Figure 8: National Oceanic and Atmospheric Administration. (Accessed July 2020). This diagram shows
how tsunami wave information in the deep ocean is transmitted from DART systems via satellite
to NOAA’s tsunami warning centers. https://www.noaa.gov/explainers/us-tsunami-warning-
system
Figure 9: National Oceanic and Atmospheric Administration. (Accessed July 2020). Observations from
coastal water-level stations help the warning centers issue accurate tsunami alerts.
https://www.noaa.gov/explainers/us-tsunami-warning-system
Figure 10: National Weather Service. (Accessed July 2020). Tsunami messages.
https://www.weather.gov/safety/tsunami-alerts
Figure 11: The City and County of Honolulu. (Accessed June 2020). Tsunami evacuation map for
Waikīkī, Hawaiʻi. http://www.honolulu.gov/site-dem-sitearticles/35781-tsunami.html
Figure 12: United States Geological Survey. (Accessed July 2020). Image of a trench that scientists have
dug into sediment layers to look for tsunami deposits.
https://archive.usgs.gov/archive/sites/soundwaves.usgs.gov/2011/06/index.html
Figure 13: United States Geological Survey. (Accessed July 2020). Sediment core from Arahama, Japan.
https://archive.usgs.gov/archive/sites/soundwaves.usgs.gov/2011/06/index.html
25You can also read