Pandemic-stage propagation dynamics in South Africa suggest pre-existing cross-reactive protection against severe Covid-19
←
→
Page content transcription
If your browser does not render page correctly, please read the page content below
Pandemic-stage propagation dynamics in South Africa suggest pre-existing cross-reactive protection against severe Covid-19 Francois Engelbrecht ( Francois.Engelbrecht@wits.ac.za ) University of the Witwatersrand https://orcid.org/0000-0002-9189-6556 Shabir Madhi University of the Witwatersrand Robert Scholes University of the Witwatersrand Article Keywords: propagation dynamics, COVID-19, pre-existing cross-reactive immunity Posted Date: April 15th, 2021 DOI: https://doi.org/10.21203/rs.3.rs-394828/v1 License: This work is licensed under a Creative Commons Attribution 4.0 International License. Read Full License
1 Pandemic-stage propagation dynamics in South Africa suggest pre-existing
 2 cross-reactive protection against severe Covid-19
 3
 4 Francois A. Engelbrecht*,1,2, Shabir A. Madhi3,4 and Robert J. Scholes1,2
 5
 6 1. Global Change Institute, University of the Witwatersrand, South Africa
 7 2. Covid-19 Environmental Reference Group, South Africa
 8 3. South African Medical Research Council Vaccines and Infectious Diseases Analytics
 9 Research Unit (VIDA), University of the Witwatersrand, South Africa
10 4. African Leadership in Vaccinology Expertise, University of the Witwatersrand, South
11 Africa
12
13
14
15 Abstract
16
17 Early in the Covid-19 outbreak, it was speculated that pre-existing cross-reactive immunity from
18 prior BCG vaccination or exposure to common cold human coronaviruses might confer some
19 protection against Covid-19. Following a year of circulation of SARS-CoV-2 through the world,
20 epidemiological dynamics allow a test of this hypothesis. A dynamic epidemiological model was
21 fitted to the Covid-19 attributed ‘excess deaths’ in South Africa, a country with a long-standing
22 BCG vaccination program and where social-economic circumstances potentially result in frequent
23 exposure to common cold coronaviruses. We show that Covid-19 propagation dynamics in South
24 Africa are consistent with an initially fully susceptible population (no prior cross-immunity
25 protecting against infection), but this requires assuming values of the infection fatality rate (IFR)
26 below or at the lower plausible range (0.31 to 0.53) of internationally reported values. This
27 suggests that some form of pre-existing protection against severe Covid-19 may exist in South
28 Africa. The observed disease propagation dynamics can be explained by both long-lasting
29 immunity and various scenarios of reinfection in the presence of the more transmissible B.1.351
30 variant, which is also relatively resistant to antibodies induced by infections of prototype SARS-
31 CoV-2. All scenarios of reinfection also require assuming a low IFR in order to replicate the
32 observed attributes of the outbreak.
33
34 Introduction
35
36 In the early stages of the Covid-19 pandemic it was suggested that population-wide vaccination
37 programs such as for Bacille Calmette-Guérin (BCG) vaccines may have conferred trained-
38 immunity to SARS-CoV-2 (O’Neill and Netea, 2020), but later assessments provide evidence to
39 the contrary (Lindestam Arlehamna et al., 2020; Wassenaar et al., 2020). It has also been
40 suggested that previous exposure to common cold cornaviruses could result in cross-reactive T-
41 lymphocyte immunity to SARS-CoV-2 (Braun et al., 2020; Sette and Crotty, 2020). These studies
42 indicated T-cell reactivity to SARS-CoV-2 in more than 30% of individuals not previously exposed
43 to SARS-CoV-2 (Braun et al,, 2020; Grifoni et al., 2020), however, the clinical relevance of this
44 reactivity is unknown (Sette and Crotty, 2020). Despite limited testing on the African continent, it
45 has been assessed that the burden of Covid-19 in the early stages of the pandemic in African
46 countries was less severe than expected (Mbow et al., 2020, Nature, 2020; ScienceMag 2020;
47 Uoga et al., 2021). This has fueled the notion that greater exposure to common cold coronaviruses
48 in high population density, low-income settings may provide cross-reactive protection to Covid-19
49 (Mbow et al., 2020; Uoga et al., 2021).
50
1 In South Africa, millions of people live in crowded conditions and there is a long-standing BCG
 2 vaccination program. Hence, South Africa is well placed to investigate whether widespread cross-
 3 immunity against COVID-19 exist in the population. The time-course of Covid-19 reported cases
 4 in South Africa is shown in Figure 1. With a testing rate of approximately 85 per 1 000 population
 5 during the course of the first wave, the SARS-CoV-2 positivity rates in suspected cases exceeded
 6 25% at the peak of the first wave (Our world in data, 2021), suggesting that the recorded number
 7 of Covid-19 cases and deaths was likely underestimated, as in most other countries (Li et al.,
 8 2020).
 9
10 The first cases of Covid-19 were detected in March 2020. Propagation of the disease was initially
11 attenuated by a national lockdown, among the strictest in the world (Supplementary Table 1;
12 Stiegler and Bouchard, 2020). In May and June, some non-pharmacological interventions (NPI),
13 particularly permission for mass gatherings and use of public transport, were progressively
14 relaxed, and by June 2020 cases started to surge (Garba et al., 2020; Figure 1). Covid-19 cases
15 peaked in mid-July (NICD, 2020a; Figure 1), with medical infrastructure and services severely
16 tested but generally not overwhelmed. By mid-August, recorded Covid-19 cases, hospitalizations
17 and deaths had all dropped by 80% relative to the peak (Bradshaw et al., 2020; NICD 2020a,
18 2020b; Figure 1), and in September a period of ‘slow burn’ in infections signified a new phase in
19 the progression of the outbreak (Figure 1). Serological testing in selected communities in the
20 Western Cape Province of South Africa suggested 35-45% of people had been infected with
21 SARS-Cov2 by August 2020 (Hsiao et al., 2020). This is far lower than the threshold range for
22 classical herd immunity to set in, as determined by the plausible range of the basic reproduction
23 number (R0) for Covid-19 (Britton et al., 2020; Fontanet and Cauchemez, 2020), and associated
24 range in final epidemic size (Miller, 2012, Meehan et al., 2020). The simplest hypothesis for the
25 first wave peaking below the classical herd immunity threshold is evolving community resistance
26 with the high force of infection, coupled with partial adherence to NPIs (despite return to lower
27 official levels), transiently reducing the effective reproductive rate to below 1.0.
28
29 At the end of October 2020 a resurgence of Covid-19 started in the Eastern Cape province and
30 swiftly spread to the Western Cape and KwaZulu-Natal, reaching Gauteng and other interior
31 provinces by December 2020 (Figures 1 and 2). The resurgence exceeded the number of deaths
32 recorded during the first wave (Figure 2), and in December 2020 and January 2021 threatened to
33 overwhelm hospitals and medical infrastructure (NICD, 2020b). There are two plausible
34 explanations for the resurgence of Covid-19: further relaxations in NPI (particularly unrestricted
35 mass gatherings) (Supplementary Table 1, Figure 1); and/or the emergence of the B.1.351 (or
36 N501Y.V2) variant. Based on a modelling assessment undertaken in the United Kingdom, the
37 B.1.1.7 lineage that shares the common N501Y mutation in the spike protein is 40-80% more
38 transmissible than earlier variants (Volz et al., 2020). Furthermore, the neutralizing antibody
39 activity induced by infection from ancestry SARS-CoV-2 variants has less than a tenth of the
40 potency against viruses with the key mutations of the immundominant epitopes identified in the
41 B.1.351 variant (Greaney et al., 2020; Wibmer et al., 2021). This variant, by February 2021, was
42 the cause of 90% of all Covid-19 cases in South Africa (Moyo-Gwete et al., 2021). The second
43 wave of infections was in decline across all South African provinces by mid-January 2021, in the
44 presence of enhanced NPI implemented by the South African government in late December 2020
45 (Figures 1 and 2; Supplementary Table 1).
46 We use a compartment model of the Covid-19 pandemic in South Africa to explore the
47 propagation dynamics of the disease in the populous provinces of Gauteng, the Western Cape
48 and Eastern Cape. In particular, we test whether the observed dynamics are consistent with the
49 pre-existence of widespread cross-reactive immunity (here defined broadly, to include both
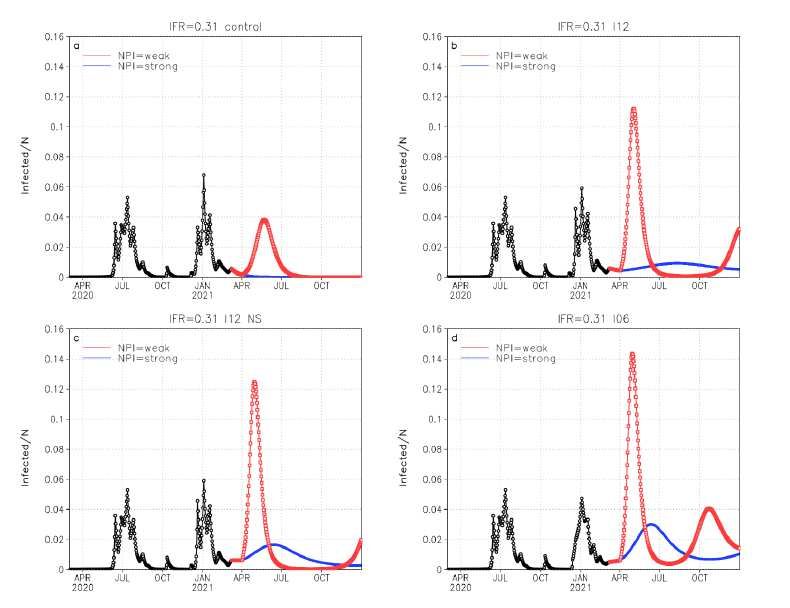
1 immunity from earlier exposure to common cold coronaviruses and/or trained immunity derived
 2 from BCG and other vaccines) protecting against infection and/or severe Covid-19. We also
 3 explore the extent to which Covid-19 reinfections, either because of the B.1.351variant
 4 overcoming disease-induced immunity by earlier variants, or because of immunity being gradually
 5 lost over a period of months, are consistent with the observed propagation dynamics of the
 6 disease. We proceed to project the evolution of the disease in South Africa for these different
 7 scenarios, as a way to test the various hypotheses. The findings are interpreted within the context
 8 of COVID-19 vaccination programs being started in low and middle income countries such as
 9 South Africa.
10
11
12 Results
13
14 Gauteng Province
15
16 Modelled infection curves inversed from excess deaths (Methods) in the Gauteng Province of
17 South Africa, assuming an IFR of 0.31, are shown in black lines in Figure 3 for the scenarios of
18 disease-induced immunity lasting perpetually (panel a), 12 months (panel b) and 6 months (panel
19 d). A scenario where immunity generally lasts 12 months, but where an abrupt loss of immunity
20 in 50% of the population occurred in late November 2020 in association with the emergence of
21 the B.1.351 variant (Methods), is portrayed in panel d. The reconstructed infection curves span
22 the period 1 March 2020 to 7 March 2021 (Methods). An IFR of 0.31 is well below the
23 internationally estimated plausible range of the IFR, of 0.53 to 0.82 (Meyerowitz-Katz and Merone,
24 2020). For all cases, the modelled number of infections display the key features of the reported
25 cases and deaths, and excess deaths in Gauteng: a first wave peaking in early July 2020, followed
26 by about three months of low numbers of infections between September and November, and a
27 second wave of amplitude similar to the first (Figure 2 c and g), reaching its peak in early January
28 2021.
29
30 For all the scenarios considered, the number of infections need to be about 26% of the population
31 by the end of August (representing the end of the first wave; Supplementary Table 2.1), in order
32 for the simulations to reproduce the corresponding number of accumulated excess deaths.
33 Serological surveys indicate about 25% of the Gauteng population infected by the end of August
34 2020 (Portia Mutevedzi - MRC, personal communication). The estimated value of R0’ (the basic
35 reproduction number as modified by NPI, Methods) for the 6-week period preceding the peak of
36 the first wave is close to 1.1 for all the cases considered (Supplementary Table 3.1) (this is
37 because of almost equal fractions of the population being susceptible across the various
38 scenarios during this time). By 7 March, post the second wave, the simulations suggest that the
39 fraction of the total population that had been infected in the first plus second wave is about 51%
40 (Suppementary Table 2.1). The findings of post second wave seroprevalance surveys are not
41 available for comparison as yet.
42
43 The reconstructed values for R0’ for the second wave range between 2.6 and 3.3 across the
44 various scenarios of reinfection (Supplementary Table 3.1). This range of numerical estimations
45 is a function of the different sizes of the pools of susceptible individuals available at the onset of
46 and during the second wave for the various scenarios under consideration (Methods). The
47 substantial increase in transmissibility from the first wave to the second, estimated to range
48 between 136 and 175%, is likely due to the combined effect of reduced compliance to NPI
49 recommendations (both in terms of rules, and their observance) during the December 2020
50 vacation period and the arrival of the B.1.351variant in Gauteng in late November 2020.
51
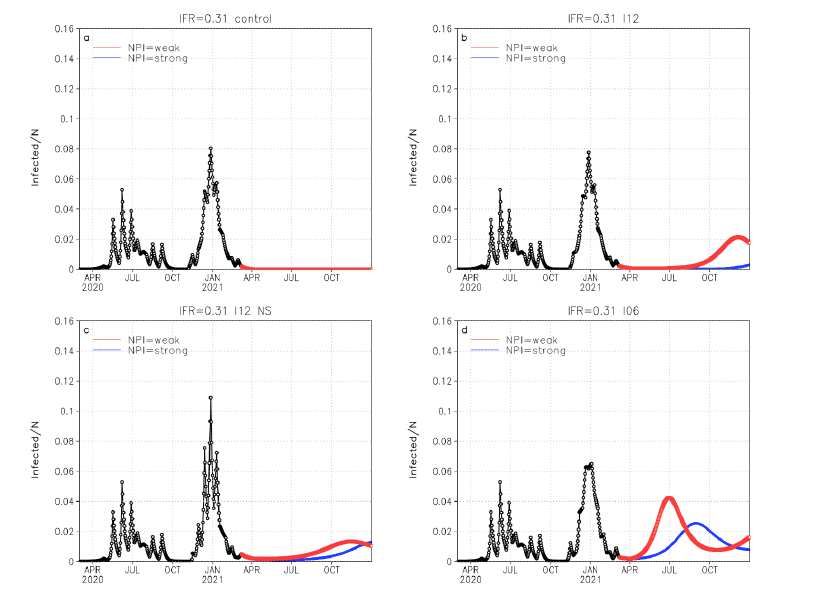
1 Substantially lower values of the IFR in Gauteng province represent a contradiction that begs an
 2 explanation. An assumed IFR of 0.2 yields a total of 41% of the population infected by the end of
 3 August (that is, during the first wave; Supplementary Table 2.1), but serological testing suggests
 4 a lower percentages (Portia Mutevedzi - MRC, personal communication). The accumulated
 5 infections are modelled to be about 80% of the population by 7 March 2021 (Supplementary Table
 6 2.1).
 7
 8 For an IFR of 0.53, which is the lower limit of the internationally estimated range (Meyerowitz-
 9 Katz and Merone, 2020), accumulated infections are simulated to be 15% by the end of the first
10 wave and 30% by the end of the second wave (Supplementary Table Table 2.1). The post first
11 wave value is well below the estimate from a serological survey (Portia Mutevedzi - MRC,
12 personal communication). The estimated values of R0’ for IFR=0.53 range from 2.3 to 2.6 for the
13 cases under consideration (Supplementary Table 3.1), and are indicative of substantial increases
14 (109-136%) in transmissibility following the appearance of the B.1.351 variant. For values of IFR
15 in the mid (IFR=0.68) and upper (IFR=0.82) globally reported ranges, the modelled accumulated
16 infections by the end of the first and second waves are deemed to be unrealistically low in
17 comparison to the surveyed seroprevalence, indicating that these values of the IFR would be
18 overestimates for the Gauteng population (Supplementary Table 2.1).
19
20 The projected propagation of infections in the Gauteng province beyond 7 March 2021 is shown
21 in Figure 3, assuming an IFR of 0.31. In these simulations, it is assumed that R0’ is restricted to
22 1.4 between 7 March and 1 April 2021, which is sufficient to prevent the resurgence of infections
23 during this time. From 2 April onwards, it is assumed that reduced adherence to the existing Level
24 1 NPI in South Africa will increase R0’, according to two scenarios. The first is a worst case
25 scenario, where R0’ assumes the same value it had during the second wave of infections in
26 Gauteng (Supplementary Table 3.1). The second is a best-case scenario, where R0’ remains
27 restricted to a value of 1.6 (lower that any of the plausible R0’ values constructed for the second
28 wave in Gauteng and two other provinces (Supplementary Tables 3.1 to 3.3; Methods). Under
29 the worst case scenario, even for the case of persistent immunity, a third wave forms and peaks
30 late in May 2021, with an amplitude similar to those of the first two waves (Figure 3a). A further
31 30% of the population is projected to be infected during the 3rd wave, before community immunity
32 is reached to sustain interruption in chains of transmission of the virus. For the cases where
33 immunity is lost and reinfections occur, the third wave of infections can be substantially larger in
34 amplitude than the first two waves (in the absence of strengthening NPI or widespread
35 vaccination; Figures 3 b to d). In these cases the third wave peaks earlier, in early May 2021.
36 Fourth waves of infection also form for all these cases, peaking as early as November 2021 for
37 the case of immunity lost within six months (Figure 3d). Restricting R0’ to 1.6 is sufficient to
38 prevent the formation of a 3rd wave for the case of persistent immunity (Figure 3a), and delays its
39 formation and restricts its amplitude to about 50% or less of that of the second wave for all the
40 scenarios of reinfection considered (Figure 3 b to d).
41
42 Western Cape
43
44 Reported cases (Figure 2a) and excess deaths (Figure 2e) suggest that the second wave peaked
45 at 2 to 3 times the amplitude of the first in the Western Cape. This behavior can be replicated in
46 the modelled infection curves by assuming an IFR of 0.31 (Figure 4, black lines). For this value
47 of the IFR 26% of the population is simulated to have been infected by the end of August 2020
48 (after the first wave; Supplementary Table 2.2), which is somewhat lower than the 35-45 %
49 seroprevalence recorded in selected communities in the Western Cape (Hsiao et al., 2020). The
50 value of R0’ reconstructed for the first wave of infections is close to 1.1 (Supplementary Table
51 3.2). Accumulated infections are modelled to be about 75% of the population by 7 March
1 (Supplementary Table 3.2), post the second wave. The second wave is associated with values of
 2 R0’ ranging between 1.7 and 2.4 for the various cases under consideration (Supplementary Table
 3 3.2), which represents increases in transmissibility of 54-100 % compared to the first wave.
 4
 5 For an IFR of 0.2, the modelling is indicative of 41% of infections by the end of the August 2021
 6 (occurring in association with the first wave), and in the upper range of the fraction infections
 7 indicated for August 2020 by serological testing undertaken in selected communities (Hsiao et al.,
 8 2020). However, for the case of a persistent disease-induced immunity in an initially fully-
 9 susceptible population, this leaves an insufficient number of susceptible people for a second-
10 wave of infections to reach three times the amplitude of the first, even with a high-force of
11 infection. For the cases where immunity is lost, a second wave of observed amplitude can be
12 generated, but this requires 115% of the population having been infected by 7 March 2021
13 (Supplementary Table 2.2). That is, more than 70% of the population is simulated to have been
14 infected during the second wave. Values of the IFR substantially larger than 0.31 also produce
15 reconstructed infection curves that are implausible. For an IFR of 0.53 (0.82), 12% (10%) of the
16 population is modelled to be infected by the end of August 2020, which substantially lower than
17 the fraction of the population found to have been infected by August 2020 in the serological
18 testing. By 7 March 2021, 34% and 28% of the population are modelled to have been infected for
19 levels of the IFR of 0.53 and 0.82, respectively (Supplementary Table 2.2).
20
21 Assuming an IFR of 0.31, the projected propagation of Covid-19 through 2021 is shown as a
22 function of the various cases of immunity under consideration. Noteworthy is that even when
23 assuming the values of R0’ reconstructed for the second wave (red lines), no further substantial
24 growth in the infection curves are simulated for early 2021, suggesting that in all cases a form of
25 community resistance has set in (contradicting the case of Gauteng Province). For the case of
26 persistent immunity (Figure 4a), no third wave of infections form, given that community resistance
27 has set in with about 75% of the population having been infected by 7 March 2021. However, for
28 the remaining three cases under consideration, third waves of infection form and peak between
29 August and December 2021 (Figure 4 b to d). For the cases of immunity lost in twelve months,
30 the third waves are about half the amplitude of the first, but of similar amplitude to the first for the
31 case where immunity is lost in six months.
32
33 Eastern Cape
34
35 A second wave of infections first emerged in South Africa in the Eastern Cape in October 2020
36 (Figure 2b). The wave (using weekly excess deaths as measure, Figure 2f) peaked at about twice
37 the amplitude of the first wave in December 2020, ahead of strengthened NPI in late December
38 2020 (Figure 1, Supplementary Table 1). Although the Eastern Cape and Western Cape
39 provinces in South Africa have roughly equal population sizes (Methods), accumulated excess
40 deaths in the Eastern Cape were almost twice that in Western Cape by the end of the first wave
41 in August 2020 (9 582 deaths vs 5567 deaths). This ratio increased by 7 March 2020, post the
42 second wave in both provinces (33 070 deaths vs 16 041 deaths; Figure 2f). This suggests that
43 one or both of the infection rate and the IFR was substantially higher in the Eastern than in the
44 Western Cape.
45
46 An IFR of 0.31, which provides a good fit for disease dynamics in both the Western Cape and
47 Gauteng provinces, implies 47% of the population having been infected by the end of August
48 2020 in the Eastern Cape (Supplementary Table 2.3). With such a high fraction of the population
49 infected by the end of the first wave, it is not possible for a second wave twice that size to have
50 peaked by December 2020, even in the experiments where immunity is lost within 6 months and
51 where 50% of the population with disease-induced immunity from the first wave had lost that
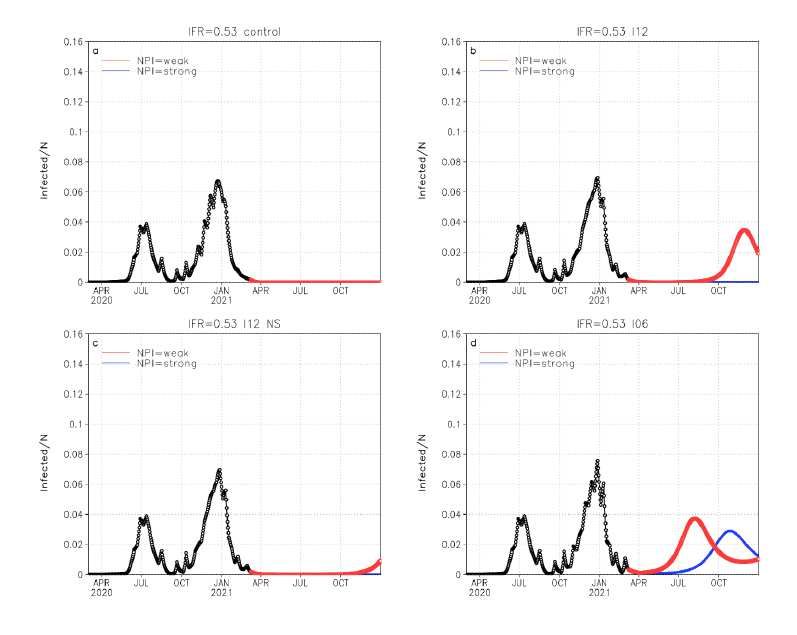
1 immunity in the presence of the B.1.351 variant. Even with the reconstructed accumulated
 2 infections in the range 98-162% (Supplementary Table 2.3), the observed number of excess
 3 deaths by 7 March 2021 can’t be reconstructed.
 4
 5 Assuming an IFR of 0.53 yields 28% of infections by the end of August 2020 (Supplementary
 6 Table 2.3), with R0’ for the first wave estimated to be 1.5 (Supplementary Table 3.3). This leaves
 7 a sufficient number of people susceptible for infection to produce a second wave of twice the
 8 amplitude of the first, in December 2020, with accumulated infections reaching about 94% by 7
 9 March 2020. R0’ of the second wave is estimated to range between 1.8 and 2.8 (representing
10 increases in transmissibility between the first and second wave of 20-87%) (Supplementary Table
11 3.3). The medical infrastructure in the Eastern Cape has a lower capacity than the Western Cape
12 and Gauteng provinces, consistent with the IFR being higher in the Eastern Cape.
13
14 At higher values of the IFR of 0.68 and 0.82, the fractions of the population infected after the first
15 wave are 22 and 18%, respectively, values that are deemed to be at the lower end of plausibility
16 (Supplementary Table 2.3). The corresponding fractions of accumulated infections by 7 March
17 2021 are about 73% and 61% (Supplementary Table 2.3). The reconstructed values of R0’ for
18 IFR=0.68 range between 1.6 and 2 (Supplementary Table 3.3). In other words, the higher IFR
19 and thus fewer infections inversed from excess deaths leave a large portion of the population
20 susceptible, and thus do not require substantially larger values of R0’ (compared to the first wave)
21 for the scenarios of reinfection. This contradicts the notion of increased transmissibility in the
22 Eastern Cape during the second wave, in the presence of the B.1.351 variant and reduced NPI.
23
24 Assuming an IFR of 0.53, the projected propagation of Covid-19 in the Eastern Cape is shown in
25 Figure 5. Given the high portion of accumulated infections by 7 March 2021, community
26 resistance would prevent the formation of a third wave in the first half of 2021 for all cases under
27 consideration. For the case where NPI is assumed to restrict transmission through to the end of
28 2021 (blue lines), a third wave of infections may not form in 2021, unless the duration of disease-
29 induced immunity is short (six months), in which case a third wave of infections may form in the
30 summer of 2021 (Figure 5d). If NPI is relaxed sooner, such a wave may form in the spring of
31 2021, even if the duration of immunity is twelve months (Figure 5b and c, red lines). In all these
32 cases, the third wave is likely to be smaller in amplitude than the first, due to the smaller pool of
33 susceptible people.
34
35 Does cross-reactive immunity protect against infection?
36
37 Under the assumptions of both wide-spread (30%, Methods) pre-existing cross-immunity
38 protecting against infection and disease-induced immunity being long lasting, second waves of
39 the observed amplitude in the Eastern and Western Cape can’t be replicated. However if it is
40 assumed that immunity (including pre-existing cross-reactive immunity) is lost in periods of twelve
41 or six months, or if a large faction of the immune population is not protected against the B.1.351
42 variant, sufficient pools of susceptible individuals become available for the model to replicate the
43 observed number of excess deaths and associated waves of infection. In this latter scenario the
44 effects of pre-existing cross-immunity diminishes over time and the disease dynamics approach
45 that of a fully susceptible population.
46
47
48
49
50
51
1 Discussion
 2
 3 Covid-19 propagation dynamics in South Africa are consistent with a fully susceptible population
 4 and IFR values of 0.31-0.53, below or at the lower limit of international estimates of the IFR
 5 (Meyerowitz-Katz and Merone, 2020). It is possible that the relatively young population age
 6 structure in South Africa may have contributed to a higher proportion of mild or asymptomatic
 7 cases (Promislow, 2020) and relatively low IFR. On the other hand, South Africa has a high
 8 prevalence of comorbidity factors, including obesity, hypertension, diabetes, as well as
 9 tuberculosis and HIV, which were expected to increase fatal vulnerability to Covid-19 (Boulle et
10 al., 2020; UNAIDS, 2020; TBFACTS, 2020; Rice et al., 2020). It is thus plausible that pre-existing
11 cross-protection against severe manifestation of Covid-19 disease, possibly obtained from
12 frequent exposure to common cold coronaviruses in South Africa’s low-income and high density
13 settlements, has played an important role in the manifestation of a low IFR in the country.
14
15 The modelling indicates that the first wave of infections plausibly left close to 30% of the
16 population infected across the three provinces. Even if disease-induced immunity lasts for many
17 years that left a sufficient pool of susceptible people for second waves of amplitude two to three
18 times that of the first to develop. Such waves indeed occurred in the Eastern and Western Cape
19 provinces, but in the Gauteng province the second wave had a similar amplitude to the first,
20 possibly because NPI was strengthened nationally in time to head off the late-developing wave.
21 Under assumptions of disease-induced immunity being lost within a year, or where immunity to
22 earlier strains of SARS-CoV-2 conferred only partial immunity to the B.1.351 variant, even larger
23 pools of susceptible people were available, from which the second wave of infections formed. In
24 the Western and Eastern Cape Provinces of South Africa, transmissibility is estimated to have
25 been be 20-100 % higher during the second wave of infections compared to the first, while in
26 Gauteng province, transmissibility was 136-175 % higher compared to the first wave. The
27 enhanced transmissibility overall in South Africa argues for higher transmissibility of the B.1.351
28 variant, and the differences between provinces may be due to differences in NPI compliance
29 (ahead of South Africa strengthening measures and more strongly enforced compliance late in
30 December 2020).
31
32 South African Covid-19 propagation dynamics are most easily and plausibly explained by not
33 assuming initial cross-immunity protecting against infection. The propagation dynamics provide
34 no evidence that cross-immunity providing complete protection against infection was widespread,
35 though cross-immunity may have provided some protection against infection by early Covid-19
36 variants. In particular, the magnitude of the second wave of infection in the Western and Eastern
37 Cape provinces can’t be replicated if wide-spread cross-immunity protecting against infection
38 existed for the B.1.351 variant and diseased-induced immunity is long-lasting and effective across
39 variants. On the other hand, if the duration of both pre-existing cross-reactive immunity and
40 disease-induced immunity is only six to twelve months, the formation of high amplitude second
41 waves of infection can be explained. In such a case, any effects of pre-existing cross-reactive
42 immunity (against infection) on the disease dynamics quickly diminishes. This finding is important
43 in the context of designing vaccination strategies in the country and more generally in low income
44 countries.
45
46 The duration of disease-induced immunity in relation to the strength of NPI are key factors (other
47 than the rate of vaccination and the evolution of further variants that are immune evasive)
48 controlling the likelihood of the development of third or fourth waves of Covid-19 in South Africa
49 in 2021. If immunity is effective across variants and lasts for many years, third waves are unlikely
50 to occur in the Western and Eastern Cape provinces, given that the fraction of the population
51 infected during the first two waves is close to the inferred herd immunity threshold. For immunity
1 lasting six to twelve months, the potential exists in the Gauteng Province for a third wave of
 2 infections larger in magnitude than the first two waves, peaking during late autumn or the winter
 3 of 2021, and for a fourth wave to occur in the summer of 2021. Strengthened NPI and/or
 4 widespread vaccinations will be needed to prevent or dampen such a resurgence. In the Western
 5 and Eastern Cape provinces, where larger fractions of the population were infected during the
 6 first two waves, third waves of infection are likely to be smaller in amplitude than the earlier waves,
 7 and are projected to peak later than in Gauteng.
 8
 9
10
11 References
12
13 Boulle A, Davies M-A, Hussey H, et al. Risk factors for COVID-19 death in a population cohort
14 study from the Western Cape Province, South Africa. Clin Infect Dis. 2020;
15 doi:10.1093/cid/ciaa1198.
16
17 Bradshaw D, Laubscher R, Dorrington R, Groenewald P, Moultrie T. Report on weekly deaths
18 in South Africa. 1 January - 13 October 2020 (Week 41). Burden of Disease Research Unit
19 South African Medical Research Council. 20 October 2020.
20 https://www.samrc.ac.za/reports/report-weekly-deaths-south-africa
21
22 Braun J, et al. SARS-CoV-2-reactive T cells in healthy donors and patients with COVID-19. Nature
23 2020; https://doi.org/10.1038/s41586-020-2598-9.
24
25 Britton T, Ball F, Trapman P. A mathematical model reveals the influence of population
26 heterogeneity on herd immunity to SARS-CoV-2. Science 2020; 369: 846–849.
27
28 Fontanet A and Cauchemez S. COVID-19 herd immunity: where are we? Nature Reviews
29 Immunology 2020; 20: 583-584. https://doi.org/10.1038/s41577-020-00451-5.
30
31 Garba SM, Lubuma JM and Tsanou B. Modeling the transmission dynamics of the covid-19
32 pandemic in South Africa. Mathematical Biosciences 2020; 108441.
33 https://doi.org/10.1016/j.mbs.2020.108441.
34
35 Greaney A.J., Loes A.N., Crawford K.H.D., Starr T.N., Malone K.D., Chu H.Y. and Bloom J.D.
36 Comprehensive mapping of mutations in the SARS-CoV-2 receptor-binding domain that affect
37 recognition by polyclonal human plasma antibodies. Cell Host and Microbe 2021; 29: 463-476.e6.
38 https://doi.org/10.1016/j.chom.2021.02.003.
39
40 Grifoni, A. et al. Targets of T cell responses to SARS-CoV-2 coronavirus in humans with COVID-
41 19 disease and unexposed individuals. Cell 2020; 181: 1489–1501.
42
43 Hsiao M., et al. Covid-19 Special Public Health Surveillance Bulletin 2020; 18 (5). National
44 Institute for Communicable Diseases.
45
46 Li R. et al. Substantial undocumented infection facilitates the rapid dissemination of novel
47 coronavirus (SARS-CoV-2). Science 2020; 368: 489–493.
48
49 Lindestam Arlehamna CS, Sette A and Peters B. Lack of evidence for BCG vaccine protection
50 from severe COVID-19. PNAS 2020; 117: 25203–25204.
51
1 Mbow M, Lell B, Jochems SP, Cisse B, Mboup S, Dewals BG, Jaye A, Dieye A and Yazdanbakhsh
 2 M. COVID-19 in Africa: Dampening the storm? Science 2020; 369: 624-626. DOI:
 3 10.1126/science.abd3902.
 4
 5 Meehan MT, et al. Modelling insights into the COVID-19 pandemic. Paediatric Respiratory
 6 Reviews 2020; 35: 64–69. https://doi.org/10.1016/j.prrv.2020.06.014.
 7
 8 Meyerowitz-Katz G. and Meronec L. A systematic review and meta-analysis of published research
 9 data on COVID-19 infection fatality rates. International Journal of Infectious Diseases 2020; 101
10 138–148.
11
12 Miller JC. A Note on the Derivation of Epidemic Final Sizes. Bull Math Biol 2012; 74: 2125–2141.
13 DOI 10.1007/s11538-012-9749-6.
14
15 Moyo-Gwete et al. SARS-CoV-2 501Y.V2 (B.1.351) elicits cross-reactive neutralizing antibodies.
16 bioRxiv preprint 2021; doi: https://doi.org/10.1101/2021.03.06.434193.
17
18 Nature (2020). Nature News in Focus. Q&A. South Africa’s top coronavirus adviser: ‘Our epidemic
19 could exceed a million cases’. Nature 2020; 583: 672. doi: https://doi.org/10.1038/d41586-020-
20 02216-5.
21
22 NICD (2020a). NICD Daily Report and Commentary, 08 October 2020. National Institute for
23 Communicable Diseases. https://www.nicd.ac.za/diseases-a-z-index/covid-19/surveillance-
24 reports.
25
26 NICD (2020b). NICD COVID-19 Surveillance in Selected Hospitals. 07 January 2021.
27 https://www.nicd.ac.za/wp-content/uploads/2021/01/Datcov19_National_Export.07Jan.pdf
28
29 O’Neill LAJ and Netea MG. BCG- induced trained immunity: can it offer protection against COVID-
30 19? Nature 2020; 20: 336-337.
31
32 Our World in Data (2021). South Africa: Coronavirus Pandemic Country Profile.
33 https://ourworldindata.org/coronavirus/country/south-africa.
34
35 Promislow DEL. A Geroscience Perspective on COVID-19 Mortality. J Gerontol A Biol Sci Med
36 Sci 2020; 75: e30–e33. doi:10.1093/gerona/glaa09.
37
38 Rice BL, et al. High variation expected in the pace and burden of SARS-CoV-2 outbreaks across
39 sub-Saharan Africa. Nature Medicine 2021; 27: 447–453. https://doi.org/10.1038/s41591-021-
40 01234-8.
41
42 ScienceMag (2020). A Kenyan health economist investigates the pandemic’s puzzling course in
43 his country. doi:10.1126/science.abg3420.
44
45 Sette A and Crotty S. Pre-existing immunity to SARS-CoV-2: the knowns and unknowns. Nature
46 Reviews Immunology 2020; 20: 457-458.
47
48 Stiegler N and Bouchard JP. South Africa: challenges and successes of the COVID-19
49 lockdown. Annales Médico-Psychologiques 2020; 178: 695–698.
50 https://doi.org/10.1016/j.amp.2020.05.006
51
1 TBFACTS (2020). https://tbfacts.org/tb-statistics-south-africa/.
 2
 3 Uoga et al. Seroprevalence of anti–SARS-CoV-2 IgG antibodies in Kenyan blood donors.
 4 Science 2021; 371: 79–82.
 5
 6 UNAIDS (2020). https://www.unaids.org/en/regionscountries/countries/southafrica.
 7
 8 Volz et al. Transmission of SARS-CoV-2 Lineage B.1.1.7 in England: Insights from linking
 9 epidemiological and genetic data. MedRxiv 2020.
10 doi: https://doi.org/10.1101/2020.12.30.20249034
11
12 Wassenaar TM, Buzard GS and Newman DJ. BCG vaccination early in life does not improve
13 COVID-19 outcome of elderly populations, based on nationally reported data. Letters in Applied
14 Microbiology 2020; doi:10.1111/lam.13365.
15
16 Wibmer, C.K., Ayres, F., Hermanus, T. et al. (2021). SARS-CoV-2 501Y.V2 escapes
17 neutralization by South African COVID-19 donor plasma. Nat Med.
18 https://doi.org/10.1038/s41591-021-01285-x
19
20
21
22
23
24
25
26
27
28
29
30
31
32
33
34
35
36
37
38
39
40
41
42
43
44
45
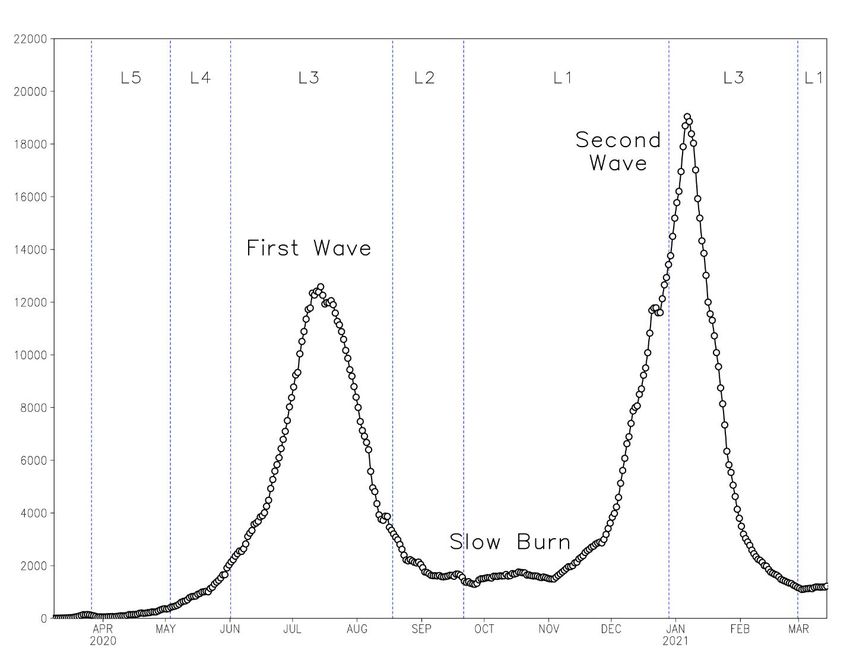
1
 2 Figure 1: Propagation of Covid-19 in South Africa between 8 March 2020 and 14 March 2021,
 3 as described by the seven day centered moving average of daily reported cases. These numbers
 4 are substantially lower than actual cases due to limited testing. The ‘levels’ refer to NPI states,
 5 with 5 being the strictest.
 6
 7
 8
 9
10
11
12
13
14
15
16
17
18
19
20
21
22
23
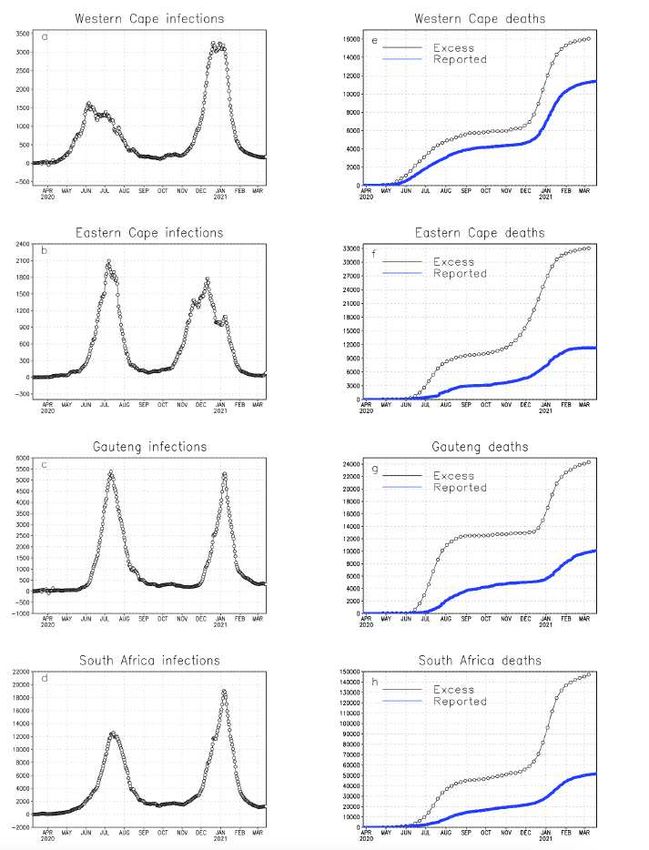
1
2 Figure 2: Left panels: Seven-day centered moving averages of daily reported Covid-19
3 infections for (a) Western Cape, (b) Eastern Cape, (c) Gauteng and (d) South Africa between 8
4 March 2020 and 14 March 2021. Right panels: Same as for the left panels, but showing
5 accumulated excess (weekly, black lines) and reported (daily, blue lines) Covid-19 deaths
6 through to 7 March and 19 March 2021, respectively.
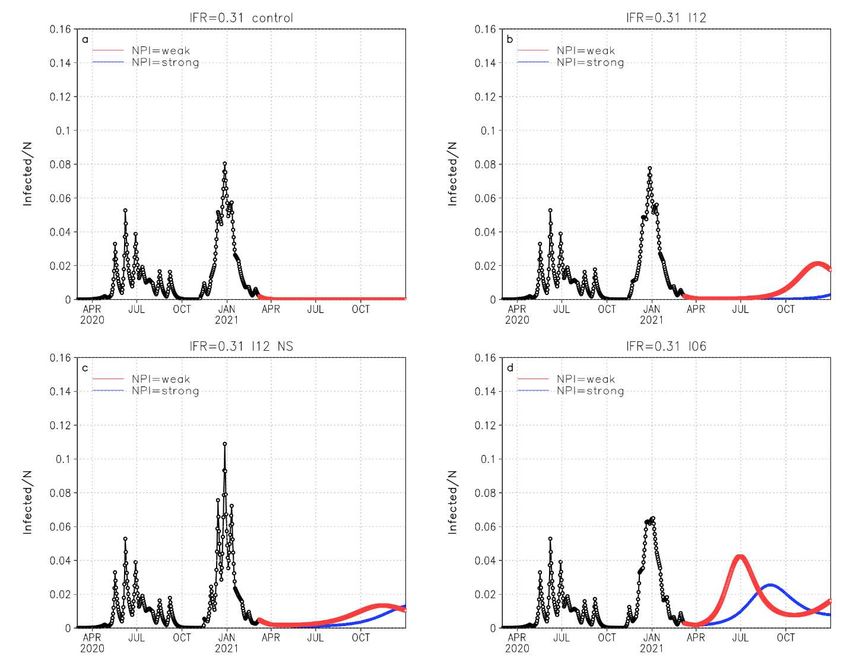
1

 2
 3
 4 Figure 3: The reconstructed Covid-19 infections in the Gauteng province of South Africa for the
 5 period through to 7 March 2021 (black lines), and projected infections until the end of 2021 (blue
 6 and red lines), for an IFR of 0.31. Panel a represents the case where disease-induced immunity
 7 is ever lasting. Panel b represents immunity lasting for 12 months. Panel c represents the case
 8 where immunity lasts for 12 months, but where the arrival of the new B.1.351 variant in late
 9 November 2020 was associated with 50% of the immune population at the time becoming
10 susceptible to the new variant. Panel d is similar to panel b, but with immunity lost after six months.
11 For the projections it is assumed that NPI will restrict R0’ to 1.4 through to 1 April 2021. The red
12 lines represent a worst case scenario where R0’ assumes the value as reconstructed for the
13 second wave (Supplementary Table 3.1) from 2 April 2021 onwards. The blue lines represent a
14 best-case scenario where NPI restricts R0’ to 1.6 from 2 April onwards.
15
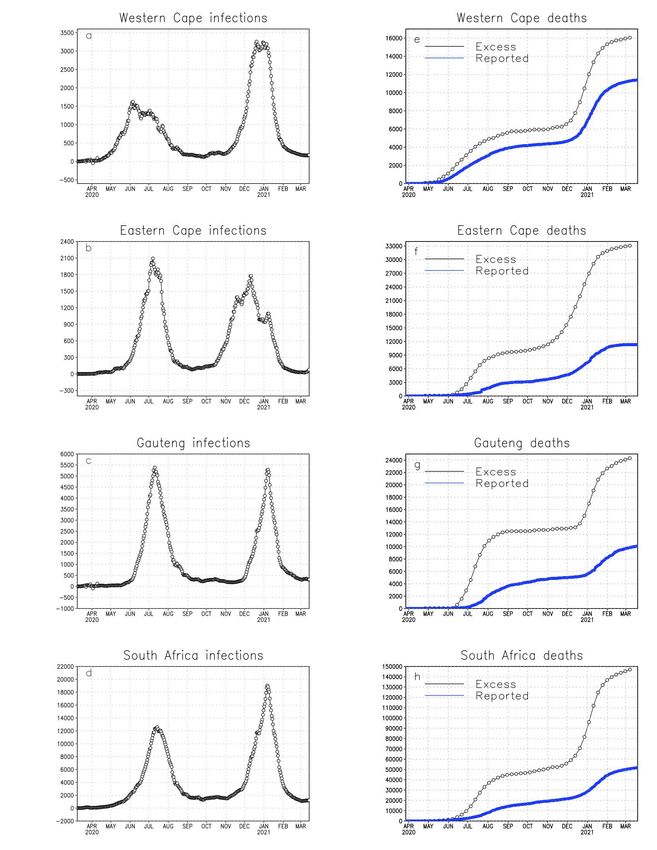
1
 2
 3 Figure 4: The reconstructed Covid-19 infections in the Western Cape province of South Africa for
 4 the period through to 7 March 2021 (black lines), and projected infections until the end of 2021
 5 (blue and red lines), for an IFR of 0.31. Panel a represents the case where disease-induced
 6 immunity is ever lasting. Panel b represents immunity lasting for 12 months. Panel c represents
 7 the case where immunity lasts for 12 months, but where the arrival of the new B.1.351 variant in
 8 early November 2020 was associated with 50% of the immune population at the time becoming
 9 susceptible to the new variant. Panel d is similar to panel b, but with immunity lost after six months.
10 For the projections it is assumed that NPI will restrict R0’ to 1.4 through to 1 April 2021. The red
11 lines represent a worst case scenario where R0’ assumes the value as reconstructed for the
12 second wave (Supplementary Table 3.1) from 2 April 2021 onwards. The blue lines represent a
13 best-case scenario where NPI restricts R0’ to 1.6 from 2 April onwards.
14
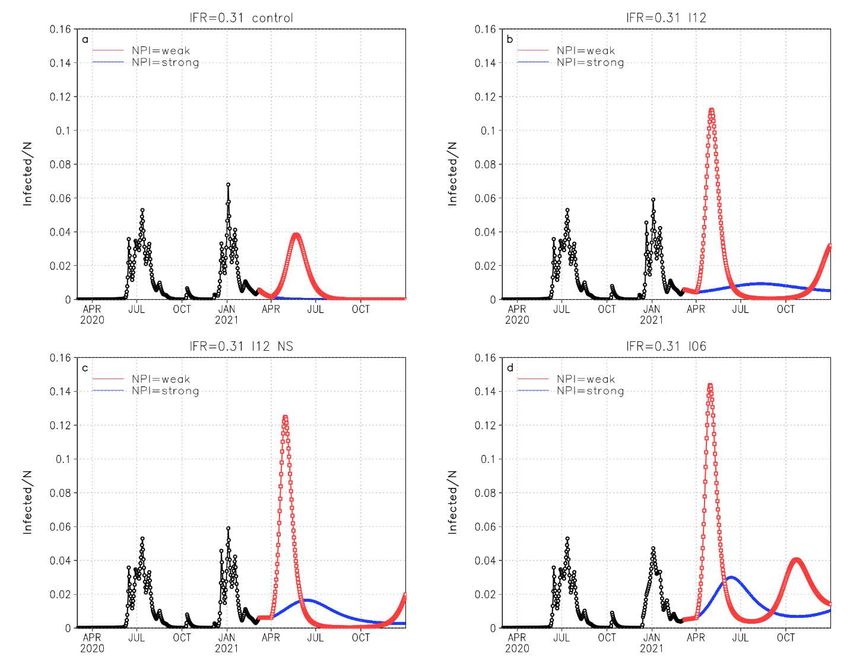
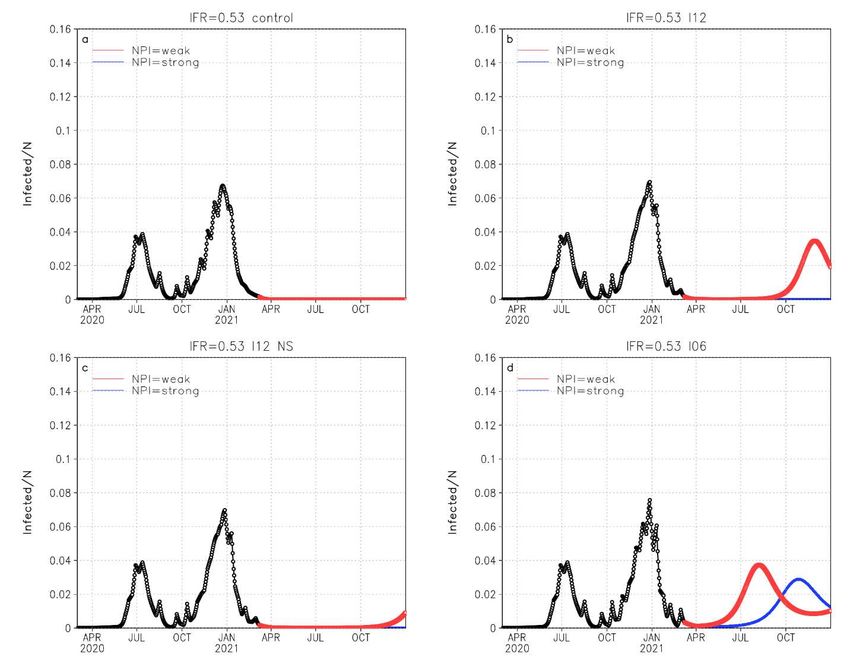
1
 2
 3
 4
 5 Figure 5: The reconstructed Covid-19 infections in the Eastern Cape province of South Africa for
 6 the period through to 7 March 2021 (black lines), and projected infections until the end of 2021
 7 (blue and red lines), for an IFR of 0.53. Panel a represents the case where disease-induced
 8 immunity is ever lasting. Panel b represents immunity lasting for 12 months. Panel c represents
 9 the case where immunity lasts for 12 months, but where the arrival of the new B.1.351 variant in
10 early October 2020 was associated with 50% of the immune population at the time becoming
11 susceptible to the new variant. Panel d is similar to panel b, but with immunity lost after six months.
12 For the projections it is assumed that NPI will restrict R0’ to 1.4 through to 1 April 2021. The red
13 lines represent a worst case scenario where R0’ assumes the value as reconstructed for the
14 second wave (Supplementary Table 3.1) from 2 April 2021 onwards. The blue lines represent a
15 best-case scenario where NPI restricts R0’ to 1.6 from 2 April onwards.
16
17
18
19
20
21
22
23
1 Methods
 2
 3 Limitations in testing for COVID-19, with approximately 80 tests per 1000 population having been
 4 undertaken in South Africa by Oct 2020 (Our world in data), inadvertently results in the reported
 5 numbers of COVID-19 being an underestimate of the actual number of infections, as is the case
 6 in most other countries (Li et al., 2020). The paper therefore makes use of this measure only as
 7 a qualitative measure of the progression of the disease in South Africa and its provinces, but it is
 8 not used quantitatively in the inverse modelling that is performed. Deaths directly attributable to
 9 Covid-19 (UP, 2020) are also an underestimate of the actual number, due to the limited availability
10 of polymerase chain reaction (PCR) confirmations. However, deaths from whatever cause must
11 be reported to the authorities, and the reporting rate to the vital registration system is high: victims
12 need to be buried and death benefits are to be claimed. The study thus relies on estimated weekly
13 ‘excess deaths’, of which Covid-19 attributable deaths make up the major component in South
14 Africa (Bradshaw et al., 2020), as the key measure of disease propagation dynamics. Data on
15 weekly excess deaths were available through to the week ending 7 March 2021 at the time of
16 composing this paper. The fraction of reported Covid-19 deaths to excess deaths in South Africa
17 is highly variable between provinces, from 34% in the Eastern Cape, 41% in Gauteng to 70% in
18 the Western Cape by 7 March 2021. Reported cases, reported deaths and excess deaths are
19 displayed in Figure 2 for the Western and Eastern Cape and Gauteng provinces, and for South
20 Africa, for the period March 2020 to March 2021.
21
22 The study relies on serological surveys undertaken in the Western Cape (Hsiao et al., 2020) and
23 Gauteng (Portia Mutevedzi - MRC, personal communication), which suggested that by the end of
24 the first wave in August 2020, about 35-45% of people in the communities surveyed in the
25 Western Cape had been infected, and about 25% in Gauteng. These numbers are used to verify
26 the model simulations in terms of their ability to represent the fraction of the various populations
27 infected by the end of the first wave.
28
29 We applied a Susceptible-Infected-Recovered-Dead (SIRD) model separately to the Eastern
30 Cape, Western Cape and Gauteng provinces of South Africa:
31

32

 = − + ;

33

34 = − − ; (1)

35

36 = − ;

37

38 = .

39
40 Each province is assumed to have an isolated, homogeneous and initially fully susceptible
41 population of size N (6.7 million for the Eastern Cape, 7 million for the Western Cape and 15.5
42 million for Gauteng). S, I, R and D are the number of susceptible, infected, recovered and dead
43 individuals respectively, at a given moment in time, and they sum to the total population, N
44 (assumed to remain constant). The daily recovery rate = 0.16 −1 is constant in all the
45 simulations performed and consistent with estimates used in other studies (Anastassopoulou et
1 al., 2020; Baker et al., 2020). The daily infection rate is α and the mortality rate is γ. Note that the
 2 = ⁄ and 0 = ⁄( + ). The rate at which immunity is lost is ω.
 3 The model is initialized with =0 = (1 − ) − =0 and =0 = , where cr is the fraction of the
 4 population with pre-existing cross-immunity against infection. =0 = 1 and =0 = 0. Given the
 5 substantial variations in the strength of NPI during the simulation period we do not attempt to
 6 identify the potential impacts of seasonality on infection rates (Baker et al., 2020; Engelbrecht and
 7 Scholes, 2021; Smit et al., 2020). The model also assumes that the IFR remains constant across
 8 the duration of the disease’s propagation, an assumption that may not be valid given the
 9 emergence of the B.1.351 variant in November 2020.
10
11 The inverse application of the model reconstructs the modified reproduction number 0 ′ =
12 ⁄( + ) (with αm the actual time-varying infection rate) for each value of cr and the IFR, and
13 for the prescribed period that disease-induced immunity lasts, from the time-series of excess
14 deaths. The model inversion distinguishes between the period up and until 29 April 2020 (from
15 the onset of Covid-19 in South Africa to the end of stringent lockdown, Supplementary Table 1)
16 and the subsequent period during which lockdown measures were progressively relaxed, albeit
17 with ongoing advocacy for use of NPIs, and for which data on excess deaths are available. The
18 model was initialized on the 5th of March 2020 and integrated forward to 29 April 2020, the end of
19 stringent lockdown. Model inversion solutions were obtained by systematically integrating the
20 model for different values of R0’, in intervals of 0.0001, and selecting the smallest value of R0’ that
21 yields accumulated deaths equal to or greater than the recorded excess deaths at the end of this
22 period. This process was then repeated for the period 6 May 2020 to 7 March 2021, with R0’
23 reconstructed to match the weekly recorded excess deaths, always initializing from the latest state
24 obtained for S, I, R and D.
25
26 Four scenarios of the duration of disease-induced immunity are explored in the simulations:
27 immunity that lasts indefinitely, for twelve months, for six months, and immunity that generally
28 lasts for twelve months but where 50% of the population in whom immunity was induced by
29 prototype SARS-CoV-2 remained susceptible to the B.1.351 variant. Based on the dates for which
30 the weekly numbers of excess deaths started to increase after the period of ‘slow burn’ that
31 followed the first wave (Figure 1), the emergence date of the new B.1.351 variant was taken to
32 be 7 October 2021 in the Eastern Cape, 8 November 2021 in the Western Cape and 30 November
33 2021in Gauteng. For each of these four cases, a set of time-series of the modified reproduction
34 number (R0’, representing the time-varying effects of NPI on R0) was reconstructed as a function
35 of the IFR. In other words, the IFR is kept constant in each simulation, but different realisations of
36 the IFR in its plausible range are explored. A recent review suggested 0.53% to 0.82% as the
37 plausible range of the IFR (Meyerowitz-Katz and Merone, 2020), although other studies suggest
38 values as low as 0.3 and as high as 1.2 (Fontanet and Cauchemez, 2020). Note that the effective
39 reproduction number is related to R0’ by , = 0 ′⁄ . Values of R0’ are averaged over the six-
40 week period preceding the peak of the first wave, and the six week period preceding the peak of
41 the second wave, for each of the provinces (Supplementary Tabled 3.1 to 3.3). To these values
42 are referred to as the ‘first wave’ and ‘second wave’ values of R0’. Accumulated infections, which
43 may include reinfections, are tabled for the dates 30 August (post first-wave) and 7 March (post
44 second-wave) for each of the provinces, in Supplementary Tables 2.1 to 2.3.
45
46 After 7 March 2021, the model is released from its ‘spun-up’ state to project forward to December
47 2021. It is assumed that continued adherence to NPI recommendations will restrict R0’ to 1.4 until
48 1 April 2021. A worst case and best case scenario are considered for the period 2 April 2021
49 onwards. For each of the cases of reinfection, the worst case scenario assumes a value of R0’ as
1 estimated from the second wave of infections (Supplementary Tables 3.1 to 3.3), whilst the best
 2 case scenario assumes a value of 1.6.
 3
 4 Note that in order to explore the potential effects of pre-existing cross-reactive immunity that
 5 protects against SARS-CoV-2 infection, the simulations described above are performed for either
 6 a fully susceptible population ( = 0) or with a fraction of the population ( = 0.3) having pre-
 7 existing immunity protecting against infection.
 8
 9 The simulations do not take into account any pharmaceutical control measures (ie vaccination)
10 that may become increasingly available in South Africa after April 2021. They thus effectively
11 provide guidance on how the disease may evolve in South Africa in the absence of an efficient
12 roll-out of Covid-19 immunization.
13
14 References
15
16 Anastassopoulou C, Russo L, Tsakris A and Siettos C. Data-based analysis, modelling and
17 forecasting of the COVID-19 outbreak. PlosOne 2020; 1010.
18 DOI:10.1371/journal.pone.0230405.
19 Baker RE, Yang W, Vecchi GA, Metcalf CJE and Grenfell BT. Susceptible supply limits the role
20 of climate in the early SARS-CoV-2 pandemic. Science 2020; DOI: 10.1126/science.abc2535.
21
22 Bradshaw D, Laubscher R, Dorrington R, Groenewald P, Moultrie T. Report on weekly deaths
23 in South Africa. 1 January - 13 October 2020 (Week 41). Burden of Disease Research Unit
24 South African Medical Research Council. 20 October 2020.
25 https://www.samrc.ac.za/reports/report-weekly-deaths-south-africa
26
27 Engelbrecht F.A. and Scholes R. J. (2021). Test for Covid-19 seasonality and the risk of second
28 waves. One Health 12 100202.
29
30 Fontanet A and Cauchemez S. COVID-19 herd immunity: where are we? Nature Reviews
31 Immunology 2020; 20: 583-584. https://doi.org/10.1038/s41577-020-00451-5.
32
33 Hsiao M., et al. Covid-19 Special Public Health Surveillance Bulletin 2020; 18 (5). National
34 Institute for Communicable Diseases.
35
36 Li R. et al. Substantial undocumented infection facilitates the rapid dissemination of novel
37 coronavirus (SARS-CoV-2). Science 2020; 368: 489–493.
38
39 Meyerowitz-Katz G. and Meronec L. A systematic review and meta-analysis of published research
40 data on COVID-19 infection fatality rates. International Journal of Infectious Diseases 2020; 101
41 138–148.
42
43 Our World in Data (2021). South Africa: Coronavirus Pandemic Country Profile.
44 https://ourworldindata.org/coronavirus/country/south-africa.
45
46 Smit AJ, Fitchett JM, Engelbrecht FA, Scholes RJ, Dzhivhuho G and Sweijd NA. Winter is
47 Coming: A southern Hemisphere Perspective of the Environmental Drivers of SARS-CoV-2 and
48 the Potential Seasonality of COVID-19. Int. J. Environ. Res. Public Health 2020; 17: 5634.
49 doi:10.3390/ijerph17165634.
50
1 UP (2020). COVID 19 ZA South Africa Dashboard. Data Science for Social Impact Research
 2 Group, University of Pretoria. https://datastudio.google.com/reporting/1b60bdc7-bec7-44c9-
 3 ba29-be0e043d8534/page/hrUIB.
 4
 5
 6
 7
 8
 9
10
11
12
13
14
15
16
17
18
19
20
21
22
23
24
25
26
27
28
29
30
31
32
33
34
35
36
37
38
39
40
41
42
43
44
45
46
47
48
49
50
51
1 Supplementary Information
 2
 3 Supplementary Table 1: The non-pharmaceutical interventions aimed at reducing the peak of
 4 Covid-19 infections and deaths in South Africa were implemented in discrete stages. The degree
 5 to which the population conformed with the restrictions – particularly those related to mask-
 6 wearing and social distancing – was highly variable, but generally very far below complete,
 7 especially after about June 2020.
 From To Regulations
 5 25 Mar Cessation of international travel other than repatriation missions.
 Mar 2020
 2020
 26 3 May Level 5 lockdown. Shelter-in-place for entire population, without visitors,
 Mar 2020 leaving only to buy food or for medical treatment. Only essential workers
 2020 at work (police, military, utilities, food provision, health workers). Alcohol
 and tobacco ban, all drinking and eating establishments closed, no
 public transport, international borders closed, travel between provinces
 by permit only.
 4 31 May Level 4. About 1/3rd of employed return to work (all agriculture, financial
 May 2020 services, IT services; 50% of mining) with hygiene and distancing
 2020 protocols. Open-air exercise permitted within 5 km of home, no gyms.
 Masks compulsory in public.
 1 17 Aug Level 3. Partial school re-opening (mostly final year grades, learners
 June 2020 returning alternate days, most learning online, no school sports). E-
 2020 commerce permitted, clothing stores open, take-away foods permitted,
 government service offices open. Automobile, cement, steel industries,
 road maintenance, railways open. Public transport open all hours, with
 distancing.
 18 20 Sep Level 2. All retail stores open, including hairdressers. Family visits
 Aug 2020 allowed, limit of 50 people for gatherings (including funerals and
 2020 religious), parks open, curfew 10 pm to 4 am, drinking and eating
 establishments open with spacing restrictions. Interprovincial travel for
 any purpose permitted.
 21 28 Dec Level 1. All sectors open, with distancing and hygiene protocols. No
 Sep 2020 sports events with spectators, conferences remain virtual, indoor
 2020 gatherings limited to 250 people. International travel from approved
 destinations permitted. Almost all higher education facilities continue
 predominantly teaching online, with limited physical presence.
 29 28 Level 3.
 Dec February
 2020 2021
 1 Ongoing Level 1.
 Mar by 3 April
 2021 2021
 8
 9
10
11
12
13
1 Supplementary Table 2.1: Accumulated infections in a fully susceptible population (expressed
 2 as a percentage of the total population N) reconstructed by model inversion of excess mortality in
 3 the Gauteng province for the period post the first wave and post the second wave, as a function
 4 of the IFR, the duration of disease-induced immunity (L) and fraction of the population infected
 5 during the first wave that retained that immunity against the B.1.351 variant (N %).
 6
 IFR L N Accumulated infections expressed as a percentage of
 (months) (%) the total population N
 Post first wave (30 Post second wave (7
 August 2020) March 2021)
 0.2 ∞ 100 41 79
 0.2 12 100 41 80
 0.2 12 50 41 80
 0.2 6 100 41 79
 0.31 ∞ 100 26 51
 0.31 12 100 26 51
 0.31 12 50 26 51
 0.31 6 100 26 51
 0.53 ∞ 100 15 30
 0.53 12 100 15 30
 0.53 12 50 15 30
 0.53 6 100 15 30
 0.68 ∞ 100 12 23
 0.68 12 100 12 23
 0.68 12 50 12 24
 0.68 6 100 12 23
 0.82 ∞ 100 10 20
 0.82 12 100 10 20
 0.82 12 50 10 20
 0.82 6 100 10 20
 7
 8
 9
10
11
12
13
14
15
16
17
18
19
20
21
22
23
24
25
26
1 Supplementary Table 2.2: Accumulated infections in a fully susceptible population (expressed
 2 as a percentage of the total population N) reconstructed by model inversion of excess mortality in
 3 the Western Cape province for the period post the first wave and post the second wave, as a
 4 function of the IFR, the duration of disease-induced immunity (L) and fraction of the population
 5 infected during the first wave that retained that immunity against the B.1.351 variant (N %).
 6
 IFR L N Accumulated infections expressed as a percentage of
 (months) (%) the total population N
 Post first wave (30 Post second wave (7
 August 2020) March 2021)
 0.2 ∞ 100 41 98
 0.2 12 100 41 115
 0.2 12 50 41 115
 0.2 6 100 41 115
 0.31 ∞ 100 26 74
 0.31 12 100 26 74
 0.31 12 50 26 75
 0.31 6 100 26 75
 0.53 ∞ 100 16 44
 0.53 12 100 16 44
 0.53 12 50 16 44
 0.53 6 100 16 44
 0.68 ∞ 100 12 34
 0.68 12 100 12 34
 0.68 12 50 12 34
 0.68 6 100 12 34
 0.82 ∞ 100 10 28
 0.82 12 100 10 28
 0.82 12 50 10 28
 0.82 6 100 10 28
 7
 8
 9
10
11
12
13
14
15
16
17
18
19
20
21
22
23
24
25
1 Supplementary Table 2.3: Accumulated infections in a fully susceptible population (expressed
 2 as a percentage of the total population N) reconstructed by model inversion of excess mortality in
 3 the Eastern Cape province for the period post the first wave and post the second wave, as a
 4 function of the IFR, the duration of disease-induced immunity (L) and fraction of the population
 5 infected during the first wave that retained that immunity against the B.1.351 variant (N %).
 6
 IFR L N Accumulated infections expressed as a percentage of
 (months) (%) the total population N
 Post first wave (30 Post second wave (7
 August 2020) March 2021)
 0.2 ∞ 100 73 96
 0.2 12 100 73 140
 0.2 12 50 73 161
 0.2 6 100 73 182
 0.31 ∞ 100 47 98
 0.31 12 100 47 127
 0.31 12 50 47 142
 0.31 6 100 47 162
 0.53 ∞ 100 28 93
 0.53 12 100 28 94
 0.53 12 50 28 94
 0.53 6 100 28 94
 0.68 ∞ 100 22 73
 0.68 12 100 22 73
 0.68 12 50 22 73
 0.68 6 100 22 73
 0.82 ∞ 100 18 61
 0.82 12 100 18 61
 0.82 12 50 18 61
 0.82 6 100 18 61
 7
 8
 9
10
11
12
13
14
15
16
17
18
19
20
21
22
23
24
25
1 Supplementary Table 3.1: R0’ reconstructed by model inversion of excess mortality in the
 2 Gauteng province for the first and second waves assuming a fully susceptible population, and as
 3 a function of the IFR, the duration of disease-induced immunity (L) and fraction of the population
 4 infected during the first wave that retained that immunity against the B.1.351 variant (N).
 5
 IFR L N Averages of R0’ as estimated from the inversion of weekly
 (%) deaths
 First Wave peak (15 Jun to Second wave peak (30
 26 July) November to 10 January)
 0.31 ∞ 100 1.2 3.3
 0.31 12 100 1.1 2.9
 0.31 12 50 1.1 2.6
 0.31 06 100 1.1 2.8
 0.53 ∞ 100 1.1 2.6
 0.53 12 100 1.1 2.6
 0.53 12 50 1.1 2.5
 0.53 06 100 1.1 2.3
 6
 7
 8 Supplementary Table 3.2: R0’ reconstructed by model inversion of excess mortality in the
 9 Western Cape province for the first and second waves assuming a fully susceptible population,
10 and as a function of the IFR, the duration of disease-induced immunity (L) and fraction of the
11 population infected during the first wave that retained that immunity against the B.1.351 variant
12 (N).
13
 IFR L N Averages of R0’ as estimated from the inversion of weekly
 (%) deaths
 First Wave peak (25 May to Second wave peak (23
 5 July) November to 3 January)
 0.31 ∞ 100 1.2 2.4
 0.31 12 100 1.1 1.8
 0.31 12 50 1.1 1.7
 0.31 06 100 1.1 1.9
 0.53 ∞ 100 1.1 1.8
 0.53 12 100 1.1 1.5
 0.53 12 50 1.1 1.5
 0.53 06 100 1.1 1.6
14
15
16
17
18
19
20
21
22
23
24
25
26
1
2 Supplementary Table 3.3: R0’ reconstructed by model inversion of excess mortality in the
3 Eastern Cape province for the first and second waves assuming a fully susceptible population,
4 and as a function of the IFR, the duration of disease-induced immunity (L) and fraction of the
5 population infected during the first wave that retained that immunity against the B.1.351 variant
6 (N).
7
 IFR L N Averages of R0’ as estimated from the inversion of weekly
 (%) deaths
 First Wave peak (1 June to Second wave peak (16
 12 July) November to 27 December)
 0.53 ∞ 100 1.5 2.8
 0.53 12 100 1.5 2.2
 0.53 12 50 1.5 1.8
 0.53 06 100 1.5 1.9
 0.68 ∞ 100 1.5 2.0
 0.68 12 100 1.5 1.8
 0.68 12 50 1.5 1.6
 0.68 06 100 1.5 1.6
8
You can also read