COUNTRY REPORT ON SOUTH AFRICAN UNIVERSITY EDUCATION 2019 - BY MWAZVITA TB DALU
←
→
Page content transcription
If your browser does not render page correctly, please read the page content below
COUNTRY REPORT ON SOUTH AFRICAN
   UNIVERSITY EDUCATION – 2019

               BY
         MWAZVITA TB DALU

             http://ideaspartnership.org/
                   @ESRC_IDEAS
                     #ESRCIDEAS

                                            i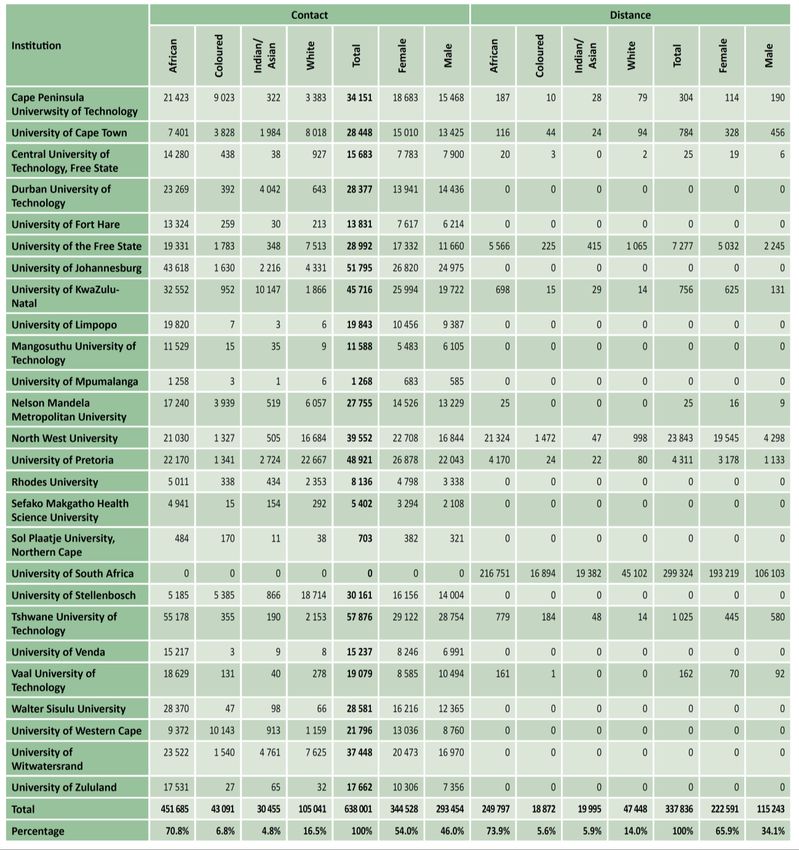
FOREWARD

This country report of the International Distance Education and African Students (IDEAS)
project provides an overview of South African university education. It also elaborates on the
historical background and current state of the university education system, and the extent to
which it provides equitable and quality education.

Amidst the many challenges that South African Higher Education faces, it must still be
acknowledged that South Africa is the leading higher education provider on the continent. The
country has come a long way in addressing the challenges of access and inclusion that are
consequence of its history. Currently, enrolment of previously excluded black students is at an
all-time high, along with female enrolments into higher education. South is also a regional leader
in providing international education, both distance and contact

This chapter, Country Report on South African University Education – 2019, is intended to
advance better understanding of South Africa’s university system, and reasons why South
Africans opt for IDE with universities in other countries or why student migration matters.

……………………………………………………                                       ……………………………………..
Professor Parvati Raghuram (Principal Investigator)     Professor Ashley Gunter (Principal
The Open University, UK                               Investigator) University Africa, RSA

                                                                                                 ii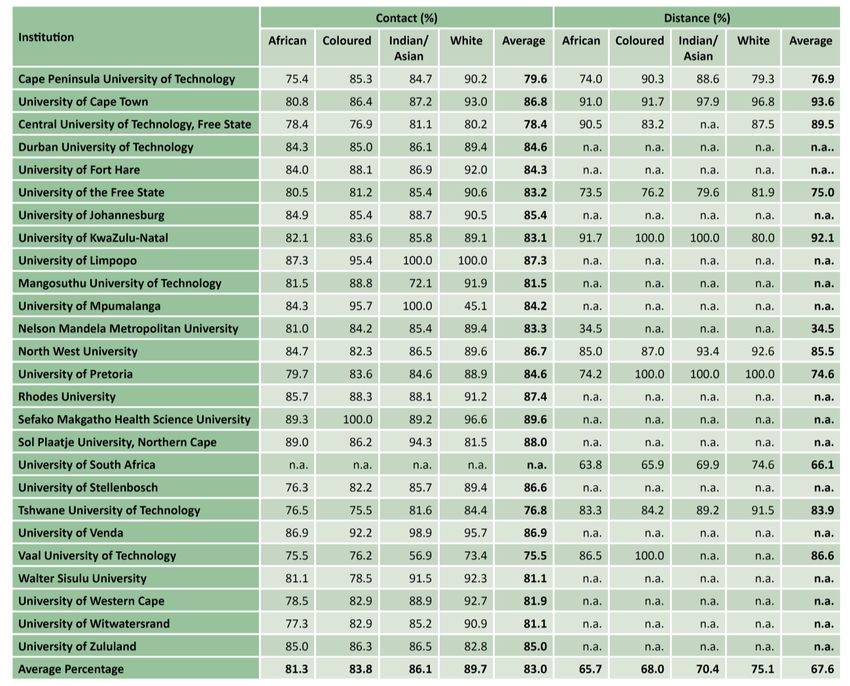
TABLE OF CONTENTS

FOREWARD ............................................................................................................................................... ii
TABLE OF CONTENTS .......................................................................................................................... iii
   LIST OF FIGURES ............................................................................................................................... iv
   LIST OF TABLES .................................................................................................................................. v
   LIST OF ACRONYMS ......................................................................................................................... vi
1. Introduction ............................................................................................................................................. 1
3. The structural organisation of South African higher education ........................................................ 4
4. Funding of South African higher education ......................................................................................... 5
5. South African higher education enrolments ....................................................................................... 10
6. Quality of university education............................................................................................................ 16
       6.1 Framework levels ........................................................................................................................ 17
   6.2 Factors affecting the quality of university education ..................................................................... 19
7. Proposed strategies for expanding access to and improving the quality of university education . 22
References .................................................................................................................................................. 25

                                                                                                                                                             iii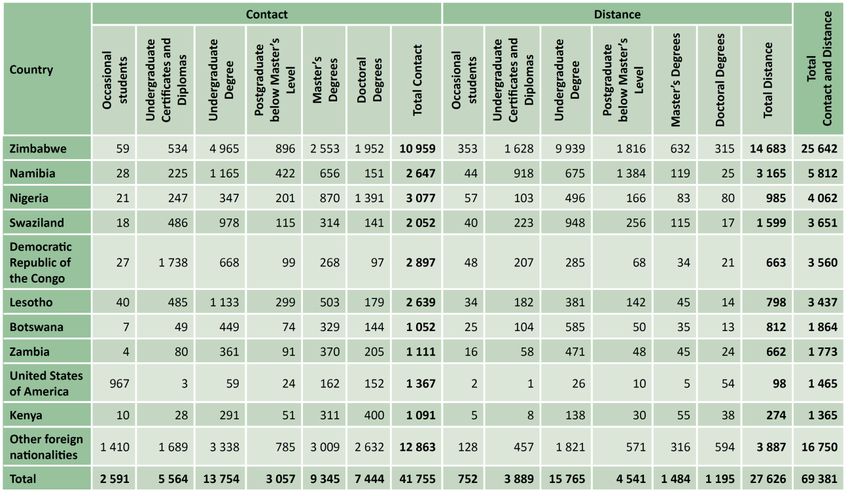
LIST OF FIGURES

Figure 1:Geographical location of South Africa (Wikipedia.org) ................................................. 3
Figure 2:Total student enrolment in public and private HEI’s in South Africa between 2010-
2016 (DHET, 2017) ...................................................................................................................... 13
Figure 3: Total number of students enrolled in public Higher Education Institutions (HEI’s) by
mode between 2009-2016 (DHET, 2017) ..................................................................................... 13
Figure 4: Proportion of students in either contact or distance education by gender in 2016
(DHET, 2017) ............................................................................................................................... 14
Figure 5: Structure of the NQF levels (SAQA, 2018b) ............................................................... 18

                                                                                                                                            iv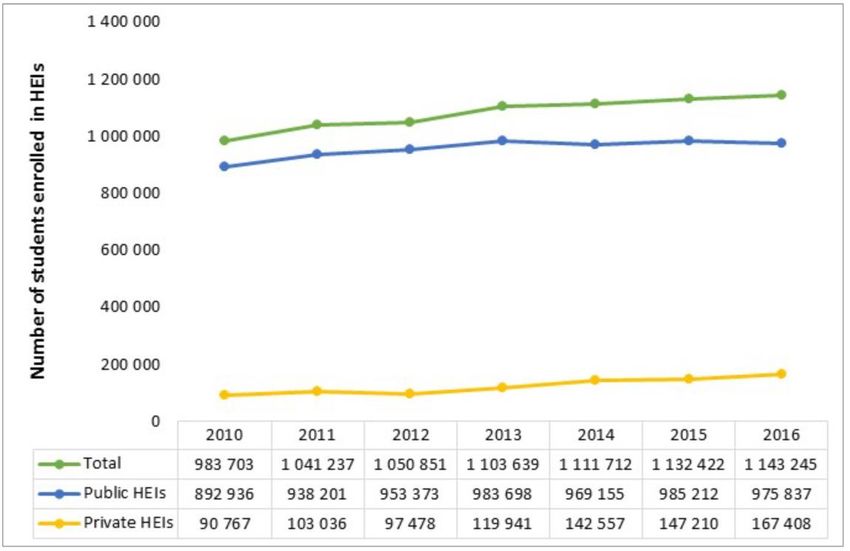
LIST OF TABLES

Table 1: Funding allocated to public universities in South Africa by institution for 2016/17
(DHET, 2017) ................................................................................................................................. 6
Table 2: International and national ranking of South African universities .................................... 9
Table 3: Total number of students enrolled in public universities by attendance mode, population
group, gender and institution in 2016 (DHET, 2017) ................................................................... 11
Table 4: Number of foreign students enrolled in public universities by country, attendance mode
and qualification type in 2016 (DHET, 2017................................................................................ 15
Table 5: Undergraduate success rates of students in public universities by attendance mode,
population group and institution in 2016 (DHET, 2017 ............................................................... 16

                                                                                                                                              v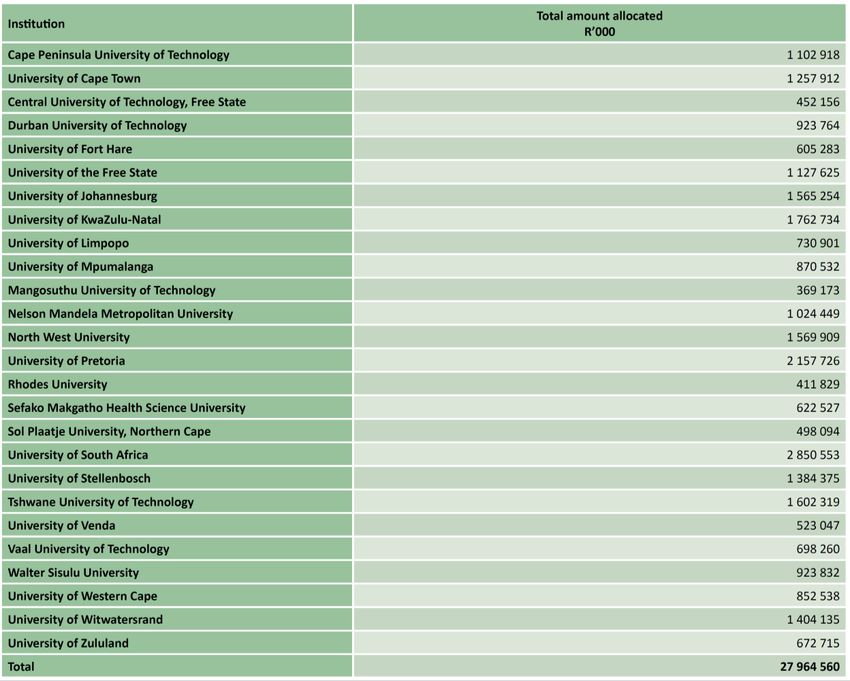
LIST OF ACRONYMS

SADC          Southern African Development Community

GDP           Gross Domestic Product

ANC           African National Congress

UNISA         University of South Africa

DHET          Department of (now Higher) Education (and

              Training)

CHE           Council on Higher Education

NSFAS         National Student Financial Aid Scheme

HEI’s         Higher Education Institutions

NQF           National Qualifications Framework

SAQA          South African Qualifications Authority

                                                          vi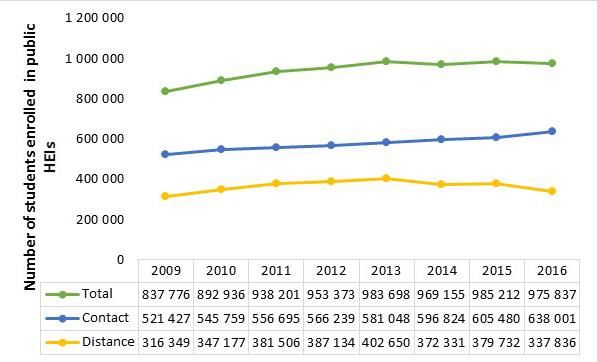
1. Introduction

South Africa is a Southern African country. It shares its borders with Zimbabwe to the North,

Mozambique to the East, Botswana and Namibia to the North West and Lesotho and Swaziland

(Figure 1). Its area is 1,219,912 km2, with a coastline that extends for 2,500 km on the Atlantic

and Indian oceans (Unknown, 2018). Most of South Africa’s coastal areas have a temperate

climate, whilst the interior is mostly sub-tropic, though the North-West part of the country is

very dry (ibid.). The administrative capital city of the country is Pretoria, its legislative capital is

Cape Town, and its judicial capital is Bloemfontein. Its largest city is Johannesburg, where most

of the financial corporations and Multi-national companies have their regional headquarters. The

country recognises eleven official languages, although most business is conducted in English,

and to a lesser degree, in Afrikaans. South Africa is part of the Southern African Development

Community (SADC) (STATSA, 2018).

In 2018, South Africa’s population is estimated to have increased to 57.73 million, having

increased by 1.55 % from 2017 (ibid.). The majority of the population resides in Gauteng (14.7

million or 25.4 %). The Northern Cape has the smallest share of the population, with only 2.1 %

of the total population (World Bank, 2018). The country has a stable proportion of female

population, at 51 % (29.5 million). Life expectancy for males is estimated at 61.1 years, and

females 67.3 years (STATSA, 2018). The proportion of the population which is 60 years or older

is 8.5 %, whilst those aged 15 years or younger constitute 29.5 % of the total population (ibid.).

HIV prevalence rate is approximately 13.1 % in 2018, having increased from 12.9 % in 2017,

with an estimated 7.52 million people estimated to be living with HIV in 2018. Nineteen percent

of adults aged between 15-49 years are estimated to be HIV positive (STATSA, 2018). South

Africa receives a large inflow of migrants in the country, most of which are from Zimbabwe, and

                                                                                                      1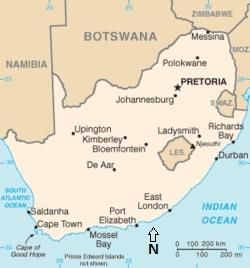
then Nigeria and the DRC, as well as Ethiopia. Between 2016-2021, Gauteng received 1,048,440

immigrants, and the Western Cape 311,004 immigrants (STATSA, 2018). Unemployment rate in

the second quarter of 2018 was estimated to be 27.2 % (OECD, 2018). According to the World

Bank, South Africa’s gross domestic product (GDP) was estimated at US$ 349.42 billion in

2017. In 2012, manufacturing contributed 17 % to the economy, and finance, real estate and

business services contributed 24 %. The biggest contributor to the country’s GDP, however,

remains industry at 36 % as at 2017 (World Bank, 2018). Inflation as a percentage of annual

GDP was 15.5 % in 2017. Currently, the country is experiencing negative growth in its GDP of -

0.7 % (OECD, 2018).

In 1994, the country ended the apartheid regime, instituted by the National Party since 1948,

which disenfranchised the black majority population in the country (Brown, 2008). Having been

a racially divided, inequitable, authoritarian and highly repressive society, with the release of

Nelson Mandela, the country entered a new democratic governance under the African National

Congress (ANC). The country was guided by one of the most liberal constitutions in the world,

including a Bill of Rights, which facilitated for especially black citizens to advance into free

citizens (ibid.). The ANC party is currently heading the country’s government in 2018, and has

been since 1994.

                                                                                               2
Figure 1:Geographical location of South Africa (Wikipedia.org)

2. History of South African higher education

The history of South Africa’s higher education is deeply entangled in the local politics and

economics of the country. The current formal university structure began with the University of

the Cape of Good Hope in 1873 and received its royal charter in 1877 (Carruthers, 2018). It was

modelled on the University of London. Both universities functioned more as examination centres

that conferred degrees to students, regardless of where they had acquired the knowledge (ibid.).

Teaching was conducted in various other parts of the country including Cape Town, Graaff-

Reinet and Stellenbosch. Later Bloemfontein, Burgersdorp, Kimberley, Johannesburg,

Grahamstown, Alice, Pietermaritzburg and other centres were included (Strydom, 2016). There

was no standard configuration of academic staff at these centres, nor the courses offered, as this

varied with budget and student interest. A system of patronage as opposed to demonstrated

qualification governed recruitment into the education system (Carruthers, 2018). In 1873, only

two colleges were recognised in the country, which were the South African College in Cape

Town and that at Graaff-Reinet. The ancestor of the Royal Society of South Africa, the

                                                                                                3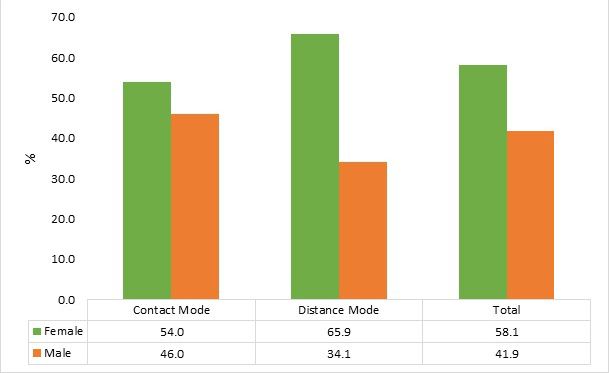
Philosophical Society of South Africa which was founded in 1877, was a strong supporter of the

university (ibid).

Post the Anglo-Boer War, there was a lot of contestation on where the capital and national

institutions, which included universities, would be located. It was, however, the actions of Alfred

Beit, who put a ten-year limit on his bequest, which influenced the government to intervene into

the contestation (Carruthers, 2018). By 1916, legislation was passed that transformed the

University of the Cape of Good Hope into a federal university. It became the University of South

Africa (UNISA), and relocated to Pretoria (Lefa, 2014; Strydom, 2016). Subsequent legislation

led to the creation of universities for Cape Town, Stellenbosch, Johannesburg, Pretoria and other

universities in the country. In 1959, also by legislation, UNISA became the guardian for colleges

for African, Coloured and Indian students. UNISA also became independent. In 1979, further

legislation was passed that created technikons in the country (Carruthers, 2018). These were then

allowed to confer graduate degrees, becoming known as universities of technology post 1993.

Mergers occurred within South African higher education in 2004, and in 2009, basic and higher

education separated into two cabinet ministries (CHE, 2007; Strydom, 2016).

3. The structural organisation of South African higher education

The governance of higher education in South Africa is divided through the Minister of

Education, the Department of (now Higher) Education (and Training) (DHET) , the Council on

Higher Education (CHE), as well as other bodies which the minister may appoint to act on

his/her behalf (CHE, 2007). The White Paper of 1997 gives the Minister the role of driving

policies as strategies for higher education transformation, whilst the Higher Education Act

                                                                                                 4
(1997) legislates the respective roles and responsibilities of the minister (ibid.). It is through this
act that the minister has the authority to establish a university, technikon or college, merge public
higher education institutions, and close public higher education institutions (sections 20, 23 and
25 respectively). The act also grants the minister the power to launch any investigations into
maladministration of higher education institutions in the country. The CHE was established as an
independent advisory body with the aim of facilitating transformation in the system, in
accordance to the vision and goals of the ministry (CHE, 2007). It also manages quality
assurance and promotion in the higher education sector. Furthermore, it acts as a safeguard
against the department’s intrusion on the autonomy of institutions, and also reduces the
differences between institutions on the basis of input factors and qualitative performance. It
therefore communicates any problems with the department’s relations with institutions to the
minister and the parliament.
4. Funding of South African higher education
The cost of delivering university Higher education in South Africa amounts to close to R50
billion annually (HESA, 2014). South Africa subscribes to a funding framework in which costs
are shared among the beneficiaries of university education, that is, government 50 %, student
tuition 25 % and other private income 25 %. It is important to note that these proportions are
averages of the system as a whole and they differ widely between institutions, as shown in Table
1. For example, government grants as a proportion of total income can be as low as 35 % if an
institution is able to raise private funds through research contracts, grants, donations and
investments and on the other hand can be as high as 65 % in the case of institutions which are not
able to generate substantial amounts of private income.
5Table 1: Funding allocated to public universities in South Africa by institution for 2016/17
(DHET, 2017)
Although funding of universities has been increasing annually from ZAR 11 billion in 2006 to
ZAR 26 billion in 2013, by 2012, government contributions to university education declined
from 49 % at the beginning of the century to 40 %, while the burden on students increased from
24 % to 31 % during the same period (HESA, 2014). With this increased burden on students, it is
therefore not surprising that each calendar year starts off with student protests demanding free
education or lower tuition fees or a cap on tuition fees.
6Interestingly, according to recent research by Servaas van den Burgh, South Africa spent the
lowest percentage of GDP in the world on higher education, and has been observed to be on a
decline as a percentage of the government’s budget and GDP (HESA, 2014). This has therefore
transferred the pressures of funding to tuition fees and third stream income, which includes
research grants and donations. Although some universities have managed to increase research
grant revenue, the money cannot fully compensate for the declines in government subsidies. The
allocation to the NSFAS was increased from ZAR 5.1 billion in 2013 to ZAR 12.4 billion in
2016/17, 33 .6 % higher than 2015, funding 451, 507 students, 8.8 % more than in 2016 (DHET,
2017). In spite of this, however, student protests at some universities are evidence that supports
that the allocation is inadequate to meet the needs of qualifying South African students. Over and
above the fact that NSFAS is already unable to fund the increasing number of students already in
the system, this problem is further compounded by the White Paper on Higher Education and
Training’s target of 25 % by 2030 (approximately 1.6 million students) who will need funding,
along with the commitment to free education for poor South Africans, which cripples tuition fee
revenues (HESA, 2014). The NDP of 2012 also imposes similar targets, particularly in science
and technology enrolments, with similar funding issues not well considered. Furthermore, with
increasing pass rates at the National Senior Certificate (NSC) levels (78 % in 2013) and at
bachelor degree levels (60 % in 2013), there is greater pressure that is likely going to fall on
universities and other post-school education and training institutions to absorb these students, in
spite of their limited funds (ibid.).
75. Universities in South Africa
According to the Department of Higher Education and Training, South Africa has 26 public
universities and 123 private higher education institutions (including universities), to a total of
149 universities. The 26 public universities are differentiated into 11 general academic
universities, nine comprehensive universities and six universities of technology (DHET, 2017).
The newest learning institutions are inclusive of Sefako Makgatho Health Sciences University,
Sol Plaatje University and the University of Mpumalanga. South Africa’s universities
accommodate in excess of 1 million students, a recent report by Business Tech shows that 25 of
the 26 schools have a combined total exceeding 622,000, while UNISA, with 400,000 students,
is the biggest tertiary institution in SA. University World News reports that 58 % of the students
in South African universities are women and 42 % men. There are still deep racial disparities
among scholars in universities. A general household survey held in Pretoria showed that despite
most students who attend Pretoria’s universities being black the proportion of people in this
population group who get an education remain proportionally low compared to whites. In 2016,
the racial make-up of students in South African universities was as follows, 66.4 % were black,
18.7 % were white, 7.8 % were Indian/Asian, and 7.1 % coloured ((DHET, 2017).
Table 2 shows the names and ranking of South African universities by Uni Rank. Uni Rank
accredits institutions based on the following criteria:
i)Being accredited, licensed and chartered by the appropriate South African higher education-related
organization, ii) offering at least four-year undergraduate degrees (Bachelor’s degrees) and/or
postgraduate degrees (Master or Doctoral degrees) and iii) delivering courses predominantly in a
traditional face-to-face, non-distance education format. Uni Rank puts the University of Pretoria (UP) as
8the best university in the country, however UP is not in the top 800th universities according to the
International Times Ranking. The University of Cape Town is rated 2nd in South Africa according to Uni
Rank but rates the best in South internationally at the 156th position. Overall, only five South African
Universities out of 26 are found in the top 800 universities in the world. Furthermore, its important to
note that the top 10 universities according to Uni Rank and also the five universities rated highly by
Times Ranking are the universities which were previously only for the white and affluent South Africans
and this problem still persists for places like Stellenbosch and University of North West. The least rated
universities according to Uni Rank are the small just recently established institutions as mentioned above.
Table 2: International and national ranking of South African universities
Names Location Times Ranking
Ranking UNI-RANK
Cape Peninsula University of Technology Cape Town 11
Central University of Technology Bloemfontein 16
Durban University of Technology Durban 15
Mangosuthu University of Technology Durban 20
Nelson Mandela University Port Elizabeth 12
North-West University Potchefstroom 7
Rhodes University Grahamstown 9
Sefako Makgatho Health Sciences Pretoria 24
University
Sol Plaatje University Kimberley 25
Tshwane University of Technology Pretoria 14
Universiteit Stellenbosch Stellenbosch 301-350th 6
Universiteit van die Vrystaat Bloemfontein 10
9University of Cape Town Cape Town 156th 2
University of Fort Hare Alice 13
University of Free State Bloemfontein
University of Johannesburg Johannesburg 601-800th 5
University of Kwa-Zulu Natal Durban 401-500th 4
University of Limpopo Mankweng 19
University of Mpumalanga Nelspruit 23
University of Pretoria Pretoria 1
University of South Africa Pretoria
University of Western Cape Bellville 8
University of Witwatersrand Johannesburg 201-250th 3
University of Venda Thohoyandou 18
University of Zululand Kwadlangezwa 22
Vaal University of Technology Vanderbijlpark 17
Walter Sisulu University Mthatha 21
5. South African higher education enrolments
Soon after South Africa’s democratic transition in 1994, the gross participation rate in higher
education was a meagre 17 % (HESA, 2014). Within that, participation was also highly biased by
race, with only 9 % black Africans, 13 % Coloured, 40 % for Indians and 70 % for whites.
Although black South Africans constituted 77 % of the population, they made up for only 40 %
of enrolments, where white South Africans, who constituted 11 % of the population, accounted
for 43 % of enrolments in higher education. Women were also underrepresented, as they made up
43 % of total higher education enrolments (ibid.). There is, however, a positive trend in student
10enrolment, particularly in public universities, where enrolments has nearly doubled between
2010 and 2016 (Table 3).
Table 3: Total number of students enrolled in public universities by attendance mode, population
group, gender and institution in 2016 (DHET, 2017)
11By 2011, however, student enrolments had almost doubled to approximately 938, 200 (HESA,
2014). Of this, 81 % were black (this includes Coloureds and Indians, in addition to black
Africans) students, and women constituted 58 % of total enrolments. Relative to the population
proportions of the country, however, South Africa is not where it hoped it to be, based on the
2001 National Plan for Higher Education, which set a target of a 20 % gross participation rate
(for blacks) by 2011. The majority of students are enrolled in public universities (Figure 2), with
most of these attending contact as opposed to distance (Figure 3), with the former increasing by
22.4 % compared to the later at 6.8 % between 2009-2016. However, by 2016, women females
were attending universities by distance at almost twice as much as males, showing its impact on
addressing possible gender disparities (Figure 4). In 2011, the gross participation rate of white
and Indian students was 57 % and 47 % respectively, whilst black African and Coloured students
were 17.3 % and 14 % respectively (HESA, 2014). This is in spite of the outlawing of racial and
sex discrimination, affirmative action, alternative admissions tests to complement the national
final secondary examination, the recognition of prior learning to facilitate access for mature
students, extended curriculum programmes for students that show potential, and a state funded
national student financial aid scheme (NSFAS). Further, enrolments at historically white
institutions continue to reflect a lower proportion of black representation relative to their
demographic representation whilst white students remain concentrated in these institutions
(Table 3). The opposite is true of previously black institutions, however, in post-apartheid South
Africa, issues of access, opportunities and outcomes are now more likely shaped by social class,
as opposed to race, as was previously the case.
12Figure 2:Total student enrolment in public and private HEI’s in South Africa between 2010-
2016 (DHET, 2017)
Figure 3: Total number of students enrolled in public Higher Education Institutions (HEI’s) by
mode between 2009-2016 (DHET, 2017)
13Figure 4: Proportion of students in either contact or distance education by gender in 2016
(DHET, 2017)
South African higher education also has a considerable number of foreign enrolments, most of
which are from neighbouring Zimbabwe. In 2016, South Africa had a total of 69, 381 foreign
students, comprising 7.1 % of its total enrolement in public universities (Table 4). Over a third of
these were Zimbabwean (37 %). 60.2 % of thses were in contact university, a third of these
enrolled in undergraduate programmes, 22.4 % for Masters and 17.8 % for doctorates. More than
half of the foreign students enrolled in distance learning had enrolled in undergraduate
programmes (Table 4).
14Table 4: Number of foreign students enrolled in public universities by country, attendance mode
and qualification type in 2016 (DHET, 2017
In comparison to the rest of Africa, South Africa displays strength in science and knowledge
production, being ranked 33rd in world publication output (HESA, 2014). Enrolment at post
graduate level in South Africa has been on the increase. In 1995, enrolment was at 70, 964, or
13.7 % of total student enrolment. This number had almost doubled by 2010 to 138, 608 students
(ibid.). Black students made up 71.6 % of this number, whilst 56 % were female. In 2010, 30,
083 students graduated at honours level, whilst 8, 618 and 1, 423 masters and doctorates were
awarded respectively. Of these, 63.3 % were black students, and 59.3 % were women. These
numbers, however, fall short of stipulated targets by the National Plan for Higher Education,
2001. Were 33 % was the target for masters graduation, only 19 % was achieved, and 13 % was
achieved as opposed to 20% for doctoral degrees (HESA, 2014). Success rates also differed by
rates, with a success rate of between 65-74 % for black students, against 80 % for white students,
15with lower success rates in the distance learning mode (Table 5). Furthermore, in comparison to
other countries such as Brazil, South Africa is producing very few doctoral graduates, for
example, in 2010, where the whole of South Africa produced 1, 423 doctoral graduates, the
University of Sao Paulo alone produced 2, 244.
Table 5: Undergraduate success rates of students in public universities by attendance mode,
population group and institution in 2016 (DHET, 2017
6. Quality of university education
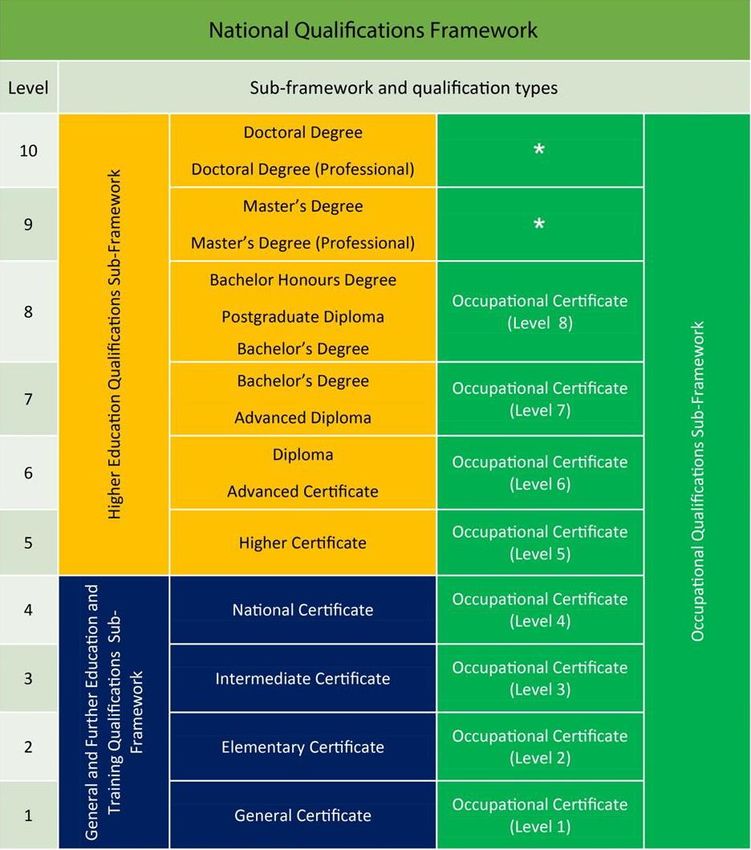
16Governing the quality of South African higher education is the National Qualifications
Framework Act 67 of 2008, which provides for the National Qualifications Framework (NQF;
SAQA, 2018a). The NQF has four main objectives which are to:
Create a single integrated national framework for learning achievements;
Facilitate access to, and mobility and progression within, education, training and career
paths;
Enhance the quality of education and training;
Accelerate the redress of past unfair discrimination in education, training and
employment opportunities.
The NQF is overseen by the South African Qualifications Authority (SAQA) which was
established by parliament (CHE, 2007). The NQF is a comprehensive system that was approved
by the DHET for the classification, registration and publication of articulated and quality-assured
national qualifications and part-qualifications. It is a single integrated system comprising three
coordinated qualifications sub-frameworks for general and further education and training, higher
education, trades and occupations (SAQA, 2018a).
6.1 Framework levels
The NQF is organised as a series of levels of learning achievement, arranged in ascending order
from one to ten. Each level on the NQF is described by a statement of learning achievement
known as level descriptors. There is one set of level descriptors for the NQF (Figure 5).
17Figure 5: Structure of the NQF levels (SAQA, 2018b)
6.1.1 Sub-Frameworks
The NQF is a single integrated system which comprises of three co-ordinated qualifications Sub-
Frameworks. These are:
18 General and Further Education and Training Sub-Framework (GFETQSF)
The Higher Education Qualifications Sub-Framework (HEQSF)
The Occupational Qualifications Sub-Framework (OQSF)
The Sub-Frameworks have qualifications registered at the following NQF levels:
GFETQSF - levels 1 to 4;
HEQSF - levels 5 to 10;
OQSF - levels 1 to 6. For NQF levels 7 and 8 the Quality Council for Trades and
Occupations can motivate for a qualification only in collaboration with a recognised
professional body and the Council on Higher Education, in a process co-ordinated by
SAQA (SAQA 2018a,b).
6.2 Factors affecting the quality of university education
Challenges in higher education are complex and the increase in access to education is a concern.
Student access, opportunity and success are also current challenges facing higher education in
South Africa (CHE, 2016). Throughputs drop-out, undergraduate success and graduation rates
are low; although these differ for white and black students.
The challenge of funding of higher education has been the biggest challenge. While funding for
higher education had increased from R11bn in 2006 to R26bn in 2013, it had actually declined in
real and student per capita terms (HESA, 2014). This puts pressure on tuition fee income and
research grants, contracts and donations. The DHET reports that out of the approximated million
students enrolled at South African Universities, the financial budget was only for 600 000
students, thus at least 400 000 students could not be taken care of properly (HESA, 2014).
19Furthermore, the universities are reported to be spending money on students who are not
finishing their studies mainly due to social issues. Thus, other stakeholders have questioned the
policy of free education in institutions of higher education. A CHE study showed that
approximately only 35 % in contact institutions graduate in the normal stipulated timeframe
(usually three years for an undergraduate degree), whilst 48 % make it in five years, and a
possible 55 % do not graduate altogether.
The National Planning Commission (NPC) acknowledges the challenges that came in with the
increased enrolment of students into university education. Due to the fast enrolment rates,
throughput rates have not kept up. Many students are under-prepared for university, requiring
universities to establish academic development programmes, for which they are often ill-
equipped to establish (CHE, 2007). Funding has also not kept up, resulting in slow growth in the
number of university lecturers, inadequate student accommodation, and dilapidating university
infrastructure and equipment shortages. According to Singh (2015), in the last five years, higher
education in South Africa has experienced a significant shift as focus has turned inwards to
teaching, learning and research practice of individual institutions. A specific area of interest has
been on teacher education as South Africa struggles to train enough teachers to meet its high
demand. A need for increased postgraduate throughput has forced higher education institutions
to focus on research capacity building in the areas of supervision, publications and staff
qualifications. Amidst these are the challenges of large classes, re-curriculation, and
development and use of local African languages. In the last five years, higher education teaching
and learning in South Africa has experienced a significant shift as focus has turned inwards to
teaching, learning and research practice of individual institutions. A specific area of interest has
20been on teacher education as South Africa struggles to train enough teachers to meet its high
demand. A need for increased postgraduate throughput has forced higher education institutions
to focus on research capacity building in the areas of supervision, publications and staff
qualifications. Amidst these are the challenges of large classes, re-curriculation, and
development and use of local African languages (CHE, 2007).
A leading academic has criticized a lack of reform at South Africa’s institutions of higher
education and has proven also to be a major challenge in South African higher education. In a
lecture entitled: “Transcending the past and re-imagining the future of the South African
University”, vice chancellor and Principal of the University of the Witwatersrand, Professor
Adam Habib, said that government has lacked the will or the imagination to develop historically
black universities. Habib highlighted troubled institutions Stellenbosch University, and the
University of the North West in particular (Business Tech, 2018). “The multicultural approach is
best reflected at the University of Stellenbosch and North West University, this approach has
spawned universities in South Africa today, 21 years after the transition where 63 % of its
student enrolment is white. VC noted that students with wealthy parents inevitably still attended
institutions including Wits, University of Cape Town and Stellenbosch University. Those from
poorer backgrounds attended the likes of Walter Sisulu University, and the University of
Zululand, Fort Hare University (CHE, 2016).
Another challenge to South Africa’s university sector is that less than half of academics have
doctoral degrees (34 % in 2014), which affects the quality if research as postgraduate
supervision, particularly at the doctoral level. Additionally, the performance of universities is
21highly uneven, with just ten universities churning out 86 % of all research and 89 % of all
doctoral graduates (HESA, 2014). With an ambitious target of having 5, 000 doctoral graduates
by 2030 according to the 2012 White Paper, challenges are not only confined to the
(un)availability of infrastructure, facilities and equipment, but extend to academic teaching and
supervision capacities.
Challenges of historical legacies of intellectual colonisation, racialisation and patriarchy pose
significant threats to the blossoming of ideas and scholarship in the country’s higher education.
Institutional cultures characterised by colonial and racial discourses challenge the empowering of
intellectual discourse communities (HESA, 2014). This necessitates ongoing transformation of
these cultures to ensure academic freedom. An engagement with ontological and epistemological
issues is needed. Challenges therefore exist where teaching occurs in a locality where the
dominant intellectual paradigms are products that are not reflective of the African experience,
but rather, that which descends from the West. Academics in South Africa are overwhelmingly
white (83 %) and male (68 %). Whilst the black African population is approximately 80 %, the
academic workforce only has an estimated 10 % of blacks (HESA 2014, DHET, 2017). Although
strides have occurred to correct this, with 2012 figures showing that this proportion reduced to
53 % and 55 % white and male academics respectively, the distribution of these is still skewed to
follow historical contours of race and ethnicity.
7. Proposed strategies for expanding access to and improving the quality of university
education
22In response to the problems of high attrition and low graduation rates, which have significantly
reduced the net gains in access, in 2013, the CHE proposed that the undergraduate curriculum be
reformed. Such reformation would see the introduction of a flexible curriculum structure; along
with a one year increase to the standard time complete an undergraduate degree (HESA,2014).
The CHE, is, however, aware such changes would entail significant transformation in the entire
teaching and learning sphere, and would also require a massive building of the academic
capabilities of universities.
Student funding is another key area governing equity of access, opportunities and outcomes in
South Africa. As such, the White Paper of the DHET, 2014, commits the government to
gradually introduce free education for the poor as more resources become available. The
National Development Plan (NDP) of 2012 also states that all students who qualify for NSFAS
be provided with loans and bursaries that cover the costs of tuition and accommodation books
and other living expenses (HESA, 2014). Those that do not qualify for NSFAS are to be given
access to bank loans whilst the state provides them with sureties.
In order to remedy the uneven distribution of teaching, research and supervision capacities of
universities, inter-university collaboration has been granted great scope. However the nature,
terms and conditions of these remain contentious issues. Furthermore, apart from the formal
acquisition of doctoral degrees for academics who will subsequently supervise other doctoral
students, formal development programmes, mentoring and experience in co-supervising
alongside experienced supervisors has been put on the table as a way forward (HESA, 2014,
CHE,2016).
Many of these propositions by the government, however, have been criticised to be expansive in
vision, yet short on details. It is not clear how priorities will be formulated inter alia the present
23social and political dilemmas. Furthermore, since trade-offs are inevitable, their implications for
values and goals have to be confronted.
24References
Brown, A. (2008). Rainbow nation-dream or reality. BBC News. Accessed online at
http://news.bbc.co.uk/2/hi/africa/7512700.stm on 28 October 2018.
Business Tech. (2018). Accessed online at https://businesstech.co.za/news/general/101412/here-
are-south-africas-26-universities on 20 October 2018.
Carruthers, J. (2018). South African universities-a historical perspective. Royal Society of South
Africa. Accessd online at http://www.royalsocietysa.org.za/?page_id=2075 on 28 October 2018.
Council on Higher Education, South Africa. (2007). Review of higher education in South Africa.
Accessed online at http://www.che.ac.za/media_and_publications/research/review-higher-
education-south-africa on 28 October 2018.
Council on Higher Education. (2016). South African higher education reviewed: Two decades of
democracy, Pretoria.
Department of Higher Education and Training. (2017). Statistics on post-school education and
training in South Africa, 2016. Accessed online at
http://www.dhet.gov.za/DHET%20Statistics%20Publication/Statistics%20on%20Post-
School%20Education%20and%20Training%20in%20South%20Africa%202016.pdf on 28
October 2018.
Govinder, K. S., Zondo, N. P., & Makgoba, M. W. (2013). A new look at demographic
transformation for universities in South Africa. South African Journal of Science, 109(11-12), 1-
11.
25Higher Education South Africa. (2014). South African higher education in the 20th year of
democracy: Context, achievements and key challenges. Accessed online at http://pmg-assets.s3-
website-eu-west-1.amazonaws.com/140305hesa.pdf on 28 October 2018.
Lefa, B.J. (2014) History of higher education in South Africa. Cape Peninsula University of
Technology.
OECD. (2018). South Africa-Economic forecast summary (May 2018). Accessed online at
http://www.oecd.org/economy/south-africa-economic-forecast-summary.htm on 28 October
2018.
South African Qualifications Authority. (2018a).NQF. The South African National
Qualifications Framework. Accessed online at http://www.saqa.org.za/list.php?e=NQF on 28
October 2018.
South African Qualifications Authority. (2018b). The role of the National Qualifications
Framework (NQF) and the National Learners’ Records Database (NLRD) in showing trends in
the education and training sector. Accessed online at
http://www.saqa.org.za/docs/pubs/2018/Fact%20Sheet%20SAQA-FPI.pdf on 28 October 2018.
Statistics South Africa. (2018). Statistics by theme. Accessed online at
http://www.statssa.gov.za/?page_id=595 on 28 October 2018.
Strydom, B. (2016). South African University history: a historiographical overview. African
Historical Review, 48(1), 56-82.
26Times Higher Education Ranking. (2018). Accessed online at
https://www.timeshighereducation.com/student/where-to-study/study-in-south-africa on 20
October, 2018.
University World News (2017). Accessed online at
http://www.universityworldnews.com/article.php? On 20 October 2018.
Unknown. (2018). South Africa’s geography. Accessed online at
https://web.archive.org/web/20100608121736/http://www.safrica.info/about/geography/geograp
hy.htm on 28 October 2018.
World Bank. (2018). South Africa. Country Profile. Accessed online at
http://databank.worldbank.org/data/views/reports/reportwidget.aspx?Report_Name=CountryProf
ile&Id=b450fd57&tbar=y&dd=y&inf=n&zm=n&country=ZAF on 28 October 2018.
27You can also read