UNDERSTANDING MIDDLE EAST EDUCATION - EGYPT COUNTRY PROFILE PWC EDUCATION AND SKILLS PRACTICE
←
→
Page content transcription
If your browser does not render page correctly, please read the page content below
Understanding
Middle East
Education
Egypt Country Profile
PwC Education and Skills Practice

First Edition, 2018/2019

pwc.com/me
Egypt has the largest
education system in the
Middle East and North Africa
(MENA) region

                                                                In 2016/17, the total enrolment at the K-121 level amounted to 20.6 million,
This series of infographics                                     while total enrolment at the Higher Education (HE) level amounted to 2.4
                                                                million students2. Egypt represents an excellent opportunity for investors and
provides a country by country                                   education providers looking for growth in the MENA region due to favourable
overview of the education                                       investment fundamentals and conditions which include:

sector in the Middle East                                       •     A sustainable demand for education due to steady population growth,
                                                                      in a culture that has long valued education as the means to social and
                                                                      economic mobility
                                                                •     An improving macroeconomic setting showing strong signs of recovery
                                                                •     The Government of Egypt (GoE) actively encouraging private-sector
                                                                      participation to help relieve budgetary strains
                                                                •     A stable institutional setting owing to the maturity of Egypt’s education
                                                                      system3
                                                                •     A need for investment in bridging skills gaps through vocational training
                                                                      and enhanced higher education offerings

                                                                Whilst there is a lot to cover in the Egyptian education system, we have chosen
                                                                to focus on two main topics in this report:
                                                                1. The status of Egypt’s education system across its multiple stages
                                                                2. The opportunity for growth in private provision

1
  Total K-12 student enrolment in public and private schools. Enrolment at the General Education stages, excluding religious education in the Al-Azharite system and
technical secondary education, amounted to 19.4 million
2
  Central Agency for Public Mobilisation and Statistics (CAPMAS) Statistical Yearbook 2018
3
  Egypt has one of the oldest universities in the world (Al-Azhar)

                                                                                                                                               Egypt Country Profile | 3
Overview of the Education System

There is a strong reliance on the government as the main education provider in Egypt. In 2016/17, 90% of the total K-12 student
population attended public schools and 94% of total HE students attended public universities4.

The GoE’s Education Strategy in Vision 2030 acknowledges that the system is yet to deliver high quality education which is
essential to meet the country’s labour market needs and respond to the evolving social and political systems. The Ministry of
Education and Technical Education (MoETE) developed an education reform program (2018-30) with a total expected cost of USD
2 billion.

Figure 1: Structure of the Egyptian Education System

Source: CAPMAS Statistical yearbook 2018

4
    CAPMAS Statistical Yearbook 2018

4 | PwC
Over the last decade, enrolment in Egypt’s K-12 education system grew by 32% with a compound annual
                       growth rate (CAGR) of 2.8%. Excluding religious education in the Al-Azharite system and technical secondary
                       education, there are 19.4 million students enrolled in Egypt’s general education system. Net enrolment in
                       primary and secondary stages reached 97% and 81%, respectively, well above the global averages of 89% for
                       primary education and 66% for secondary education5.

Figure 2: Student Enrolment between 2008/09 and 2017/18 (in millions)6

                                                                                                                                        CAGR (2008/09 - 2017/18)

Source: CAPMAS Statistical yearbook 2018

Table 1: The World Economic Forum’s Global Competitiveness Report 2017/18, Progress in
International Reading Literacy Report 2016 and United Nations Development Programme
Human Development Report 2017

                      Enrolment                                                  Quality

        Indicator                     Rank/137                     Indicator                    Rank/137                      Such rapid growth in
                                                                                                                              enrolment has ultimately
       Primary                                                 Quality of                                                     affected learning outcomes as
       education                                               primary                              133                       it placed increasing pressures
                                           33
       enrolment                                               education                                                      on school facilities and in
                                                                                                                              some occasions necessitated
                                                               Overall                                                        the hiring of insufficiently
       Secondary                                                                                                              qualified teachers. Moreover,
                                           84                  quality of the                       130
       education                                                                                                              demand for education
                                                               education
       enrolment                                                                                                              surpasses the current level
                                                               system
                                                                                                                              of available resources which
                                                               The PIRLS 2016                                                 adversely affects quality
                                                               (Progress in                 60 (out of 61                     of service provision. While
       Tertiary
                                                               International                participating                     Egypt is ranked among top
       education                           76
                                                               Reading Literacy             countries)                        performing economies in
       enrolment
                                                               Study) Grade 4                                                 enrolment particularly at the
                                                               results                                                        primary level, it is consistently
                                                               Human                                                          ranked amongst the poorest
                                                                                            115 (out of 189
                                                               Development                                                    performing economies in
                                                                                            participating
                                                               Index (2017)7                                                  education quality.
                                                                                            countries)

5
    CAPMAS Statistical Yearbook 2018
6
    Student enrolment in both public and private schools, preparatory student enrolment in general, professional and sports education
7
    Egypt’s HDI value for 2017 is 0.696— which put the country in the medium human development category

                                                                                                                                             Egypt Country Profile | 5
Figure 3: 8th Grade TIMSS Maths and Science Achievement in 20158

                                                                                                                                Egypt’s performance
                                                                                                                                in 8th grade TIMSS
                                                                                                                                in 2015, similar to
                                                                                                                                other countries in the
                                                                                                                                region, was poor. The
                                                                                                                                results also showed no
                                                                                                                                significant improvement
                                                                                                                                relative to 2007 results.
                                                                                                                                Only 1 in 20 Egyptian 14
                                                                                                                                year olds reached a high
                                                                                                                                level of science ability
                                                                                                                                compared to over 50%
                                                                                                                                in many top performing
                                                                                                                                countries in Asia.

Source: TMISS 2015 International Results in Mathematics Report and TMISS
2015 International Results in Science Report

The MoETE’s education reform strategy aims to improve the above mentioned learning outcomes through the following two
approaches9:

    1.   EDU 1.0 which includes a set of initiatives aiming to structurally adjust and reform the existing education system
    2.   EDU 2.0 which includes a set of bold interventions that aim to improve educational outcomes and modernise the education
         system to deliver on Egypt Vision 2030 targets

The reform program, which began implementation in the academic year starting in September 2018, adopts modern technology
for teaching and learning, student assessment and data collection. Some of the associated interventions include:

    •    The Egyptian Knowledge Bank: an online library archive that is accessible with national ID and provides educational,
         research and cultural resources to all citizens.
    •    Technology based learning: nationwide distribution of one million tablets among 10th grade students, teachers and school
         directors with relevant content to improve learning engagement.
    •    Modernised student assessment: the reform program changed the assessment method for national high school (Thanawiya
         Amma) certificate, which determines the education pathways students will follow - end of year exams at G10-12 have been
         replaced with a cumulative 3 year GPA. To avoid any potential leaks of exam questions, paper exams will be replaced by
         electronic tests which improve and standardise student evaluation.

8
 TIMSS is undertaken every 4 years and therefore provides an important rolling view of how the education system is performing. The next TIMSS test will take place in
2019
9
 The World Bank, Supporting Egypt Education Reform Project, 2017

6 | PwC
Scope for Increasing Private Provision in Egypt’s
Education Sector

Egypt has a highly subsidised public education system. In 2014, Egypt’s newest constitution stretched the years of state funded
compulsory education till the end of secondary or its equivalent. This resulted in an increase in annual public expenditure on
education which amounted to EGP 107 Billion (USD 6 Billion)10 in FY 2017/18, compared to EGP 81 Billion in FY 2013/1411.
However, public expenditure on education as a percentage of total expenditure declined to represent only 9% in FY 2017/18
compared to 12% in FY 2013/1412.

The GoE began actively encouraging private sector participation and investments in the education sector to help relieve budgetary
strains. In FY 2017/18 the overall budget deficit represented nearly 10% of GDP, and total public debt reached 109% of GDP in
March 201713.

Currently, the private sector constitutes only 10% of total enrolment in Egypt’s K-12 education system. Private schools
accommodate 24% of kindergarten students, 8% of primary school pupils, 7% of middle school students and 13% of general
secondary school students14. It is anticipated, however, that the provision of private education in Egypt will increase driven by the
following favourable investment fundamentals and conditions:

 1. A sustainable demand for education due to steady population growth
    Egypt has a young and growing population. Over the last decade, Egypt’s population grew steadily at an average annual rate
    of 2.4%. In 2017, 51% of Egyptians were below 25 years old. According to UN data forecasts, the growth trend for Egyptians
    eligible for G1-12 and HE is forecasted to accelerate over the next decade. Such growth alongside increasing participation
    will put further pressure on provision.

Figure 4: Egypt’s Population by Education Stage (in millions)

Source: CAPMAS Statistical yearbook 2018 and UN World Population Prospects 2017

10
   Based on January 23rd 2019 exchange rates
11
   The Egyptian Constitution, 2014
12
   CAPMAS Statistical Yearbook 2018
13
   The Ministry of Finance, The Financial Monthly Statistical Bulletin, December 2018
14
   CAPMAS Statistical Yearbook 2018

                                                                                                                  Egypt Country Profile | 7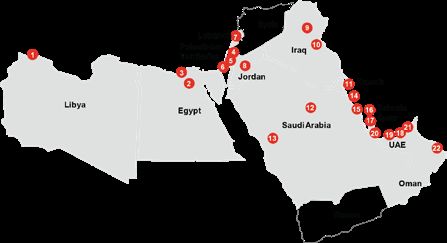
2.   An Improving Macroeconomic Setting
     In an attempt to address the significant macroeconomic imbalances that Egypt faced since 2011 and restore fiscal and
     monetary stability, the government embarked on a comprehensive economic reform program. In November 2016, the IMF
     approved a financial assistance package for Egypt amounting to USD 12 billion. Some of the key fiscal and monetary reform
     measures undertaken by the GoE are highlighted below.

Figure 5: Fiscal and Monetary Changes in the Economic Reform Agenda15

Reduction of                                                Increasing Utility                                        Introducing the Value
Energy Subsidies                                            Prices                                                    Added Tax (VAT) Law

In FY 14/15, the government                                 The government also increased                             In September 2016, the
launched an energy subsidies                                electricity, water and sewage                             government introduced a
reform program which reduced                                prices. The government iterated its                       new VAT law which included
subsidies and fuel prices have                              initial plans to phase out electricity                    the previously exempted
since increased multiple times.                             subsidies entirely by the end of                          services sector and private
In November 2016, fuel prices                               FY2020/21 instead of FY 2018/19.                          professionals. The standard
increased by 38% before being                                                                                         tax rate was also increased to
increased by an additional 55%                                                                                        13% in FY 16/17 and 14% in FY
in June 2017. A year later in June                                                                                    17/18 onwards.
2018, fuel prices increased an
additional 51%.

Increasing Customs Tariffs                                  Floating the EGP                                          Adjusting Interest Rates

Customs tarrifs were increased                              The Central Bank of Egypt (CBE)                           The CBE continued to adjust
in 2016 by Presidential Decree                              floated the EGP in November                               inflation rates to curb inflation.
no. 538 for some ‘luxury’ imports                           2016 which subsequently led                               It increased interest rates on
to reach a range between 40-                                to the currency losing more                               the currency flotation day and
60% which included cosmetics,                               than 100% of its value versus                             persuaded public banks to issue
electronic gadgets and household                            all foreign currencies. This                              high return investment certificates
appliances.                                                 immediately impacted inflation                            with 20% interest rates. Interest
                                                            which peaked in 2017, where                               rates were lowered for the first
                                                            annual inflation rates hovered                            time since the flotation of the
                                                            around 30%, before gradually                              EGP in February 2018 as inflation
                                                            decreasing to reach 11.1% in                              rates began to adjust.
                                                            December 2018. The devaluation
                                                            also led to a hike in tuition fees,
                                                            which is expected to increase
                                                            inbound and decrease outbound
                                                            university students.

 Data from multiple sources: Reuters, the International Monetary Fund (IMF), Egyptian Electricity Holding Company Annual report 2016/17, The Egyptian Parliament,
15

Central Bank of Egypt, Monetary Policy Committee and Ministry of Finance

8 | PwC
Egypt’s economy is recovering: the IMF forecasts economic growth to reach 5.5% in 2019 and 6% in 202316. In May 2018, Egypt’s
sovereign rating was upgraded to B from B- by S&P Global Ratings citing strengthening economic growth and rising external
foreign exchange reserves. Later in August 2018, Moody’s changed the outlook on the GoE long-term issuer ratings to positive
from stable. The above-stated economic reforms, however, has an adverse impact on real incomes of Egyptian households and
sent inflation soaring. To avoid overburdening the fiscal budget and the potential long-term negative repercussions of inflation on
education provision, it is anticipated that the GoE will take the necessary actions to support an increase in private provision in the
education sector.
Figure 6: Real GDP Growth Rates and Forecasts
Source: IMF, Egypt Economic Outlook, October 2018
16
The IMF, Egypt Economic Outlook, October 2018
Egypt Country Profile | 93. A need for investment in bridging existing skills gaps
Egypt’s unemployment rate stood at 10% during the third quarter of 2018, compared to the 11.9% during the same quarter
of 2017. Whereas the average unemployment rate amounted to 12% in 2017, it reached 33% for Egypt’s youth (15 to
29 years old) during the same year17. Moreover, the return on investment for HE attainment in Egypt is not guaranteed.
As indicated in Figure 6, 34% of Egypt’s unemployed in 2017 had received undergraduate or post graduate degrees,
representing the second largest unemployment category by educational status. The vast majority of these students, as
discussed in detail in the HE section of this report, are enrolled in fields that ultimately prepare them for white collar skill sets.
Nonetheless, the demand for employment is increasingly driven by blue collar opportunities. The education system’s poor
quality, the high unemployment rates and the clear shortage in secure white collar work suggest that Egypt’s large supply of
graduates are not acquiring the skills required by employers driving this economic growth.
Figure 7: Distribution of Unemployed Individuals by Education Status in 2017
Undergraduate
and post-graduate Upper than intermediate
degree holders and lower than university
34% degree holders
4%
The return on investment
for HE attainment is
Illiterate
not guaranteed. 34%
3% of Egypt’s unemployed
in 2017 had received
Read and Write
undergraduate or post
2%
graduate degrees - they
represent the second
Lower than
intermediate
largest unemployment
8% Intermediate category by educational
48% status.
Source: CAPMAS Statistical yearbook 2018
Table 2: Students’ Perceptions on Skills Acquisition in 2009 and 2014 SYPE
How did you acquire your skills?18
2009 2014
The students surveyed
by the Population
Council’s Survey
of Young People in
Egypt (SYPE) in 2009
and 2014 referenced
apprenticeships and on
the job training more
commonly than formal
education as a source of
skill acquisition.
17
International Labour Organization ILOSTAT database, 2018
18
3,176 and 2,447 Egyptian youth (15 to 29), were interviewed in the 2009 and 2014 SYPE, respectively. Data from the Population Council, Survey of Young People in
Egypt, 2009 and 2014
10 | PwCHigher Education
The primary provider of HE in Egypt is the public sector. In FY 2016/17, 94% of total HE students were enrolled across Egypt’s
public universities19. Evidence of social and cultural pressures emphasising the importance of obtaining a university degree have
been present since the 1950s. This is primarily due to a longstanding public sector employment guarantee for university graduates
which was introduced in the 1960s and abolished in the late 1990s.
Public universities in Egypt are the largest in the region and free of charge, leaving the institutions with vast resource limitations.
The majority of the universities’ resources are allocated to current expenditure, rather than capital, which suggests that internal
efficiency in HE spending could be improved.
High enrolment rates in public universities along with budgetary caution on capital expenditure suggest that the government will
continue to facilitate more growth in the HE private sector’s capacity. There is also a need for structural transformation work to
improve the performance of overburdened and operationally inefficient public universities, especially given budget limitations. The
state funds 85-95% of public universities’ budgets, and universities have to raise the rest of the funding themselves - for example
from establishing relatively high fee bearing programs with the credit hour system, joint industry partnerships and research
projects, etc20.
19
CAPMAS Statistical Yearbook 2018
20
The Ministry of Finance Transparency Initiative
Egypt Country Profile | 11Figure 8: Trend in HE Enrolment by University Type
Source: CAPMAS Statistical yearbook 2018, PwC analysis
If enrolment trends persist, close to 900 thousand additional students may enrol in HE by 2021/22. The
increase is driven by (i) an increase in tertiary aged population by 400,000 and (ii) a continual improvement in
HE participation rate.
A law regulating the establishment of International Branch Campuses (IBCs) for foreign universities in Egypt was issued under
no. 162 for 2018 and came into force in August 2018. The law aims at facilitating the procedures and streamlining the licensing
requirement for establishing a branch of a foreign university. Under this law a foreign university can establish its own branch, agree
with an education institute in Egypt to host the branch or enter into a form of partnership with an Egyptian university to grant a
joint degree. In addition, according to article 19 of the new law the IBC shall enjoy all investment guarantees stipulated in the
Investment Law no. 72 of 2017.
It is worth noting that establishing an IBC in Egypt previously required the conclusion of an international treaty between Egypt and
the home country of the concerned university. Moreover, the Private and Public Universities Law no. 12 of 2009 mandated that the
majority of the owners of a private university must be Egyptian nationals which used to pose another barrier for foreign universities
to establish branches in Egypt.
12 | PwCFigure 9: Top 5 Public Higher Education Institutions by Figure 10: Top 5 Private Higher Education Institutions by
Enrolment in 2016/17 Enrolment
Mansoura University 146,985 German University 10,637
Modern University for
Alexandria University 183,522 10,733
Technology & Information
Ain Shams University Modern Science & Art University
189,822 11,514
Cairo University 253,444 6 October University 20,989
Al-Azhar University Misr Technology &
317,032 20,684
Science University
Source: CAPMAS Statistical yearbook 2018
Four universities in Egypt are ranked in the top 20 universities in the Arab Region by QS World University Rankings. Despite a
declining trend in its ranking over time, the American University in Cairo (AUC) is the only university in Egypt that is consistently
ranked in the top 10 in the region.
Table 3: Egypt’s University rankings for the Arab Region in the QS World University Rankings
University Ranking in 2017 Ranking in 2018 Ranking in 2019
Source: QS World University Rankings 2018 and 2019
Egypt Country Profile | 13Figure 11: Top 10 Fields of Study in Public Education (enroled students in thousands)
Comparable to global
and regional trends, the
highest proportion (28%)
of HE students enroled in
public universities in Egypt
are enrolled in business
courses. 98.7% of Egypt’s
HE students studying in
public universities are
enrolled in 10 fields of
study, ultimately preparing
students with a white collar
skill set. Conversely, the
demand for employment
is increasingly driven by
blue collar and low skilled
opportunities.
Source: CAPMAS Statistical yearbook 2018
Figure 12: Development in Total Number of Employees per Economic Sector (in millions)
The top three sectors in
terms of employment growth,
between 2012 and 2016,
were wholesale and retail
trade (16%), transportation
and warehousing (15%) and
manufacturing (11%). The
agricultural sector on its
own represents 26% of total
employment.
Sectors with heavy reliance
on white collar employment
including Telecommunications
Finance and Banking, Tourism,
Real Estate, cumulatively
denoted in the ‘other’
category, represent only 20%
of total employment.
2012 2016
Source: CAPMAS Statistical yearbook 2017, PwC analysis
14 | PwCTechnical and Vocational Education and Training
(TVET)
Given Egypt’s labour market dynamics, there is clearly a need to expand and improve TVET in Egypt. It is worth noting however
that TVET is perceived by many Egyptians as a ‘last resort’ for academically low-performing students who are denied access to
the general education, a pre-requisite for university enrolment.
Formal TVET is provided through preparatory vocational education, secondary technical and vocational, and higher education in
technical colleges and Institutes of Industrial Education (IECs). Egypt’s TVET system suffers from fragmentation as 17 ministries
are involved in the vocational training while the MoE governs the technical colleges21.
Figure 13: Secondary TVET Enrolment (measured in millions)
At current growth rates,
an estimate of 295
thousand additional
seats in secondary
TVET will be needed by
2022.
Total Private TVET Enrolment Total Public TVET Enrolment
Source: CAPMAS Statistical yearbook 2018, PwC analysis
Figure 14: Secondary TVET Enrolment by Specifications in 2017 (measured in thousands)
The only specification
where the private
sector is the lead
provider is Tourism
& Hospitality
(59%). In Industrial
and Commercial
specifications private
sector provision
amounts to only
0.4% and 11.6%,
respectively. There
are no private
TVET providers for
Public Enrolment agricultural training.
Private Enrolment
Source: CAPMAS Statistical yearbook 2018, PwC analysis
21
OECD School for Skills: A New Learning Agenda for Egypt, 2015
Egypt Country Profile | 15Grade 1-12 Education
Figure 15: Grade 1-12 Enrolment by School Type and Participation Rate
Private sector
provision at the
primary, preparatory
and secondary stages
represents only
10%, 7% and 13%,
respectively. However,
enrolment in private
schools is growing at a
faster rate than public
schools with a CAGR of
4% between 2013 and
201722.
Assuming full capacity
of existing provision,
an estimated number
of nearly 2.4 million
additional seats in
grades 1-12 will be
needed by FY 2022/23
at current growth rates.
Source: CAPMAS Statistical yearbook 2018, PwC analysis.
22
CAPMAS Statistical yearbook 2018
16 | PwCTable 4: New Seats Required at G1-12 levels assuming full occupancy of existing schools
Estimated
Number of Estimated
Additional Number of
Grade Level Seats Required Additional
by FY 2022/23 Seats Required
(both public in Private
and private) Schools
Figure 16: Average Class Size by Education Stage
As student enrolment
growth outpaces the
capacity of the system,
average class sizes in
Egypt are nearly double
global benchmarks
particularly at the primary
stage. Such high densities
burden infrastructure, limit
the students’ chances for
obtaining individualised
learning experiences and
are likely a contributing
factor to poor learning
outcomes. Efforts to reduce
class sizes would raise
costs considerably and
also increase the chances
of hiring poorly-qualified
teachers to cope with
demand.
Source: OECD Schools for Skills report, 2015
Egypt Country Profile | 17Figure 17: Percentage of Students Attending Full day Vs. Double Shifts Schools23
Due to capacity
constraints in Egypt’s
public schooling system,
37% many schools operate in
double shifts, especially
Morning or Evening
in densely populated
Shifts Students
urban areas. 37% of
63% Full Day Students students in Egypt attend
multiple shift schools
which last for 4.5 hours,
in contrast to full day
schools which operate
for 7 hours, making
school time insufficient
to cover curriculum.
Source: Ministry of Education (MoE)
23
Full-day schools operate for 7 hours with 1 hour lunch break, multiple shift schools operate for 4.5 hours per shift (morning and evening).
18 | PwCKindergarten
Figure 18: 4-5 Population and Kindergarten Enrolment by School Type (in millions)
Total Public Enrolment Kindergarten Population (4 to 5 years old)
Total Private Enrolment
Enrolment in kindergarten (KG)
is one of the lowest among
MENA countries, at 31%. Based
Participation
Participation on historical growth rates and
Rate (32%)
Rate (27%) assuming full current capacity,
an estimate of nearly 225,000
additional seats in KGs will be
needed by FY 2022/23 of which
70 thousand are forecasted to be
generated by private schools.
Source: CAPMAS Statistical yearbook 2018, PwC analysis
Figure 19: Kindergarten Student to Teacher Ratio per Region24
Inequality in access is also
prevalent. The majority of KG
provision remains concentrated
in the more affluent Greater Cairo
region where 54% of total KG
students are enrolled and student
to teacher ratio is the lowest at a
rate of 23 students per teacher.
Conversely, the student to teacher
ratio is highest in Upper Egypt,
the region with the highest poverty
rates. Due to the strong association
of KG enrolment with family income,
the majority of children from low
income groups are estimated to be
Source: CAPMAS Statistical yearbook 2018, PwC analysis deprived of ECE.
24
CAPMAS’ calculations for student-teacher ratios include the large proportion of the teaching force in administrative positions and may therefore be inflated.
Egypt Country Profile | 19Conclusion
Egypt’s future prosperity relies heavily on its citizens receiving a high quality education that prepares
them for life in a rapidly changing economic and social setting. While the country has enjoyed major
achievements in improving access at the primary and secondary stages and getting more girls into
the education system, the system is yet to deliver the quality of education to support the nation’s
educational, economic, and social needs.
We believe there is both a strong opportunity and need for increasing private sector involvement in
Egypt’s education system’s funding, structure and provision.
Increased private sector enrolment will help Egypt’s government to relieve the budgetary pressures
of a highly subsidised public education system and an increasing fiscal deficit. The opportunity for
private sector involvement is also favourably reflected in the following investment dynamics:
1. A sustainable demand for education due to steady population growth
2. An improving macroeconomic setting
3. A stable institutional setting owing to the maturity of Egypt’s education system
4. A need for investment in bridging skills gaps through vocational training and enhanced higher
education offerings
While stronger collaboration with the private sector is needed, the GoE should be mindful of the
following points:
• While private sector providers enhance parent choice in terms of quality, and relieve
governments of capacity pressures, it is essential for government to maintain a balance between
public and private education to ensure equitable access to education for all
• Private investors will be encouraged to focus on the education sector if there is a stable
regulatory environment that provides the right incentive structure, supports their operating
models and does not unduly impact on their ability to enter the market
20 | PwCContact Us
Sally Jeffery Maged Ezzeldeen Tom Harrison
PwC | Partner PwC | Country Senior Partner - Egypt PwC | Director
Global Education Network Leader Direct: +20 (0) 2 27597877 Direct: +971 (0) 4 304 3933
Mobile: +971 56 682 0539 Mobile: +20 (0) 122 3421 386 Mobile: +971 (0) 56 216 1099
Email: sally.jeffery@pwc.com Email: maged.ezzeldeen@pwc.com Email: thomas.harrison@pwc.com
Yomna Nassar
PwC | Senior Consultant
Mobile: +971 (0) 50 722 3468
Email: yomna.nassar@pwc.com
Egypt Country Profile | 21You may also be interested in…
Understanding Middle East Education: UAE Country Profile
The UAE is one of the more mature markets in the region and remains a draw for investors, providers
and students. Its scale and ambition remain undimmed, but what is the reality on the ground and
what do the trends over time tell us about the education sector by segment? Finally what are the key
differences between its two main markets – Dubai and Abu Dhabi?
Understanding Middle East Education: KSA Country Profile
The current nature of policy review and strategic overhaul in Saudi Arabia mean that the mechanisms
for delivering education in the coming years are in flux. The initial education related objectives laid
out in Vision 2030 challenge all elements of the system to improve on historical performance and
prepare the country’s workforce for a diversified and knowledge-based economy.
Reimagining the student journey
‘Reimagining the Student Journey’ is the first in a series that examines the key themes influencing
one of the world’s most dynamic regions in Higher Education – the Middle East. This paper looks
at how Higher Education Institutions (HEIs) in the region can apply a Student Journey management
approach to help build efficient, customer-centric organisations that are agile enough to survive and
thrive in a rapidly changing. We look at the main issues facing Higher Education in our region and
how Student Journey design and management can help Universities to meet these challenges.
Improving learning for children with social, emotional and behavioural difficulties
How can we improve learning for children with social, emotional or behavioural difficulties (SEBD)?
Globally, one of the challenges facing policy makers is providing education to students who cannot
access mainstream provision, or to those who need additional support to do so. This is particularly
true for children with social, emotional or behavioural difficulties (SEBD) who may need specialised
environments to address their needs or who can exhibit disruptive behaviour that can result in
exclusion from mainstream education environments.
22 | PwCAbout the PwC Education and Skills practice
PwC has operated in the Middle East region
for more than 40 years.
Collectively, our Middle East network
employs in the region of 5000 people
including over 180 partners working from
offices in 23 locations across 12 countries:
Bahrain, Egypt, Iraq, Jordan, Kuwait,
Lebanon, Libya, Oman, the Palestinian
territories, Qatar, Saudi Arabia and the
United Arab Emirates
Our Education and Skills practice works nationally and internationally
across the education sector with private and public sector providers,
regulators and funding agencies.
Our team of dedicated education specialists offer deep strategic
and operational expertise in all the key sectors, from primary and
secondary through to vocational and higher education.
We provide advisory and assurance services including: sector
strategy, reform and policy development; quality inspection and fee
regulation; strategic planning and implementation for new education
institutions; curricula design and programme accreditation; operational
efficiency; education technology; market entry and expansion strategy.
We also have the resources to conduct in-depth research into
education sector issues such as labour market readiness and national
curricula reform.
Our areas of expertise include:
• Institutional implementation
• School quality improvement and regulation
• Market entry and growth strategy
• Strategy and policy development and implementation
• Education digital transformation
pwc.com/me/education
Egypt Country Profile | 23pwc.com/me
About PwC
At PwC, our purpose is to build trust in society and solve important problems. We’re a network of firms in 158 countries
with over 250,000 people who are committed to delivering quality in assurance, advisory and tax services. Find out more
and tell us what matters to you by visiting us at www.pwc.com.
Established in the Middle East for 40 years, PwC has 22 offices across 12 countries in the region with around 5,200
people. (www.pwc.com/me).
PwC refers to the PwC network and/or one or more of its member firms, each of which is a separate legal entity. Please
see www.pwc.com/structure for further details.
© 2019 PwC. All rights reserved
CDC 1738/012019You can also read