Diversity for Security: a Study with Off-The-Shelf AntiVirus Engines
←
→
Page content transcription
If your browser does not render page correctly, please read the page content below
Diversity for Security: a Study with Off-The-Shelf AntiVirus Engines

                    Peter Bishop, Robin Bloomfield, Ilir Gashi, Vladimir Stankovic

                Centre for Software Reliability, City University London, London, UK
                            {pgb, reb, i.gashi, v.stankovic}@csr.city.ac.uk

                      Abstract                              tolerance against either malicious or non-malicious
                                                            faults.
    We have previously reported [1] the results of an           Intrusion-tolerant architectures that employ diverse
exploratory analysis of the potential gains in detection    intrusion detection systems for detecting malicious
capability from using diverse AntiVirus products. The       behaviour have been proposed in the past [4]. A more
analysis was based on 1599 malware samples                  recent publication [5] has also detailed an
collected from a distributed honeypot deployment over       implementation of an AntiVirus platform that makes
a period of 178 days. The malware samples were sent         use of diverse AntiVirus products for malware
to the signature engines of 32 different AntiVirus          detection. A similar architecture that uses diverse
products hosted by the VirusTotal service. The analysis     AntiVirus email scanners has been commercially
suggested significant gains in detection capability from    available for several years [6]. Therefore, architectural
using more than one AntiVirus product in a one-out-of-      solutions for employing diverse detection engines
two intrusion-tolerant setup. In this paper we present      (either IDS or AntiVirus products) are already known
new analysis of this dataset to explore the detection       and in some cases commercially deployed. Studies that
gains that can be achieved from using more diversity        provide empirical evaluation of the effectiveness of
(i.e. more than two AntiVirus products), how diversity      diversity for detection of malware and intrusions are,
may help to reduce the “at risk time” of a system and a     on the other hand, much more scarce.
preliminary model-fitting using the hyper-exponential           The following claim is made on the VirusTotal site
distribution.                                               [7], [8]: “Currently there is not any solution which
                                                            provides 100% detection rate for detecting viruses and
1. Introduction                                             malware”. Given these limitations of individual
                                                            AntiVirus engines, designers of security protection
   All systems, including those built from off-the-shelf    systems are interested in at least getting estimates of
components, need to be sufficiently reliable and secure     what are the possible gains in terms of added security
in delivering the service that is required of them. There   that the use of diversity (e.g. diverse AntiVirus
are various ways in which this reliability and security     products) may bring for their systems.
can be achieved in practice: use of various validation          In this paper we aim to address this research gap.
and verification techniques in the software construction    We performed an analysis of the effects of diversity
phases, issuance of patches and service releases for the    taking advantage of real-world data, namely the
product in operation, as well as the use of software        information provided by a distributed honeypot
fault/intrusion tolerance techniques. Fault tolerance       deployment, SGNET [9], [10]. We analysed 1599
techniques can range from simple “wrappers” of the          malware samples collected by the SGNET distributed
software components [2] to the use of diverse software      honeypot deployment over a period of 178 days
products in a fault-tolerant system [3]. This latter        between February and August 2008. For each malware
strategy of implementing fault tolerance was                sample, we studied the evolution of the detection
historically considered prohibitively expensive, due to     capability of the signature-based component of 32
the need for developing multiple bespoke software           different AntiVirus products and investigated the
versions. However, the wide proliferation of off-the-       impact of diversity on such a capability. Through daily
shelf software for various applications has made the        analyses of the same sample using the most up-to-date
use of software diversity an affordable option for fault    signature database available for each AV product, we
                                                            were able to study the evolution of the detection
                                                            capability over time.

                                                   -1-
Utilising this dataset, we have reported previously     section 2 details the experimental architecture used to
[1] results which analysed the detection capabilities of   collect the data; section 3 details empirical analysis of
the different AntiVirus detection engines and potential    the benefits of diversity with AntiVirus products;
improvements in detection that can be observed from        section 4 provides details of a hyper-exponential model
using two diverse AntiVirus detection engines. We          which proved to be a very good fit to the probability of
observed that some AntiVirus products achieved high        having a system with an observed zero failure rate
detection rates, but none detected all the malware         when we increase the number of AVs in a diverse
samples in our study. We also found many cases of          system; section 5 presents a discussion of the results
regression in the detection capability of the engines:     and limitations on the claims we can make about the
cases where an engine would go from detecting the          benefits of diversity; section 6 reviews two recent
malware on a given date to not detecting the same          implementations that employ diverse AntiVirus
malware at a later date. When using two diverse            engines for detecting malware or scanning malicious
detection engines we saw significant improvements in       emails and also discusses other related work; and
the detection capability.                                  finally section 7 contains conclusions and provisions
   In this paper we present new analysis of our dataset.   for further work.
We have quantified the possible gains in malware
detection from using more than two diverse engines.        2. Experimental Setup and Architecture1
We also analysed the dataset in the time dimension to
quantify the extent to which the use of diverse                The construction of meaningful benchmarks for the
AntiVirus engines reduces the “at risk time” of a          evaluation of the detection capability of different
system. Finally we observe that a hyper-exponential        AntiVirus products is an open debate in the research
model seems a very good fit for the probability of         community. Previous work [11] underlined the
observing zero-failure- rate systems as we add more        challenges in correctly defining the notion of “success”
diverse AVs.                                               in the detection of a specific malware sample. Also,
   The evaluation proposed in this paper is defined        modern AntiVirus products consist of a complex
upon a simplified view, which we consider sufficient to    architecture of different types of detection components,
the accomplishment of our goals. We do the following:      and achieve higher performance by combining together
 • We take into consideration a single type of             the output of these diverse detection techniques. Since
      component appearing in most AntiVirus products,      some of these detection techniques are also based on
      namely the signature-based detection engine.         analysing the behavioural characteristics of the
 • We perform the analysis on unambiguous                  inspected samples, it is very difficult to set up a
      malicious samples, samples that are known to be      benchmark able to fully assess the detection capability
      malicious executable files according to the          of these complex products.
      information provided by the SGNET dataset.               This work does not aim at being a comprehensive
 • We consider as a successful detection any alarm         benchmark of the detection capability of different
      message provided by the component. We do not         products to the variety of Internet threats. Instead, we
      try to diagnose the “correctness” of the generated   focus on a medium-sized sample set composed of a
      alarm message.                                       specific class of threats.
   While the resulting measures may not be                     The analyzed dataset is composed of 1599 malware
representative of the full detection capability achieved   samples collected by a real world honeypot
by the real-world operation of the various AV              deployment, SGNET [9], [10]. SGNET is a distributed
products, they provide an interesting analysis of the      honeypot deployment for the observation of server-side
detection capability of the respective signature-based     code injection attacks. Taking advantage of protocol
sub-components under the stated conditions. Also, the      learning techniques, SGNET is able to fully emulate
purpose of our study is not to rank the individual         the attack trace associated with code injection attacks
AntiVirus engines, but to analyse the benefits of          and download malware samples that spread using
diversity that a user may observe from improved            server-side exploits. By deploying many sensors in
detection rates of using more than one AntiVirus           different networks of the Internet, SGNET collects in a
product.                                                   central dataset a snapshot of the aggregated
   For the sake of brevity, in the rest of the paper we    observations of all its sensors. We use this data as
will use the short-hand notation AV to refer to the        input to our analysis and we build our analysis upon a
signature-based component of an AntiVirus detection
                                                           1
engine.                                                      This section is similar to section II written in [1]. It is given
   The rest of this paper is organised as follows:         here to help the reader follow the analysis of the results that
                                                           succeeds this section.

                                                  -2-
limited, but realistic dataset with respect to the modern run successfully when executed against a Windows
trends for a specific class of malware (i.e. malware operating system.
associated with code injection attacks). Thirdly, the malware samples are differentiated
The SGNET information enrichment framework based solely on their content. Thus, the frequent usage
[11] enriches the information collected by the of polymorphic techniques (an example of which is
deployment with additional data sources. Two sources given in [14]) in malware propagation is likely to bias
are relevant to this work: the behavioural information the number of malware samples collected. Through
provided by Anubis2 [12], [13] and the detection polymorphism, a malware modifies its content at every
capability information provided by VirusTotal [7]. propagation attempt: two instances of the same
Every malware sample collected by the deployment malware thus appear as different when looking solely
is automatically submitted to Anubis to obtain at their content.
information of its behaviour once executed on a real Finally, interdependence exists between the
Windows system. This information is useful to filter submission of a sample to VirusTotal and the observed
out corrupted samples collected by the deployment, detection capability. The VirusTotal service actively
which would not be executable on a real system. Such contributes to the AntiVirus community by sharing
samples proved to be the cause of ambiguities in the with all the vendors all the submitted samples resulting
detection capability [11]: it is unclear whether such in improved detection rates across different AV
corrupted samples should or should not be detected engines.
since different engines often follow contradicting
policies. 3. Exploratory Analysis of AV Diversity
The foundations of our analysis are derived from
the interaction of SGNET with the VirusTotal service. We use the dataset introduced in the previous
VirusTotal is a web service that allows the analysis of section to perform a detection capability analysis of 32
a given malware sample by the signature-based engines different AVs when subjected with the 1599 malware
of different AntiVirus vendors3. All the engines are samples collected by the SGNET deployment.
kept up-to-date with the latest version of the signatures. Exploiting the submission policy implemented in the
Thus, a submission of a malware sample to VirusTotal SGNET dataset, we have considered for each sample
at a given point in time provides a snapshot on the the submissions performed on the 30 days succeeding
ability of the different signature-based engines to its download. The input to our analysis can thus be
correctly identify a threat in such samples. It is considered as a series of triplets associating together a
important to stress that the detection capability certain malware sample, an AV product and the
evaluation is performed on a subset of the identifier of the submission day with respect to the
functionalities of the detection solutions provided by download date {Malwarei, AVj, Dayk}. For each of
the different vendors. these triplets we have defined a binary score: 0 in case
Every time a sample is collected by the SGNET of successful detection, 1 in case of failure. Table 1
deployment it is automatically submitted for analysis shows the aggregated counts of the 0s and 1s for the
to VirusTotal, and the corresponding result is stored whole period. As previously explained, we have
within the SGNET dataset. To get information on the considered as success the generation of an alert
evolution of the detection capability of the engines, regardless of the nature of the alert itself.
each sample, for this dataset, is resubmitted on a daily For a number of technical reasons in the interaction
basis for a period of 30 days. of the SGNET dataset and VirusTotal a given malware
The dataset generated by the SGNET interaction and an AV are not always associated to 30 triplets. In
has some important characteristics that need to be the observation period we have some missing data
taken into account in the following detection capability since some AVs have not been queried on a given day.
evaluation.
Firstly, all the malware taken into consideration Table 1 - The counts of successful detections
have been pushed to the victim as a consequence of a and failures for triplets {Malwarei, AVj, Dayk}
successful hijack of its control flow. We can thus Value Count
safely consider that all the analyzed samples are a 0 – no failure / detection 1,093,977
result of a malicious and unsolicited activity.
1 – failure / no detection 143,031
Secondly, all the considered samples are valid
Windows Portable Executable files. All these samples
2
http://anubis.iseclab.org/
3
In our study we evaluated the outputs of 32 AVs.
-3-3.1 Summary of Single AV Results improvements in detection capability through the use
of diversity will of course be higher if you have such
Table 2 lists the top 10 performing AVs4 ranked by poorly performing individual AVs in the mix. By
their observed failure (non-detection) rates5. The removing them we make our estimates of the benefits
difference between the failure rate values in the second of diversity more conservative.
column and in the fourth column is dependent on the Table 3 – Counts of single AVs per failure rate
definition of a unique “demand”. For the failure rates band.
calculated in the second column, a unique demand is a Count (and % of the
Failure rate (f.r.)
{Malwarei, Dayk} pair, i.e. each malware sent on a total) of single AVs
failure rate = 0 0 (0%)
different day is treated as unique. Hence the maximum 1.0E-05 ≤ f. r.obtained using the combinatorial formula nCr. For left (i.e. towards the 0 failure rate) for configurations
example, the total number of 1-out-of-2 (1oo2) systems with higher level of diversity.
that you can create from 26 different AVs is 26C2 = Figure 2, shows the cumulative distribution function
325, and so on. For each of these distinct systems we (cdf) of the average failure rate for each configuration.
calculate the average failure rate for all instances of This graph helps us visualise the net average gain in
malware sent to them. The table only goes as far as 1- detection capability at each failure rate band when
out-of-15 because we had no single demand that adding extra layers of diversity (i.e. additional diverse
caused 15 different AVs to fail simultaneously. Hence AVs).
from 1oo15 onwards we observe perfect detection with Cumulative proportion of systems on each failure rate
our dataset. band for each configuration
100.0%
The first column of the results (f.r. = 0) shows the
numbers of systems of each configuration that 90.0%
1-v
Proportion of systems within a configuration
perfectly detected all the malware on all the dates that 80.0% 1oo2
1oo3
they inspected them. We had no single AV that was in 70.0% 1oo4
this category (as evidenced in Table 3), but this 60.0%
1oo5
1oo6
number grows substantially as the number of AVs in a 1oo7
50.0%
diverse configuration increases (you can see its 1oo8
1oo9
proportional growth to all the systems in a particular 40.0%
1oo10
configuration on the right-most column of the table). 30.0% 1oo11
The second column (1.0E-05 ≤ f. r. < 1.0E-04) shows 20.0%
1oo12
1oo13
the number of systems whose average failure rate for 1oo14
all instances of malware is between 10-4 and 10-5. The
10.0%
worst case failure rate band for any diverse setup is 10- 0.0%
0 0.00001 - 0.0001 - 0.001 - 0.01 0.01 - 0.1 0.1 - 1
2
and 10-3. In Table 3 we saw that the worst case failure 0.0001 0.001 Failure rate bands
rate band, even after filtering away the 6 worst single Fig. 2 – Cumulative proportions of systems in
AVs, for any single AV is 10-1 and 10-2. Hence, for this each failure rate band for each configuration
dataset, we can interpret this result as “the worst
diverse configuration brings an order of magnitude 3.3. “Diversity over Time” Analysis
improvement over the worst single AV product”.
As we stated before, each malware sample was sent
3.2.2 Visualisation of the Results to a given AV product on several consecutive days
after it was first uncovered in the SGNET honeypots.
In this sub-section we will show some graphs to This period was a maximum of 30 days in our dataset.
help us visualise and better interpret the data in Table 4 By their very nature signature-based AVs should
(the 1oo15 results are not shown on the graphs since eventually detect all the malware, provided the vendors
there are no failures for this configuration). write the appropriate signatures to detect them.
Figure 1 directly visualises the numbers shown in However the response time for writing these signatures
Table 4. can differ significantly. Hence we analysed to what
Number of systems on each failure rate band for each extent the use of diverse AVs may help a system
configuration 1-v
100000000 1oo2
reduce its “time at risk”, i.e. the time in which an AV is
10000000 1oo3 exposed to a known malware for which a signature is
1oo4 yet to be defined by a given AV. By using more than
Number of systems within a
1000000
1oo5
1oo6
one AV the system is only exposed for the time it takes
100000
configuration
1oo7 the fastest of the vendors to define the signature.
10000
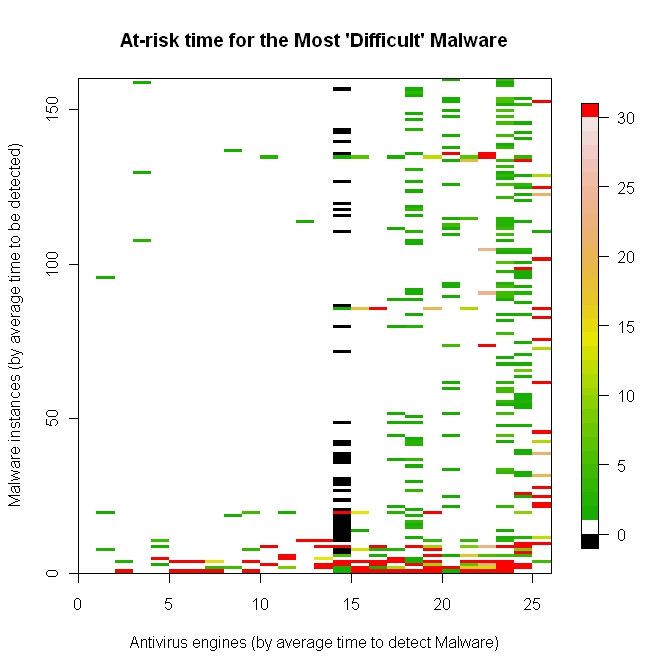
1oo8 Figure 3 contains contour plot of the entire dataset
1000 1oo9
of the 26 AVs in our study. The x-axis lists the 26 AVs
1oo10
100
1oo11
ordered from left to right (the highest detection rate to
10 1oo12 the one with the lowest). The y-axis contains a listing
1
1oo13 of all 1599 malware. The z-axis values are given by the
1oo14
0 0.00001 -
0.0001
0.0001 - 0.001 0.001 - 0.01
Failure rate band
0.01 - 0.1 0.1 - 1
intensity of the colour on the plot, which is given by
Fig. 1 – Number of systems in each failure rate the legend on the side of the plot. The black coloured
band for each configuration lines are associated with malware that were never seen
Note that the y-axis is shown in an exponential by a given AV (i.e. the missing data): in our dataset
scale. We can clearly observe the shift of mass to the these are associated with just one AV product. The
-5-white lines are associated with malware which were the minimum time it takes any of the diverse AVs
always detected by given AV product. The values 1-30 employed to detect the malware.
in the z-axis, represented by colours ranging from
intense green to light pink, are associated with the
number of days that a given AV failed to detect a given
malware in our study, but which eventually were
detected. The red lines represent the malware which, in
our collection period, were never detected by a given
AV product.
The graph shows clear evidence of diversity, which
explains the results we have observed so far.
Fig. 4 – The “at risk time” in number of days
for each of the 26 AVs when considering the
160 most “difficult” Malware samples.
Another viewpoint of the time dimension analysis is
given in Figure 5. For each AV we looked at the time
(in number of days) it took it to detect a given malware
sample. To make the graph more readable we
categorised these times into: always detected (shown
Fig. 3 – The “at risk time” in number of days on the bars filled in white colour with black borders),
for each of the 26 AVs on each of the 1599 never detected (shown in red fill colour), no data (in
malware samples in our dataset black fill colour), and then 5 day groupings (1-5 days,
We now look in more detail at the most “difficult” 6-10 days etc.). Each bar shows the proportion of
10% of malware (i.e. the ones which were most often malware that are in any of these categories. We are
missed overall by the AV products). This is shown in only showing the top 45% in the y-axis, as all AVs
Figure 4. Note that this not a zoom of the top-most 10 always detected at least 55% of all the malware
% of the Figure 3, because the ordering is done over samples sent to them.
the malware. The ordering is bottom-to-top from the Figure 5 allows us to look more clearly at the
most difficult to detect to the least difficult (within this empirical distribution of the time it takes each AV to
10% of malware). detect the malware samples in our study. Along the x-
If we look at the graph along the x-axis it is clear axis the AVs are ordered left-to-right from the AV with
again that there are infrequent cases of a line (i.e. a the lowest time at risk (AV-7) to the highest (AV-5).
particular malware) running across the different AVs The distribution of detection times may have a
with the same colour. This is evidence that even for bearing on the choice of AVs that a given user may
malware which on average the different AVs are wish to make for a given system. Rather than choosing
finding difficult to detect, there is considerable the “best on average”, users may choose the AVs that
variation on which ones they find difficult (i.e. a do not have too many undetected malware (shown in
malware which an AV finds difficult another one does red colour in the bars of the graph in Figure 5). For
not, and vice versa) and when they do fail, their at risk example, even though AV-23 has a better (shorter)
time does vary. Hence it is clear that using diverse average “at risk time” than AV-18, it is evident from
AVs, even in cases when different AVs fail to detect Figure 5 that AV-18 has a shorter red coloured section
the malware, can have an impact in reducing the “at of the bar compared with AV18. This means AV-18
risk time” of a system: the time the system is at risk is failed to detect, in our study, a smaller number of
-6-malware than AV-23, even though its total at risk time where p is the probability that a single AV fails to
was worse (higher). detect all the malware.
From the viewpoint of diversity analysis, the choice In practice this proved to be a very poor fit to the
of which set of AVs to choose is therefore not only observed proportions. However an empirically derived
influenced by the highest detection rates (diversity in hyper-exponential model of the form:
“space”) but also the time it takes the different AVs to
detect malware (diversity in “time”). Different AV P(faulty | N) = (pN) N/2
vendors may have different policies on deciding which
malware they prioritise for a signature definition. proved to be a remarkably good fit to the observed
Therefore the needs of an individual end-user for data as shown in the Figure 6 below.
whom a definition of a signature for a particular
malware sample is of high importance, may mismatch Effect of increasing diversity by adding
with the AV vendor’s prioritisation of that malware. So 1.E+00
AVs
use of diverse AVs helps avoid this “vendor lock-in”. 1.E-01
Selection of diverse AVs to optimise the diversity in
Prob. 1ooN system fails
on at least one demand
time aspect requires we choose AVs from vendors that 1.E-02
exhibit diverse policies at prioritising signature 1.E-03
definitions for different malware.
1.E-04
"At-risk" time distribution for single AVs
100% 1.E-05
95% 1.E-06
Proportion of malware at each "at-risk" time category
90% 1.E-07
0 2 4 6 8 10 12 14 16
85%
Number of diverse AVs (N)
Observed Exponential Hyper-exponential
80%
Fig. 6 – Effect of increasing diversity by
75%
adding AVs
70%
The results show that the proportion of faulty
systems decreases far more rapidly than a simple
65% exponential distribution would indicate. For example,
increasing N from 8 to 10 decreases the chance of
60%
having a 1ooN system that fails by an order of
55% magnitude.
AV-7
AV-16
AV-17
AV-32
AV-26
AV-2
AV-6
AV-30
AV-22
AV-21
AV-31
AV-19
AV-23
AV-15
AV-28
AV-9
AV-14
AV-11
AV-18
AV-25
AV-10
AV-1
AV-4
AV-20
AV-8
AV-5
AV products (by average at-risk time) 5. Discussion
No failure 1-5 days non-detected 6-10 days non-detected
11-15 days non-detected 16-20 days non-detected 21-25 days non-detected
26-30 days non-detected Never detected No data
Fig. 5 – “At risk time” distribution for single 5.1 Confidence on the Best Case Observed
AVs Failure Rate
Any claim on the best case (i.e. lowest) failure rate
4. A Hyper-Exponential Model for the we can hope for, using this dataset, will be in the
Reduction of Systems that Fail When region of 10-4 to 10-5. This is because we have a
Adding Diversity maximum of 47,970 demands sent to any given AV (as
we explained earlier). This is the upper bound on the
An interesting characteristic of the data shown in observed failure rate. To make claims about lower
Table 4 is the asymptotic reduction in the proportion of failure rates (i.e. smaller than 10-5) we need more data
systems that fail on any of the malware. A simple – or, in other words, we must do more testing. The
exponential model of the decrease with the number of theoretical background behind these intuitive results is
AVs (N) in the diverse system would estimate the given in [15]6.
proportion as:
P(faulty | N) = pN
6
Section 3 of [15] contains a discussion of the limits on
claims we can make about reliability when statistical testing
-7-But the fact that we are seeing only, for instance, 5 Gumbel distribution. This is an area that requires more
out of almost 10 million different combinations of investigation.
1oo14 systems fail on this dataset is telling us If the hyper-exponential distribution is shown to be
something about the improvements in detection rates generic, it would be a useful means for predicting the
from using diversity (cf. Table 4), even if we cannot expected detection rates for a large 1ooN AV system
claim a failure rate lower than 10-5. We may interpret based on measurements made with simpler 1oo2 or
the 0.999999 proportion of 1oo14 systems with a 1oo3 configurations.
perfect failure rate as a 99.9999% confidence we have
in the claim that, for this dataset, “the average failure 6. Related Work
rate of a 1oo14 diverse AV system constructed from
randomly selecting 14 AVs from a pool of 26 AV 6.1 Architectures that Utilise Diverse
products, will be no worse than ~ 4.7 * 10-5”. This AntiVirus Products
may or may not persuade a given system administrator
to take on the additional cost of buying this extra In this paper we have presented the potential gains
security: this will clearly depend on their particular in detection capability that can be achieved by using
requirements. But in some cases, especially regulated diverse AVs. Security professionals may be interested
industries, there may be a legal requirement to show in the architectures that enable the use of diverse AV
actually achieved failure rates with a given level of products.
confidence. It may not be feasible to demonstrate those The following publication [5] has provided an
failure rates with the associated confidence for single initial implementation of an architecture called Cloud-
AV products without extensive testing. AV, which utilises multiple diverse AntiVirus
The claim above is limited by the level of diversity products. The Cloud-AV architecture is based on the
we can expect between various diverse configurations. client-server paradigm. Each host machine in a
We “only” have 26 AV products (even though this may network runs a host service which monitors the host
represent a large chunk of the available commercial and forwards suspicious files to a centralised network
solutions available). Hence, for instance, even though service. This centralised service uses a set of diverse
we have over 65,000 different combinations of 1oo5 AntiVirus products to examine the file, and based on
systems using 26 AVs, the level of diversity that exists the adopted security policy makes a decision regarding
between these different 1oo5 systems may be limited maliciousness of the file. This decision is then
in some cases. For example, a 1oo5 system which forwarded to the host. To improve performance, the
consists of AV1, AV2, AV3, AV4 and AV5, is not that host service adds the decision to its local repository of
much different from a 1oo5 system consisting of AV1, previously analysed files. Hence, subsequent
AV2, AV3, AV4 and AV6. Hence care must be taken encounters of the same file by the host will be decided
from generalising the level of confidence from these locally. The implementation detailed in [5] handles
large numbers without considerations of these subtle executable files only. A study with a deployment of the
concepts on the sample space of possible systems. Cloud-AV implementation in a university network
over a six month period is given in [5]. For the
5.2 Discussion of the Hyper-Exponential Model executable files observed in the study, the network
overhead and the time needed for an AntiVirus engine
There is no immediate explanation for the to make a decision are relatively low. This is because
surprisingly good fit of the 1ooN system detection the processes running on the local host, during the
capability to the hyper-exponential model, but we observation period, could make a decision on the
suspect it is related to the Central Limit Theorem maliciousness of the file in more than 99% of the cases
where individual variations are smoothed out to that they had to examine a file. The authors
produce a normal distribution (for a sum of acknowledge that the performance penalties might be
distributions), or a log-normal distribution (for the significantly higher if the types of files that are
product of distributions). In our case, the hyper- examined increases as well as if the number of new
exponential distribution could be intermediate between files that are observed on the host is high (since the
these two extremes. Furthermore, it might be that the host will need to forward the files for examination to
asymptotic nature of exceedances and extreme values the network service more often).
can be used to justify a general hyper exponential or Another implementation [6] is a commercial
solution for e-mail scanning which utilises diverse
AntiVirus engines.
reveals no failures. Both classical and Bayesian inference
methods are described.
-8-6.2. Other Related Empirical Work with AV • Considerable improvements in detection rates can
Products be gained from employing diverse AVs;
• No single AV product detected all the malware in
Empirical analyses of the benefits of diversity with our study, but almost 25% of all the diverse pairs,
diverse AV products are scarce. CloudAV [5] and our and over 50% of all triplets successfully detected
previous paper [1] are the only examples we know of all the malware;
published research. • In our dataset, no malware causes more than 14
Studies which perform analysis of the detection different AVs to fail on any given date. Hence we
capabilities and rank various AV products are, on the get perfect detection rates, with this dataset, by
other hand, much more common. A recent publication using 15 diverse AVs;
[8] reports results on ranking of several AV products • We observe a law of diminishing returns in the
and also contains an interesting analysis of “at risk proportion of systems that successfully detect all
time” for single AV products. Several other sites7 also the malware as we move from 1-out-of-8 diverse
report rankings and comparisons of AV products, configurations to more diverse configurations;
though one must be careful to look at the criteria used • Significant potential gains in reducing the “at risk
for comparison and what exactly was the “system time” of a system from employing diverse AVs:
under test” to compare the results of different reports. even in cases where AVs fail to detect a malware,
there is diversity in the time it takes different
7. Conclusions vendors to successfully define a signature for the
malware and detect it;
The analysis proposed in this work is an assessment • The analysis of “at risk time” is a novel
of the practical impacts of the application of diversity contribution compared with traditional analysis of
in a real world scenario based on realistic data benefits of diversity for reliability: analysis and
generated by a distributed honeypot deployment. As modelling of diversity has usually been in terms of
shown in [11], the comprehensive performance demands (i.e. in space) and the time dimension was
evaluation of AntiVirus engines is an extremely not usually considered;
challenging, if not impossible, problem. This work • An empirically derived hyper-exponential model
does not aim at providing a solution to this challenge, proved to be a remarkably good fit to the
but builds upon it to clearly define the limits of validity proportion of systems in each diverse setup that had
of its measurements. a zero failure rate. We plan to do further analysis
The performance analysis of the signature-based with new datasets and if the hyper-exponential
components showed a considerable variability in their distribution is shown to be generic, it would be a
ability to correctly detect the samples considered in the useful means for predicting the expected detection
dataset. Also, despite the generally high detection rate rates for a large 1ooN AV system based on
of the detection engines, none of them achieved 100% measurements made with simpler 1oo2 or 1oo3
detection rate. The detection failures were both due to configurations.
the lack of knowledge of a given malware at the time There are several provisions for further work:
in which the samples were first detected, but also due • As we stated in the introduction, there are many
to regressions in the ability to detect previously known difficulties with constructing meaningful
samples as a consequence, possibly, of the deletion of benchmarks for the evaluation of the detection
some signatures. capability of different AntiVirus products (see [11]
The diverse performance of the detectors justified for a more elaborate discussion). Modern AntiVirus
the exploitation of diversity to improve the detection products comprise a complex architecture of
performance. We calculated the failure rates of all the different types of detection components, and
possible diverse systems in various 1-out-of-n (with n achieve higher detection capability by combining
between 2 and 26) setups that can be obtained from the together the output of these diverse detection
best 26 individual AVs in our dataset (we discarded the techniques. Since some of these detection
bottom 6 AVs from our initial set of 32 AV products, techniques are also based on analysing the
as they exhibited extremely poor detection capability). behavioural characteristics of the inspected
The main results can be summarised as follows: samples, it is very difficult to setup a benchmark
capable to fully assess the detection capability of
these complex components. In our study we have
7 concentrated on one specific part of these products,
http://av-comparatives.org/, http://av-test.org/, namely their signature-based detection engine.
http://www.virusbtn.com/index
-9-Further studies are needed to test the detection 2. van der Meulen, M.J.P., et al. Protective Wrapping
capabilities of these products in full, including their of Off-the-Shelf Components. in the 4th Int. Conf.
sensitivities to false positives (whatever the on COTS-Based Software Systems (ICCBSS).
definition of a false positive may be for a given Bilbao, Spain, p. 168-177, 2005.
setup); 3. Strigini, L., Fault Tolerance Against Design
• Studying the detection capability with different Faults, in Dependable Computing Systems:
categories of malicious files. In our study we have Paradigms, Performance Issues, and Applications,
concentrated on malicious executable files only. H. Diab and A. Zomaya, Editors, J. Wiley & Sons.
Further studies are needed to check the detection p. 213-241, 2005.
capability for other types of files e.g. document 4. Reynolds, J., et al. The Design and Implementation
files, media files etc; of an Intrusion Tolerant System. in 32nd IEEE Int.
• Analysis of the benefits of diversity for “majority Conf. on Dependable Systems and Networks
voting” setups, such as 2oo3 (“two-out-of-three”) (DSN). Washington, D.C., USA, p. 285-292, 2002.
diverse configurations for example. Since our 5. Oberheide, J., E. Cooke, and F. Jahanian.
dataset contained confirmed malware samples, we CloudAV: N-Version Antivirus in the Network
thought detection capability is the most appropriate Cloud. in Proc. of the 17th USENIX Security
aspect to study: a system should prevent a malware Symposium, p. 91–106, 2008.
from executing if at least one AV has detected it as 6. GFi. GFiMailDefence Suite, last checked 2011,
being malicious (hence our emphasis on 1-out-of-n http://www.gfi.com/maildefense/.
setups). But in cases where false positives become 7. VirusTotal. VirusTotal - A Service for Analysing
an issue, using majority voting may help curtail the Suspicious Files, last checked 2011,
false positive rate; http://www.virustotal.com/sobre.html.
• More extensive exploratory modelling and 8. Sukwong, O., H.S. Kim, and J.C. Hoe, Commercial
modelling for prediction. The results with the Antivirus Software Effectiveness: An Empirical
hyper-exponential distribution were a pleasant Study. IEEE Computer, 2011. 44(3): p. 63-70.
surprise, but more extensive analysis with new 9. Leita, C. and M. Dacier. SGNET: Implementation
datasets is required to make more general Insights. in IEEE/IFIP Network Operations and
conclusions. Extensions of current methods for Management Symposium (NOMS). Salvador da
modelling diversity to incorporate the time Bahia, Brazil, p. 1075-1078, 2008.
dimension are also needed. 10. Leita, C., et al. Large Scale Malware Collection:
Lessons Learned. in Workshop on Sharing Field
Acknowledgments Data and Experiment Measurements on Resilience
of Distributed Computing Systems, 27th Int. Symp.
This work has been supported by the European on Reliable Distributed Systems (SRDS). Napoli,
Union FP 6 via the "Resilience for Survivability in Italy, 2008.
Information Society Technologies" (ReSIST) Network 11. Leita, C., SGNET: Automated Protocol Learning
of Excellence (contract IST-4-026764-NOE), FP 7 via for the Observation of Malicious Threats, in
the project FP7-ICT-216026-WOMBAT, and a City Institute EURECOM. 2008, University of Nice:
University Strategic Development Fund grant. Nice, France.
The initial research [1] on these results was done in 12. Bayer, U., TTAnalyze: A Tool for Analyzing
collaboration with Corrado Leita and Olivier Malware, in Information Systems Institute. 2005,
Thonnard, who are now with Symantec Research. Technical University of Vienna: Vienna, Austria.
We would like to thank our colleagues at CSR for p. 86.
fruitful discussions of the research presented, and 13. Bayer, U., et al., Dynamic Analysis of Malicious
especially Robert Stroud who reviewed an earlier Code. Journal in Computer Virology, 2006. 2(1): p.
version of this paper. 67–77.
14. F-Secure. Malware Information Pages: Allaple.A,
last checked 03 June 2011, http://www.f-
References secure.com/v-descs/allaple_a.shtml.
15. Littlewood, B. and L. Strigini, Validation of
1. Gashi, I., et al. An Experimental Study of Diversity ultrahigh dependability for software-based
with Off-the-Shelf AntiVirus Engines. in systems. Commun. ACM, 1993. 36(11): p. 69-80.
Proceedings of the 8th IEEE Int. Symp. on Network
Computing and Applications (NCA), p. 4-11, 2009.
- 10 -You can also read