Eclipx Group Limited 1H18 Results Presentation - 8 May 2018 - Open Briefing

Page created by Nathaniel Frazier
 
CONTINUE READING
Eclipx Group Limited 1H18 Results Presentation - 8 May 2018 - Open Briefing
Eclipx Group Limited
1H18 Results Presentation
8 May 2018

Doc Klotz
Chief Executive Officer and Managing Director
Garry McLennan
Deputy Chief Executive Officer and Chief Financial Officer
Eclipx Group Limited 1H18 Results Presentation - 8 May 2018 - Open Briefing
Agenda

         1. Highlights and guidance

         2. Core competencies

         3. Financial results and business performance

         4. Strategies for delivering sustainable growth

         5. Summary

         6. Appendices

                                                           2
Eclipx Group Limited 1H18 Results Presentation - 8 May 2018 - Open Briefing
01

 Highlights
 and guidance

                3
Eclipx Group Limited 1H18 Results Presentation - 8 May 2018 - Open Briefing
Key Messages

           Since IPO, Eclipx has transitioned into an integrated and rapidly growing asset services company
       1   generating multiple revenue streams across the asset and customer life cycles.

           GraysOnline and Right2Drive are service based businesses which broaden and improve our
       2   customer value proposition, enhance our earnings and provide a platform for further market share
           gains and strong organic growth.

           Eclipx has a proven track record of leveraging its core competencies including risk management,
       3
           treasury and digital technology to provide innovative solutions to customers. Eclipx is well placed to
           continue the delivery of profitable growth, strong free cash flow and is focused on driving superior
           returns to shareholders.

           Following delivery of 1H18 NPATA of $38.5m, Eclipx reaffirms its FY18 guidance of 27-30% growth
       4   in NPATA.

                                                                                                                    4
Eclipx Group Limited 1H18 Results Presentation - 8 May 2018 - Open Briefing
1H18 Results Highlights

      GraysOnline, Right2Drive and continued strong performance in Fleet headline 1H18 results

                                                                                                                                                      1H18 PERFORMANCE
     AUD million (unless stated)                                              1H17                        1H18            Growth pcp
                                                                                                                                                      • 23% growth in NPATA to $38.5m; 39% increase in Net Operating Income
     Net Operating Income (NOI)                                               114.9                       159.3                         39%           • Growth in Fleet NPATA to $25.9m as we continue to take market share

                                                                                                                                                      • Grays delivers $5.9m NPATA, on track to deliver $14.0-15.4m in FY18
     NPATA1                                                                     31.2                        38.5                        23%
                                                                                                                                                      • 30% increase in Right2Drive NPATA to $4.2m - 39% growth in hires from 35
                                                                                                                                                        branches now in operation
     AUMOF2          (closing)                                                2,113                       2,330                         10%
                                                                                                                                                      • $3.4m (pre-tax) start-up and ramp-up costs expensed in 1H18 NPATA

     R2D Hire volume (units)                                                14,249                      19,830                          39%                     • NZ SME equipment/vehicle start-up ($2.0m)

                                                                                                                                                                • Investment in additional R2D branches ($1.4m)
     Grays sales volume3                                                         237                         267                        13%           • ECX acquired areyouselling.com.au, used car trade-in platform in Dec17

                                                                                                                                                      • Continued investment in technology including new customer portals, online
     New Business Writings (NBW)4                                                458                         501                          9%            delivery and integrated vehicle & equipment platforms
                                                                                                                                                      • 10%-12% forecast Cash EPS growth for FY18 including its first full year
     Cash EPS5 (cents)                                                          11.8                        12.3                          4%            contribution from Grays
                                                                                                                                                      • Fully franked interim dividend of 8c per share
     Dividend per share (cents)                                                 7.50                        8.00                          7%

1.   NPATA is net profit after tax and tax adjusted add back of amortisation of intangibles
2.   AUMOF is assets under management or financed, includes balance sheet and principal and agency (P&A) funded assets                                                                                             5
3.   Grays 1H17 sales volumes in 1H17 have been provided for Grays Industrial and Auto on a pro-forma basis as Grays was acquired on 11 August 2017
4.   NBW excludes sale and leaseback agreements totaling $8.7m in 1H17 and $1.3m in 1H18
5.   Cash EPS is defined as each period's NPATA divided by the total weighted number of ordinary shares on issue for that period.
ECX Guidance reaffirmed

   FY18 guidance of 27-30% increase in NPATA

§ Continued earnings momentum into 2H18 in line with 27-30% NPATA growth for FY18 vs pcp

§ 10%-12% forecast Cash EPS growth for FY18 vs pcp

§ High single digit asset growth in Fleet (AU and NZ) - stable NPATA margins - EOL income expected to remain at current profit per vehicle

§ Grays to benefit from solid industrial pipeline, continued significant growth in Auto platform with more active auction period in March-Nov

§ All time record Right2Drive hires achieved in March providing a strong growth trajectory into 2H18

§ Expect continued positive economic conditions in Australia and New Zealand
     ü Australia benefiting from significant infrastructure spend on the east coast

                                                                                                                                        6
Eclipx is a Diversified Asset Services Business
Integrated asset services driving growth, high returns and strong free cash flow

                                                                        Fleet                                                              Diversified Asset                                               High growth adjacencies

                                                                                                                             Consumer car                             Commercial                          Medium               Vehicle & commercial
                                                                                        Novated
                                             Fleet leasing                                                                    buying and                              equipment                        term car rental          equipment trading
                                                                                         leases
                                                                                                                               finance                                  finance                     accident replacement             platform

     Addressable                                 $4bn                                    $2bn                                    $15bn                                   $12bn                       $550-$700m revenue                  $7bn
     market size                               NBW p.a.1                               NBW p.a.2                                NBW p.a.3                               NBW p.a.4                           p.a.5                     sales p.a.5

 Assets financed

                                    •   Operating Lease                      • Novated Lease                         • Consumer vehicle loans                 • Operating Lease                    • Accident replacement     • Industrial auctions
                                    •   Finance Lease                        • Value-added services                  • Car-buying services                    • Finance Lease                        vehicles                 • Vehicle auctions
 Product offering
                                    •   Fleet Management                     • Telematics/FBT                                                                                                      • Vehicle hire             • Wine auctions
                                    •   Telematics/FBT

                                    •   Direct sales                         •   Direct sales                        •   Online digital channels              • Direct sales /                     • Growing branch network   • Online digital channels
         Eclipx                     •   Distribution partnerships            •   Distribution partnerships           •   SMEs                                   relationships                      • Referral network
      distribution                  •   Co-branding                          •   Co-branding                         •   Corporates                           • Broker networks
       channels                     •   Online digital channels              •   Online digital channels             •   Government                           • Online digital channels

         Brands

1.   Excludes novated leases and non-funded fleet. Sourced from Australian Fleet Lessors Association (AFLA) and management estimates for New Zealand market and non-AFLA reporting fleet lessors
2.   Sourced from AFLA and management estimates                                                                                                                                                                                             7
3.   Sourced from Australian Bureau of Statistics (ABS), 5671.4 – Lending Finance, Australia (Table 4)
4.   Commercial equipment leasing addressable market size for equipment types targeted by Eclipx Commercial. Sourced from Australian Equipment Lessors Association (AELA)
5.   Management estimates
Multiple income streams across the asset and customer life cycle

                             1H18 Net Operating   1H18 Net Operating
                                                                       Income sources                  Key business drivers
                                Income ($m)          Income (%)

                                                                       • Upfront fees
     Sale and purchase of         $10.2m                 6%                                            • New business written ($)
                                                                       • Retail margin
           vehicles

                                                                                                       • Balance sheet financed leases
                                  $19.7m                 12%           • Net interest income
                                                                                                       • Net interest margins (%)
          Financing
                                                                       •   Management fees
                                                                       •   Maintenance fees            • Operating lease fleet (units)
                                  $51.6m                 33%
      Vehicle (incl fleet)                                             •   Telematics                  • New business written ($)
        Management                                                     •   3rd party brokerage

                                                                                                       • Hire volume (units)
                                  $21.1m                 13%           • Right2Drive car hire          • Days on hire (units)
          Car Rental                                                                                   • NOI per hire ($)

                                                                       • End of lease proceeds
                                                                                                       • End of lease volume (units)
                                  $17.5m                 11%           • Transportation and sales
                                                                                                       • Profit per vehicle ($)
      End of Lease Profit                                                preparation costs

                                                                       • Online auction fees
                                                                                                       • Auction value ($)
                                  $39.2m                 25%           • Asset valuations and audits
     Online Auction Fees                                                                               • Auction margin (%)
                                                                       • Insolvency services

                                   $159.3               100%

                                                                                                                                         8
02

 Core competencies

                     9
Core competency - Risk management

ECX has consistently grown volume and delivered end of lease (EOL) profits while maintaining a conservative risk setting

                                                                                                                                                                      …an 8% CAGR in fleet NBW with consistent and
    1         Significant end of lease initiatives drives yield                                                                                             2         conservative RV settings

•   Extensive proprietary vehicle sale data and technology enable objective                                                                                                            Operating lease
                                                                                                                                                                                          Operating    NBWNBW
                                                                                                                                                                                                    Leases andand
                                                                                                                                                                                                               RVRV
                                                                                                                                                                                                                  (%)(%
                                                                                                                                                                                                                      1,2
                                                                                                                                                                                                                         )
    conservative formulaic residual value setting
                                                                                                                                                                               38%                  39%                40%             40%
•   ECX accounting policies impair any vehicles where projected EOL values
    (based on latest data) are below set Residual Values – stability in EOL
    earnings - embedded vehicle disposal profits only recognized on sale

•   Conservative approach to impairment on a vehicle by vehicle basis without                                                                                                                                                          299
    netting of losses against profitable vehicles                                                                                                                                                                      272
                                                                                                                                                                                                      243
•   Increased EOL distribution channels including Grays increase EOL revenue                                                                                                     236

•   ECX data & technology platform – vehicles sold where returns are maximised                                                                                                1H15                  1H16               1H17            1H18

                                                                                                                                                                      …with future EOL profits underpinned by over 50,000
    3         …has led to sustainable end of lease profits                                                                                                  4         vehicles coming off lease 3-4 years post origination

                                                                                                                                                                        Operating Leases Written (units) by Yr of Origination
                                      End
                                      Endof
                                          ofLease
                                            Lease profit
                                                  Profitper
                                                         pervehicle
                                                             lease                                                                                                    Operating leases written (units) by year of origination

                                                                           2,991                      2,990                                                                                       CAGR +12%                   15,318
                                                                                                                                                                                                              14,390
                                                                                                                                                                                             13,677
                                               2,396
                   2,057
                                                                                                                                                                          10,801

                   1H15                        1H16                       1H17                        1H18
                                                                                                                                                                          FY14               FY15             FY16            FY17
                                                                                                                                                                                                                                              10
1. ECX RV (%) has been calculated by dividing the residual value at the time of origination by the vehicles recommended retail price (RRP), for vehicles financed in the FPAU warehouse
2. Operating lease NBW reported in this chart exclude Fleet originated finance leases in the Australian and New Zealand fleet businesses
Core competency - Treasury and funding

ECX has a conservative and diversified financing model delivering competitive funding costs with growth headroom

                                                                                                                                                            Treasury hedging strategies lower funding costs despite
  1   Strong asset growth1 and stable interest margins                                                                                            2         increasing swap rates
            Sustained	
  asset	
  growth	
  whilst	
  maintaining	
  interest	
  
                                      margins
                                                                                                                                                                      ECX	
   has	
   reduced	
  its	
  cost	
  of	
   funds	
   despite	
  
                                                                                                       2.60%
              2.67%                       2.57%
                                                                       2.46%                                                                                        5.12%              increases	
  in	
   swap	
   rates
                                                                                                                                                                                           4.85%
                                                                                                                                                                                                                          4.72%
                                                                                                                                                                                                                                               4.50%

                                                                                                                                                                                           2.40%                          2.48%                2.43%
                                                                                                                                                                    1.91%

               1,278	
                     1,385	
                      1,459	
                            1,531	
  

               2H16                        1H17                        2H17                            1H18                                                          2H16                  1H17                           2H17                 1H18
                               Balance	
  Sheet	
  Funded	
  Assets                  NIM	
   (%)                                                                                            4Yr	
   Swap	
   (%)             CoF	
  (%)

                                                                                                                                                            Conservative hedging policy results in immaterial interest
  3          ECX	
  has	
  
      Net interest         reduced	
  its	
  
                      margins          are  reliance	
  
                                               a small on	
  interest	
  
                                                              component
                                          growing	
  other	
  revenues
                                                                        margins	
  
                                                                              ofby	
  income                                                      4         rate risk in ECX balance sheet

               16%                         15%                                                                                                                  A 100bp change in interest rates impacts ECX PBT by +/-$1m
                                                                        13%                                12%
                                                                                                                                                                                                                           1.0	
  

                                                                                                                                                                                                     -­‐1.0	
  
               106.2	
                     114.9	
                     140.3	
                             159.3	
                                                                                                 FY17

               2H16                        1H17                        2H17                            1H18                                                                                                                                             11
                                                                                                                                                                                   -­‐100bp	
   change	
   (PBT)          +100bp	
  c hange	
   (PBT)
                           Net	
   Operating	
  Income                NIM	
   (%	
  of	
  group	
   NOI)
                                                                                                                       1. Balance sheet funded assets are an average for each period
Core competency – Delivering digital solutions to customers

    1      Commitment to technology and innovation                             2    Cost effectively leveraging globally available platforms

•   Forecast $22m FY18 investment in technology (capitalised) ($12.7m 1H18)
•   60 inhouse IT including 20 developers led by highly experienced banking
    and e-commerce technology leaders
•   Core systems based on Sofico, Oracle, TSD platforms
•   GraysOnline eCommerce platform is bespoke and owned by ECX

    3      Investment focused to build key ECX Intellectual Property           4    Delivering a great customer experience

•   Customer portals (fleet portal integrates telematics and fleet services)
                                                                               “… innovative fleet and telematics technology solutions
•   Online auction eCommerce platform
                                                                                   have enabled the optimisation of our fleet, and
•   New car sale platform
                                                                                continue to help us get our employees home safely”
•   Vehicle trade-in platform
•   Vehicle valuation/projection/EOL optimization platform                                    - FleetPlus Corporate Customer

•   Product linkages to provide seamless solutions to customers (incl SME)
•   Online credit approval/scorecard platform
•   Treasury and risk management platform                                                                                             12
Execution track record

Growth, customer satisfaction and increasing returns to shareholders…

      Sustained asset growth whilst increasing services                               Services revenue from Grays and R2D
  1   revenue    and
         Sustained	
     margins
                     asset	
  
                             growth	
  whilst	
  increasing	
  NOI	
  margins     2   contributed          38% of ECX NOI in1H18	
  
                                                                                         1H16	
  NOI	
   Summary
                                                                                                                             1H18   NOI	
   Summary

                                                                      13.9%
                                                                                        1H16 NOI Summary                                 1H18 NOI Summary
                                                                                                                                                                               11%

                                                                                            14%                                                                                           13%
                                           11.1%
              9.9%
                                                                      2,330	
  
                                            2,113	
  
              1,854	
                                                                             $90.0m             69%           40%                       $159.3m
                                                                                      17%

                                                                                                                                                                                                25%

              1H16                          1H17                      1H18

                          AUMOF	
  -­‐	
  Closing       NOI	
   (%)                                                                                      11%

                                                                                                               R2D   Grays   Consumer	
   NOI   Fleet	
   Revenue   End	
  of	
  L ease

  3   Delivering market leading customer satisfaction (NPS)                       4   … and strong earnings growth
                                                                                                                      Cash	
   EPS	
   (cents)
                          ECX	
  NNet
                          ECX     et	
  Promoter	
  
                                         PromoterScore
                                                     Score                                                           ECX Cash EPS                                        27.9	
  
                                              62                       65
                                                                                                                                  25.1	
  

                                                                                                    22.2	
  
               29

              1H16                          1H17                      1H18                         FY16                          FY17                      FY18	
  (guidance	
  m id-­‐               13
                                 1H16         1H17      1H18                                                                                                         point)
03

 Financial results and
 business performance

                         14
1HFY18 Income statement

                                                                                                                                                      HIGHLIGHTS
                                                                                                                                   Growth
$ million                                                                                            1H17                1H18       pcp (%)
                                                                                                                                                      • 23% growth in NPATA to $38.5m
Net operating income before end of lease income and
                                                                                                      99.5               142.8
impairment                                                                                                                                            • GraysOnline reporting a $5.9m NPATA
End of lease income                                                                                   17.4                17.5
Net operating income before impairment charges                                                      116.9                160.3                        • 17% growth in Right2Drive hire revenue
Fleet impairment                                                                                       0.0                     -                      • Stable End of Lease profit despite new vehicle supply issues in NZ -
Credit impairment                                                                                    (1.9)                (1.1)                         delays in revenue associated with return of vehicles and lease renewals,
Net operating income                                                                                114.9                159.3           39%            positive impact expected in 2H18
Employee benefits expense                                                                           (41.2)              (63.2)
                                                                                                                                                      • Overall cost/income has increased to 63% due to the inherently higher
Occupancy expense                                                                                    (4.3)                (9.5)
                                                                                                                                                        ratio in GraysOnline
Technology expense                                                                                   (4.8)                (4.9)
Other operating expenses                                                                            (14.6)              (20.2)                        • Cost to income ratio in fleet has reduced by 150bps to 51.5% since FY15
Total operating expenses                                                                            (64.9)              (97.8)
                                                                                                                                                      • Acquisition and restructure costs of $10.5m reflect $7.5m from acquisition
EBITDA                                                                                                50.0                61.5           23%            of GraysOnline and CarBuyers (areyouselling.com.au) and $3m in costs
Depreciation expense                                                                                 (2.0)                (1.9)                         from the installation of a car rental system and Oracle EBS in R2D. Refer
PBITA before significant items                                                                        48.1                59.6                          reconciliation in Appendix 1
Acquisition and restructure costs 1                                                                  (0.3)              (10.5)
PBITA                                                                                                 47.7                49.0
Interest on corporate debt                                                                           (4.1)                (6.7)
PBTA                                                                                                  43.6                42.3
Amortisation of intangible assets                                                                    (3.6)                (5.1)
PBT                                                                                                   40.0                37.2
Tax expense                                                                                         (11.6)                (9.7)
NPAT                                                                                                  28.4                27.5
Amortisation and impairment of intangible assets (post-tax)                                            2.5                  3.6
Acquisition and restructure costs (post-tax)                                                           0.2                  7.4
NPATA                                                                                                 31.2                38.5           23%
                                                                                                                                                                                                                       15
1. Restructure costs consist of exceptional non-recurring items not reflecting ongoing operations. See Appendix for reconciliation of one off costs
Highly cash generative with predictable free cash flow
                            1H18 Analysis of Free Cash Flow ($m)

                61.5       12.1

                                     6.7
                                                  3.8                                                                              FREE CASH FLOW
                                                               3.6
                                                                           35.2
                                                                                                                                   • 23% growth in EBITDA to $61.5m in 1H18
                                                                                                                                   • Significant free cashflow of $35.2m was generated throughout 1H18
                                                                                                                                   • Free cashflow represented approx. 92% of ECX NPATA

                                                                                                                                   GROWTH INITIATIVES
                                                                     1,2
                       ECX 1H18 changes in net debt ($m)                                                                           • Free cashflow invested in growth related software initiatives and payment
                                                                                                                                     of dividends
                                                                                                  157.4
                                                                                        10.5
                                                                     7.5     2.3                                                   • Eclipx also undertook other investments in 1H18 including;
                                                        10.1
                                           13.5
 116.4   35.2               12.7    4.2                                                                                                   ü Acquisition of CarBuyers in Dec-17 (including acquisition costs)
                 16.2
                                                                                                                                          ü Financing of NZ SME
                                                                                                                                          ü Financing vehicle inventory awaiting sale
                                                                                                                                          ü Restructure costs in Grays and Right2Drive
                                                                                                                                          ü Right2Drive receivables financing
                                                                                                                                   •       Closing net debt of $157.4m is after investment spend

                                                                                                                                                                                                                          16
                                           1. Sep-17 Net debt has been calculated by taking drawn corporate debt $254.8m, less cash and equivalents $59.1m, less mezzanine notes held by ECX available for sale $79.3m
                                           2. Mar-18 Net debt has been calculated by taking drawn corporate debt $328.2m, less cash and equivalents $53.6m, less mezzanine notes held by ECX available for sale $117.2m
Diversified funding profile

HIGHLIGHTS                                                                                                                   Funding Sum m ary 31-Mar-18
• Accessed the term ABS market in November 2017 with an AUD351m ABS                  $ m illion                               Draw n   Undraw n          Total
  issue including fleet, consumer auto and equipment finance receivables             Eclipx-funded (w arehouse facilities)      747          256         1,003
  allocated to 20 investors – reduced funding costs                                  Eclipx-funded (asset-backed security)      648             -         648
• AUD360m committed corporate facility, with ability to increase to AUD425m          Total (ex. P&A)                          1,395          256         1,651
  providing additional capital for growth                                            Third-party funded                         797             -         797
• AUD458m in available financing resources for growth including unrestricted         Total (inc. P&A)                         2,191          256         2,448
  cash ($53m) and undrawn committed facilities ($288m), warehouse mezzanine          Corporate debt                             328           32          360
  notes held by ECX for sale ($117m) and Principal and Agency funding
  agreements with 20 financiers.                                                     Total                                    2,520          288         2,808

OUTLOOK
• Since balance date, ECX has also received a credit approved term sheet for
  the private placement of up to cAUD100m in bonds to a large US global fund
  manager (delivered in AUD hedged with no exchange or interest rate risk).
  This issuance will have a 7 year term with a fixed rate and be issued as part of
  the ECX corporate debt program and is subject to final negotiations on
  documentation

• Most diverse and competitive funding platform in the market which leverages
  warehouses, ABS and third-party funders to provide funding certainty,
  headroom for growth and a clear point of differentiation

                                                                                                                                                        17
Strong asset and credit quality

CONTINUOUS IMPROVEMENT IN RISK ANALYTICS
• Credit impairment has remained low during 1H18 with favourable
  economic conditions and continued growth in Government and large
  Corporate business
• 90+ day arrears is 4bps of on-balance sheet lease receivables as at 31
  March 2018 – below long term average
• Significantly diverse customer exposure

• Credit approval is independent of the sales teams

RESIDUAL VALUE MANAGEMENT
• Used car prices maintained over the long term despite the reduction in                          Australian used car sale prices and tariffs
  import tariffs on new cars                                                   $20,000
                                                                                                                                                                40%
• Fleet is diversified across manufacturer and vehicle type
                                                                               $15,000
• Statistical models using 30 years of operating experience in Australia and                                                                                    30%
  New Zealand to set residual values on operating leases
                                                                               $10,000
                                                                                                                                                                20%
• Full market valuations are undertaken monthly on the complete operating
  lease portfolio against third party sales and valuation databases             $5,000                                                                          10%
• Disposal trends are monitored on an ongoing basis for end of lease
  disposal optimisation                                                            $0                                                                           0%
                                                                                         1990   1993   1996    1999   2002   2005   2008   2011   2014   2017
• Market leading Residual Value risk management technology
                                                                                                   Tariff Rate %       Avg Large & SUV       Avg Small
                                                                                                                                                                      18
Australia Commercial

Eclipx continues to outperform and take market share                                                        $ million
                                                                                                                                                          1H17         1H18        Growth
                                                                                                                                                         Actual       Actual          pcp
                                                                                                                                             1
                               •   Grow fleet market share by continued focus on our industry leading       New Business Writings - Fleet                   183             204       12%
                                   service excellence and product innovation                                New Business Writings - Equipment                32              34        5%
                               •   Continued growth in funded market share due to customers
                                                                                                            New Business Writings                           215             238       11%
                                   wanting fleet solutions that integrate telematics and fleet services
      Strategy                                                                                              AUMOF (closing)                               1,058        1,169          10%
                               •   Promote full ECX capability with car buying, trade-ins and auctions
                                   for corporates wishing to own and manage their own fleet                 VUMOF - funded (units)                       33,031       36,521         11%

                               •   Well positioned for car sharing and mobility services on demand          VUMOF - managed (units)                      18,705       19,528          4%
                                   with ECX car rental technology infrastructure
                                                                                                            VUMOF - total (units)                        51,736       56,049           8%

                                                                                                            NOI                                            58.8             61.5       5%
                               •   12% growth in Fleet new business writings from high credit quality
                                   corporates and governments                                               NPATA                                          18.9             20.3       7%

                               •   Telematics continues to provide significant value to customers           Cost / Income (%)                            51.1%        50.4%         70bps
                                   including Workplace Health and Safety compliance                         NOI/Avg AUMOF                                11.3%        10.7%        (60bps)
     Highlights                •   ECX investments in automation and improved processes drive
                                                                                                            NPATA/Avg AUMOF                               3.6%          3.5%       (10bps)
                                   further reductions in cost/income ratio
                                                                                                            NPATA/NOI (%)                                32.2%        33.0%         80bps
                               •   Strong EOL results from light commercial and heavy vehicles
                                   driven by additional distribution through GraysOnline                                            AU Commercial - AUMOF & NPATA
                                                                                                                                                                    20.3
                               •   NPATA/NOI % increased to 33.0% (up from 32.2% pcp)
                                                                                                                                                 18.9
                               •   New online origination strategy to focus on increasing SME penetration                 17.8

                               •   Strong pipeline of blue chip new business opportunities                                                                          1,169
      Outlook                                                                                                             953
                                                                                                                                                 1,058

                               •   New ECX customer portal to provide new insights to customers on fleet
                                   optimisation and cost efficiency – increased value for customers                       1H16                   1H17               1H18                     19

1. NBW excludes sale and leaseback agreements totaling $8.7m in 1H17 and $1.3m in 1H18                                                Closing AUMOF           NPATA
New Zealand Commercial

Eclipx invests in growth to leverage fleet market leadership                                                    $ million (AUD)2
                                                                                                                                                                  1H17            1H18    Growth
                                                                                                                                                                 Actual          Actual      pcp

                               •   ECX has established a new standalone NZ SME business based in                New Business Writings                                93             102      10%
                                   Auckland CBD to focus on SME equipment finance with vehicle                  AUMOF (closing)                                     445             489      10%
                                   lease cross sell
                                                                                                                VUMOF - funded (units)                           17,778          19,040      7%
     Strategy                  •   Expand AutoSelect retail car sales in Auckland, Wellington and
                                   Christchurch to increase capacity for sale of end of lease stock             VUMOF - managed (units)                          12,476          10,551    (15%)

                               •   Grow fleet market share by continued focus on service excellence             VUMOF (units)                                    30,254          29,591      (2%)
                                   and product innovation in fleet services and aftermarket sales
                                                                                                                NOI                                                21.1            20.5      (3%)

                                                                                                                NPATA                                               5.4             5.6       4%
                               •   New Business growth has increased in line with expectations
                                   including the retention of 6 key corporate customers on sole                 Investment in SME                                                  -1.4

                                   supply                                                                       NPATA (after investment in SME)                     5.4             4.2    (22%)
                               •   Delivery delays on over 400 new vehicles - push EOL profits into             Cost / Income (%)      1
                                                                                                                                                                 58.5%           59.4%    (90bps)
                                   2H18
                                                                                                                                   1
    Highlights                                                                                                  NOI/Avg AUMOF                                     9.5%            8.7%    (80bps)
                               •   Efficiency gains from process and technology initiatives drive
                                                                                                                                             1
                                   NPATA growth                                                                 NPATA/Avg AUMOF                                   2.4%            2.4%          -

                               •   Reduction in lower yield managed units reflects Fleetsmart                   NPATA/NOI (%)      1
                                                                                                                                                                 25.5%           27.3%    180bps
                                   customers on exit prior to ECX acquiring business                                                                                      1
                                                                                                                                           NZ Commercial - AUMOF & NPATA
                               •   NPATA/NOI % increased to 27.3% (up from 25.5% pcp)                                                                    5.4
                                                                                                                                                                          5.6

                                                                                                                                       5.0
                               •   Increased demand for Electric Vehicles as Government and large
                                   corporate focus on their environmental footprint
      Outlook                  •   Focus on improving penetration of existing FleetPartners SME                                                          445              489
                                                                                                                                   406
                                   customers using new ECX proprietary single platform technology
                                                                                                                                   1H16                 1H17              1H18
                                                                                                                                                                                                    20
1. Ratios have been calculated after adding back the investment in NZ SME ($1.4m after tax, $2.0m before-tax)                                    Closing AUMOF      NPATA
2. Average AUD/NZD exchange rate 1H17 1.06 and 1H18 1.09, Spot AUD/NZD exchange rate 1H17 1.09 and 1H18 1.06
Australia Consumer (CarLoans and novated)

Increased Georgie car buying and new alliances will complement ECX novated leasing and digital marketing channels
                                                                                     $ million                                1H17        1H18        Growth
                                                                                                                             Actual      Actual          pcp
               •   ECX will leverage its scale, technology and independence to
                   deliver superior value to consumers through its car buying        New Business Writings                     150              162       7%
   Strategy
                   capability offering a full suite of products including used car   AUMOF (closing)                           609              672      10%
                   trade-ins, consumer finance, novated solutions and insurance
                                                                                     VUMOF (units)                           22,270      26,443          19%

                                                                                     NOI                                       15.6         16.9          8%
               •   6% increase in NPATA to $3.9m1 due to:
                                                                                     NPATA                                      3.7             3.9       6%
                      •   Increased sales of new cars by Georgie
                                                                                     Cost / Income (%)                       67.0%        65.2%       180bps
                      •   Lowering the average cost of acquisition resulting from
  Highlights              recent investments in marketing automation                 NOI/Avg AUMOF                            5.3%         5.1%       (20bps)

                      •   Improved cost efficiency despite new car buying business   NPATA/Avg AUMOF                          1.3%         1.2%       (10bps)
                          being in start-up phase
                                                                                     NPATA / NOI (%)                         23.7%        23.1%       (60bps)

                                                                                                  Carloans and novated - AUMOF & NPATA

                                                                                                                                          3.9
                                                                                                                       3.7
               •   ECX is in discussions with a number of parties with large                           3.2
                   consumer customer bases for the provision of its full suite of                                                         672
                   consumer products including New Car Sales (Georgie), trade-in                                       609
                                                                                                     495
                   through areyouselling.com.au and finance/insurance.
   Outlook
               •   Used car trade-ins will be auctioned by GraysOnline
                                                                                                     1H16             1H17               1H18

                                                                                                             Closing AUMOF        NPATA                         21
Right2Drive

Increased distribution drives 39% growth in hire volumes
                                                                                                                                                                                       1H17                   1H18       Growth
                                                                                                                               $ million
                                •   Grow market share and category awareness by increasing                                                                                            Actual                 Actual         pcp
                                    distribution with the addition of 15 new branches in last 12 months                        Branches                                                      20                     35     75%

                                •   Continue to expand and diversify lead sources with majority of                             Hires (units)                                          14,249                 19,830        39%
      Strategy                      growth coming from direct and ECX referrals                                                Hire income                                                32.3                    37.9     17%
                                •   Leverage car rental platform to expand market opportunity into                             Net Operating Income                                       19.4                    21.1      9%
                                    car rental and other vehicle hire adjacencies                                              NPATA                                                        3.2                    4.2     30%
                                                                                                                               Cost / Income (%)                                      72.2%                      65.3%   690bps
                                                                                                                               NPATA/NOI (%)                                          16.5%                      19.8%   330bps
                                •   +39% growth in hire volumes to 19,830 pcp
                                                                                                                                                     Hire activity and NPATA margins (%)
                                •   NPATA increase 30% pcp despite a $1.4m (pre-tax) investment in
                                                                                                                                                 Hire activity and NPATA margin (%)1
                                    new branches and associated vehicle stock ramp up
                                                                                                                                                                                                    19.8%
                                •   Rental car technology platform successfully implemented which                                                                  16.5%
     Highlights                     replaces previous manual processes and improves cost efficiency                                            13.7%

                                •   5 new branches opened in GraysOnline locations                                                                                                                  19,830	
  
                                                                                                                                                                   14,249	
  
                                •   Right2Drive Net Promoter Score increased to +87
                                                                                                                                               7,579	
  

                                                                                                                                               1H16                1H17                             1H18

                                •   Continue to increase referral partnerships                                                                             Hires                NPATA	
  /	
  NOI
      Outlook
                                •   Continue to drive brand and category awareness

                                                                                                                                                                                                                             22

1. Rental hire income and NPATA margin is provided on a pro-forma basis for 1H16 as Right2Drive was acquired on 19 May 2016.
GraysOnline - standout performance

     On track to deliver $23-$25m EBITDA (NPATA $14.0-$15.4m) in FY18                                                                                               $ million
                                                                                                                                                                                                                                1H17             1H18      Growth
                                                                                                                                                                                                                               Actual           Actual        pcp
                                      •   Under ECX ownership, Grays has been refocused to target profitable                                                        Industrial1                                                   154              163         6%
                                          channels and asset categories including Industrial and Auto                                                               Auto                                                             83             104         25%
            Strategy
                                      •   GraysOnline will continue to leverage and grow its unique e-commerce                                                      Total Sales 1                                                   237             267         13%
                                          transacting platform which has over 2.4m registered users across AU/NZ                                                    Net Operating Income                                                           39.2
                                                                                                                                                                    EBITDA                                                                           9.6
                                      •   1H18 total sales $267m; $5.9m NPATA
                                                                                                                                                                    NPATA                                                                            5.9
                                      •   Industrial auction business has organically grown 6% pcp, driven by a strong
                                                                                                                                                                    Cost / Income (%)                                                           75.8%
                                          performance in Transport and Manufacturing +39% pcp
                                                                                                                                                                    NOI/Sales (%)                                                               12.6%
                                      •   Cost/Income ratio down to 76% from c85% pre acquisition
                                                                                                                                                                    NPATA/Sales (%)                                                               1.9%
                                      •   Successfully implemented a number of Auto initiatives:                                                                    NPATA/NOI (%)                                                               15.1%
                                            •   National roll-out of proprietary e-tender B2B platform to sell high quality
          Highlights                            Eclipx vehicles (FleetPartners, FleetPlus and areyouselling.com.au)
                                                                                                                                                                          1H17 comparative data (Oct16-Mar17) provided where available
                                                (launched Mar-18)
                                            •   Expansion of Grays Auto launched Jan-18 to include fixed price, home
                                                delivery & warranty bundle options                                                                                                     Auto Sales
                                                                                                                                                                                               Sales	
  (($m)
                                                                                                                                                                                        Auto	
            $m)                              Grays Industrial Sales ($m)
                                            •   Acquired disruptive, online car trade-in business areyouselling.com.au in                                                                                                                   Grays	
  Industrial	
  Sales	
  ($m)
                                                Dec17. areyouselling.com.au was a client of GraysOnline prior to being                                                                                                                                   +6%
                                                                                                                                                                                               +25%
                                                acquired
                                                                                                                                                                                                                 104	
                                                 163	
  
                                                                                                                                                                                      83	
                                                       154	
  
                                      •   Total auction volume split is expected to be 47% / 53% from 1H/2H
                                          seasonality on a relatively fixed cost base
                                                                                                                                                                                    1H17                       1H18                             1H16                  1H17
                                      •   Industrial auction business well positioned to capitalize on large
            Outlook                       infrastructure projects
                                      •   GraysOnline e-commerce transacting platform refresh & user experience
                                          enhancement programs driving improved site visitor/bidder metrics                                                                                                                                                23
1. 1H17 Industrial and Auto sales provided on a pro-forma basis as Grays Ecommerce Group was acquired on 11 August 2017. Grays sales volume excludes Insolvency ($37.4m 1H18) and Wine ($10.8m 1H18). 1H17 data provided where available and comparable
04

 Strategies for delivering
 sustainable growth

                             24
Growth Strategy - Growing SME market share in NZ

     ECX is able to sell equipment and vehicle leases to SMEs in       With a fast, easy and integrated sales model
 1   one conversation using its integrated platform                2   to originate new SME customers

 3   250 new SME customers originated since launch in Dec17        4   SME market in NZ is significant with c500,000 businesses

     300   NUMBER OF NEW ACTIVE SME CUSTOMERS
                                                                                                     Integrated
     250                                                                                $250m
                                                                                                      Platform
                                                                                        AUMOF
     200
                                                                                  $130m      $10~15m+     Leverage
     150
                                                                                   NBW                    Credit
                                                                                              NPATA
     100                                                                             p.a.                 Expertise
                                                                                              (c5 yrs)
      50
                                                                                     Target 10,000   Fleet
       0                                                                               new SME       Cross-Sell
                                                                                      Customers
                                                                                                                       25
            Dec-17   Jan-18   Feb-18    Mar-18   Apr-18
Growth strategy - Georgie car buying service - a positive experience

Leveraging our scale, technology, experience and independence to deliver superior value to car buying consumers

   1      Independent and brand agnostic                                                         2       …with purchasing power throughout an assets lifecycle

                                                                                                                           c. $2.3bn                      c. $1bn
• NATIONAL TEAMS                         • INDEPENDENCE                                                                    Assets under finance           New cars purchased
We have consumer teams with 7-day        We can command remarkable
coverage in all major markets            pricing for our customers.                                                                                                c. $25m
                                                                                                             c. 2.6m                                               Insurance sold
                                                                                                             Customer database
• PREMIER ACCESS TO INVENTORY            • DIGITAL EXPERTISE
                                                                                                                                                                     c. $15m
We have preferred agreements with the    We are digital-first and work across                                     c. 50,000                                          Tyres purchased
                                                                                                                  Used cars sold
largest dealer networks in the country   channels to lower acquisition costs
                                         and meet customer needs                                                                   c. $100m+               c. $50m
                                                                                                                                   Fuel purchased          Maintenance & servicing

   3      Delivers superior value to customers                                                   4       … and a strong growth trajectory for Eclipx

                                                                                                 150              Monthly new car deliveries by Georgie
            Up to 10%                            $1,444
       Georgie average savings on a       CarLoans average savings                                                                                     Start of

                                                                                Cars delivered
        new car purchase off RRP              on consumer loan                                                                                        Christmas
                                                                                                 100                                                   period

               $4,000                               15%
       Average savings on a novated           Average savings on                                  50       Soft
         lease with pre-tax savings        preferred insurance rates                                     launch                        Website goes
                                                                                                                                          live
                                                                                                     0
                 10%                                15%
          Average earnings on              Average savings on tyres
                                                                                                                                                                                 26
        competitive trade-in prices           and maintenance
Growth strategy - Georgie car buying service - a positive return

Car buying service facilitates multiple additional income streams for ECX

                                  AUST
                                                                                                                                                                    GROSS REVENUE
                                MARKET                                                                                                                                                                      CROSS
                                                                                                 ECX POSITIONING                                                   OPPORTUNITY PER    DEALERSHIP   ECLIPX
                                  SIZE                                                                                                                                                                       SELL
                                                                                                                                                                     TRANSACTION1
                                ($bn) p/a
          Research

                                                     Vehicle research &      ECX owned PerformanceDrive.com.au provides independent & expert new car reviews
                                                      content expertise

                                New Car
                                                    Car Brand Neutrality     ECX is brand agnostic                                                                  $1,000 - $1,200                         100%
                               Purchases
                               $41bn+ pa
          Buy

                                                     Test Drive Network      New car test drives available at convenient locations and times

                                                      Car Buying Power       ECX has significant new car buying power – purchases $1bn in new cars annually

                                                          Trade-in Service   ECX owned areyouselling.com.au can provide a call centre based car trade-in service    $1,300 - $1,500                         10-20%
        Disposal
        Trade-in

                                Used Car
                                  Sales
                                $39bn pa
                                                      Auction disposal       ECX owned GraysOnline can dispose of trade-in vehicles quickly and profitably           $500 - $600                            5-10%

                                Finance &
                                                      Lender Neutrality      ECX can access its own funding warehouses and P&A funders to drive the best deal       $1,600 - $1,800                         30-40%
          Finance

                                Insurance
                                $33bn pa
                                                    Insurance Neutrality     ECX leverages its insurance buying power

                                                                                                                                                                                                       27
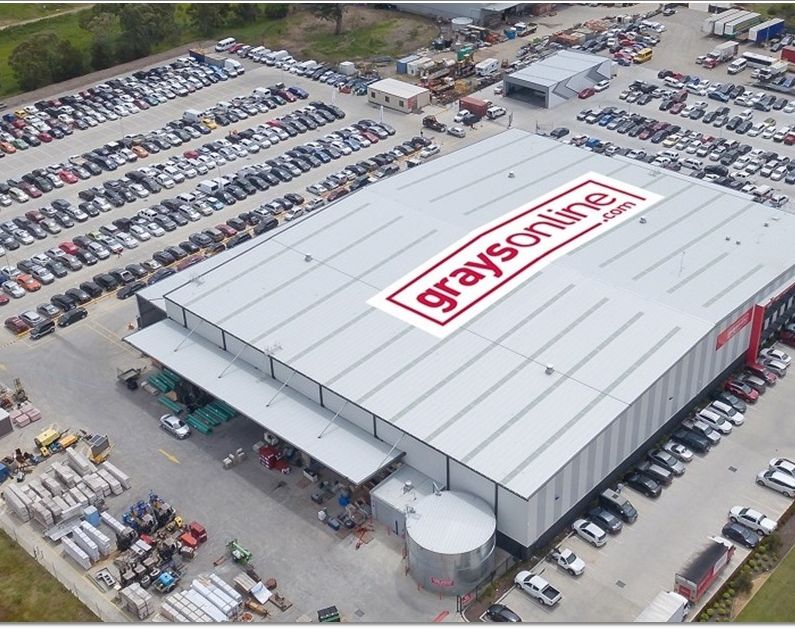
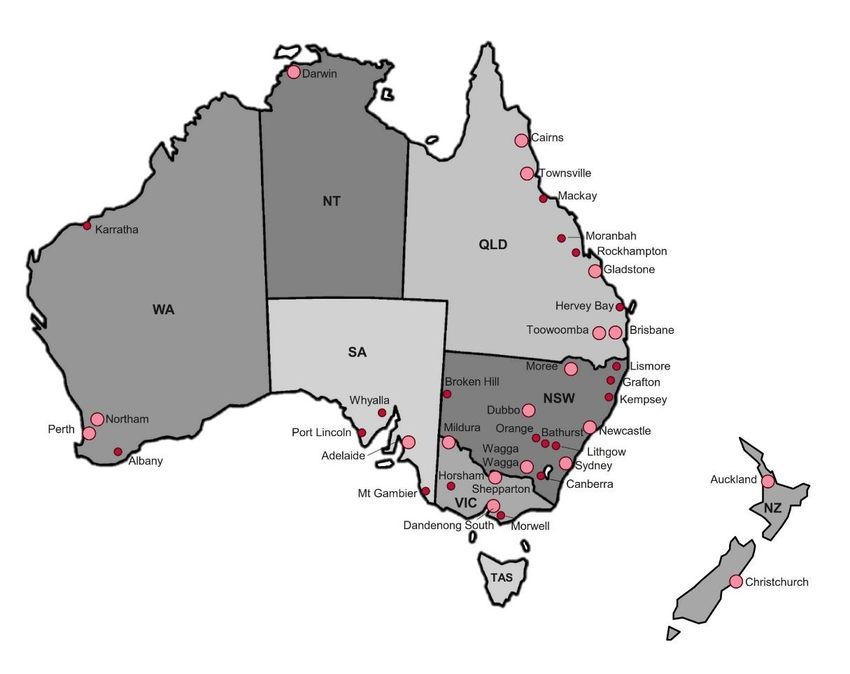
1. Before acquisition costs, direct costs and overheads
GraysOnline at a glance

An unmatched e-commerce transacting marketplace specialising in assets for both consumers and businesses
                                                                                                                 Industry expertise and market leading platform creates
 1     Significant digital reach in Australia and New Zealand                                         2          long-term relationships with our partners

                                                                                                                                     • c75% of 1H18 sales were
               2.4m                                       790,000                                                                      sourced from repeat partners                                       Corporations
               Registered users                           Email subscribers                                                            (vendors)
                                                                                                        25%
                                                                                                                                     • 16 of our top 20 vendors have
                                                                                                                                       been with us for an average of                                     SMEs
                                                                                                                       ~75%            5+ years
               400,000                                    34m
                                                          Page views                                                                 • Our volumes are well diversified
               Auction bids                                                                                                            with 73% sourced outside our
               per month                                  per month                                           Repeat    New                                                                               Govt
                                                                                                                                       top 20 vendors

 3     Across a range of industries (unmatched by competitors)                                        4          Supported by our extensive network coverage and scale

                                           Other
        Agriculture                   8%
                                 3%
                            5%
       AV / IT                                      39%          Auto

                      16%
                                      1H18  Sales
                                       1H18 Sales
                                        $267m
                                         $267m
                                               1
   Transport

                            11%
   Manufacturing                                                                                    • 40 locations across AUS and NZ
                                              18%
                                                          Mining & Civil                            • 100+ BDMs covering all states and territories
                                                                                                                                                                                                           28
                                                                              1. 1H17 Industrial and Auto sales provided on a pro-forma basis as Grays Ecommerce Group was acquired on 11 August 2017. Grays sales
                                                                                 volume excludes Insolvency ($37.4m 1H18) and Wine ($10.8m 1H18). 1H17 data provided where available and comparable
GraysOnline growth strategy – Industrial

     Significant organic growth in the core business driven by superior service offering and scalable technology platform

                   Online used equipment sales are increasing and
         1         equipment dealers are being disintermediated                                                                          2     Industrial has delivered continued organic growth

     How GraysOnline wins in the $13bn used industrial equipment market:                                                               Industrial has grown 6% pcp during         Industrial Sales Volume ($m)1
                                                                                                                                       the post-acquisition integration phase,
     • Speed – shorter sales cycle (less than 21 days)                                                                                 with strong contribution from the
     • Certainty – superior clearance rates (80%+)                                                                                     Manufacturing and Transport
                                                                                                                                       categories
     • Market reach – online platform that reaches a global audience
     • Sales performance – auction performance closer to retail results
     • Industry expertise – provides unique insights on assets and values

                   e-commerce and infrastructure investment in Australia
         3         supports a growing future pipeline                                                                                    4     Increase share and expanding industrial margins

     Transport                                                                                                                         • Leverage industry expertise to diversify revenues
     • Activity in the Transport sector is increasing due to growth in global                                                            through value-added services including:
       e-commerce and associated Australian distribution centres                                                                           • Valuations
                                                                                                                                           • Asset audits
     • Investment in a dedicated and experienced transport BDM team
                                                                                                                                           • Inventory management, and
     Construction                                                                                                                          • Insolvency consulting
     • Infrastructure boom will underpin demand for construction                                                                       • Differentiated bidder base which includes both
       equipment in future years                                                                                                         businesses and consumers is driving growth in
                                                                                                                                         market share                                                   29
1. 1H17 Industrial and Auto sales provided on a pro-forma basis as Grays Ecommerce Group was acquired on 11 August 2017. Grays sales
   volume excludes Insolvency ($37.4m 1H18) and Wine ($10.8m 1H18). 1H17 data provided where available and comparable
GraysOnline growth strategy – Auto

GraysOnline Auto is poised to capitalise on the migration of the $40bn p.a. used car market to online

        GraysOnline is an online used car e-commerce
  1     marketplace - 80%+ of vehicles sold sight unseen                  2    25% growth pcp in auto auction volume by GraysOnline

• Used car dealers disrupted by GraysOnline and increased property
  prices - car yards more valuable for residential development
• Multiple GraysOnline selling options (eTender, online auction,
  traditional auction and retail)
• Extensive customer database - 85% are consumers, creates
  increased bidder activity and competition
• Integrated service offering – car buying/selling, finance and
  insurance

  3     Used car trade-in with ‘Are You Selling’                          4    Multiple organic growth opportunities

• The areyouselling.com.au online                                      • ECX direct car retailing
  used car buying service was
                                                                          • Ex-fleet remarketing including eTender and online dealer auctions
  acquired in Dec-17 and provides
  ECX with full asset lifecycle                                           • Novated trade-in service
  capability
                                                                       • Direct to consumer auction and sale service with benefits over classifieds:
                                                                          • Speed of sale – same day valuation and purchase
                                                                          • Convenience – at home pick-up
                                                                                                                                      30
Growth strategy - Right2Drive

   A growing source of lead referrals in a largely unpenetrated market

                 ECX digital expertise and corporate partnerships diversify                                             Investments in national branch network drives a 39%
       1         and grow R2D lead   generation
                                1H18 Analysis of R2D leads                                                          2   growth in hires
                                                                                                           18,480                   National	
  footprint	
  supports	
  growth	
  in	
  hires1
                                                                                    3,201
                                                                                                                                 National footprint supports growth in vehicle hires1
                                                                                                                                                                                             35

                                                                  1,271

                                                961                                                                                                                20
                              13,047                                                                                                    16
                                                                                                                                                                                         19,830	
  
                                                            Growth	
  +42%
                                                                                                                                                                 14,249	
  
                                                                                                                                       7,579	
  

                                                                                                                                       1H16                      1H17                    1H18
                                                                                                                                                         Hires                Branches

                 Reductions in the average length of hire lowers insurer                                                … and provide significant growth optionality in the $2bn
       3         repair costs and enhances customer experience (NPS +87)                                            4   car rental and accident replacement markets

                             Scale	
  
                               Scale  and	
  
                                       andautomation	
    improve	
  NPATA
                                              automation improves     NPATA	
  margins
                                                                                margins	
  
                                                                                      1

                                                                                                19.8%
                                                                                                                                                   Car rental & vehicle
                                                           16.5%                                                                                   replacement market
                              13.7%

                                18.3	
  
                                                             16.3	
                             15.2	
  
                                                                                                                                                   Not at Fault accident
                                                                                                                                                   replacement Market

                               1H16                            1H17                             1H18                                                       Other
                                             Avg	
  Hire	
   Days         NPATA	
   /	
   NOI                                                                                                         31

1. 1H16 data has been provided on a pro-forma basis as Right2Drive was acquired on 19 May 2016
05

 Summary

           32
Summary

  ECX is an integrated Assets Services business with market leading technology and multiple income streams

   • Against a backdrop of significant growth in ECX fleet businesses over the past 4 years, ECX is continuing to invest in new business and
    technology initiatives as it builds its integrated asset services business generating multiple income streams across the asset and
    customer life cycle. Grays and R2D service businesses are delivering strong earnings growth

  Well placed to benefit from structural and cyclical growth trends, with a compelling customer value proposition

   • ECX will be a beneficiary of the structural consumer move to online purchase of new cars, with a unique and compelling value proposition

   • GraysOnline continues to grow its online auction transacting capability as equipment sellers move from dealers to online and consumers
    move their used car purchase away from a declining number of used car dealerships

   • ECX will benefit from an increasing number of fleet renewals and, as a result, more vehicles being sold at end of lease

   • New initiatives will drive higher margin equipment and vehicle leasing volumes in the SME segment

  Continued growth in earnings, predictable free cash flow and increased returns for shareholders

   • FY18 guidance reaffirmed: 27-30% NPATA growth and 10%-12% forecast Cash EPS growth vs pcp

                                                                                                                                               33
06

 Appendices

              34
Appendix 1 – Consolidated income statement

                                   $ million                                                         1H17     1H18
                                   Net operating income before end of lease income and
                                                                                                      99.5    142.8
                                   impairment
                                   End of lease income                                                17.4     17.5
                                   Net operating income before impairment charges                    116.9    160.3
                                   Fleet impairment                                                    0.0         -
                                   Credit impairment                                                  (1.9)    (1.1)
                                   Net operating income                                              114.9    159.3
                                   Employee benefits expense                                         (41.2)   (63.2)
                                   Occupancy expense                                                  (4.3)    (9.5)
                                   Technology expense                                                 (4.8)    (4.9)
                                   Other operating expenses                                          (14.6)   (20.2)
                                   Total operating expenses                                          (64.9)   (97.8)   • A reconciliation of NPAT to NPATA follows:
                                   EBITDA                                                             50.0     61.5
                                   Depreciation expense                                               (2.0)    (1.9)                                                1H17   1H18
                                   PBITA before significant items                                     48.1     59.6
                                                                                                                       NPAT                                         28.4   27.5
                                   Acquisition and restructure costs 1                                (0.3)   (10.5)
                                                                                                                       Add back post tax non-recurring costs:
                                   PBITA                                                              47.7     49.0
                                                                                                                       Car Buyers acquisition costs                         0.3
                                   Interest on corporate debt                                         (4.1)    (6.7)   Grays acquisition costs                              0.2
                                                                                                                       Onyx acquisition costs                        0.2    -
                                   PBTA                                                               43.6     42.3
                                                                                                                       Grays restructure costs                              4.6
                                   Amortisation of intangible assets                                  (3.6)    (5.1)   Right2Drive restructure costs                        2.2
                                                                                                                                                                     0.2    7.4
                                   PBT                                                                40.0     37.2
                                   Tax expense                                                       (11.6)    (9.7)   Add back amortisation of intangible assets    2.5    3.6
                                   NPAT                                                               28.4     27.5
                                                                                                                       Cash NPATA                                   31.2   38.5
                                   Amortisation and impairment of intangible assets (post-tax)         2.5      3.6
                                   Acquisition and restructure costs (post-tax)                        0.2      7.4
                                   NPATA                                                              31.2     38.5
                                                                                                                                                                              35
1. Restructure costs consist of exceptional non-recurring items not reflecting ongoing operations.
Appendix 2 – Consolidated balance sheet

              $ million                              30-Sep-17   31-Mar-18
              Assets
              Cash and cash equivalents                   59.1        53.6
              Restricted cash and cash equivalents       136.2       140.3
              Trade and other receivables                138.5       162.1
              Leases                                   1,496.4     1,565.9
              Inventory, PP&E and other assets            42.1        43.9
              Intangibles                                806.6       825.9
              Total assets                             2,678.9     2,791.7
              Liabilities
              Trade and other liabilities                126.4       134.5
              Borrowings - Warehouse                   1,355.6     1,384.7
              Borrowings - Corporate Debt                254.8       328.2
              Borrowings - Total                       1,610.4     1,712.9
              Other liabilities                           78.9        59.3
              Total liabilities                        1,815.7     1,906.7
              Net assets                                 863.3       885.0

              Contributed equity                         635.2       643.4
              Reserves                                    12.4        22.8
              Retained earnings                          215.7       218.9
              Total equity                               863.3       885.0

                                                                             36
Legal disclaimer

This Presentation contains summary information about Eclipx          Past performance information given in this Presentation is             Forward-looking statements speak only as at the date of this
Group Limited (Eclipx) and its subsidiaries and their activities.    given for illustrative purposes only and should not be relied          Presentation and to the full extent permitted by law, Eclipx and
The information in this Presentation does not purport to be          upon as (and is not) an indication of future performance.              its Related Parties disclaim any obligation or undertaking to
complete. It should be read in conjunction with Eclipx’s other                                                                              release any updates or revisions to information to reflect any
periodic and continuous disclosure announcements lodged with         This Presentation contains certain forward-looking statements          change in any of the information contained in this Presentation
                                                                     with respect to the financial condition, results of operations and
the Australian Securities Exchange, which are available at                                                                                  (including, but not limited to, any assumptions or expectations
                                                                     business of Eclipx and associated entities of Eclipx and certain
www.asx.com.au.                                                                                                                             set out in this Presentation).
                                                                     plans and objectives of the management of Eclipx. Forward-
The information contained in this Presentation is not investment     looking statements can be identified by the use of forward-            Statutory profit is prepared in accordance with the Corporations
or financial product advice and has been prepared without            looking terminology, including, without limitation, the terms          Act 2001 and the Australian Accounting Standards, which
taking into account the investment objectives, financial situation   “believes”, “estimates”, “anticipates”, “expects”, “predicts”,         comply with the International Financial Reporting Standards
or particular needs of any particular person. Before making an       “intends”, “plans”, “goals”, “targets”, “aims”, “outlook”,             (IFRS). Underlying profit is categorised as non-IFRS financial
investment decision, investors should consider the                   “guidance”, “forecasts”, “may”, “will”, “would”, “could” or “should”   information and therefore has been presented in compliance
appropriateness of the information having regard to their own        or, in each case, their negative or other variations or                with Australian Securities and Investments Commission
investment objectives, financial situation and needs and seek        comparable terminology. These forward-looking statements               Regulatory Guide 230 – Disclosing non-IFRS information,
independent professional advice appropriate to their jurisdiction    include all matters that are not historical facts. Such forward-       issued in December 2011.
and circumstances.                                                   looking statements involve known and unknown risks,
                                                                                                                                            All figures in this Presentation are A$ unless stated otherwise
                                                                     uncertainties and other factors which because of their nature
To the extent permitted by law, no responsibility for any loss                                                                              and all market shares are estimates only. A number of figures,
                                                                     may cause the actual results or performance of Eclipx to be
arising in any way from anyone acting or refraining from acting      materially different from the results or performance expressed         amounts, percentages, estimates, calculations of value and
as a result of this information is accepted by Eclipx, any of its                                                                           fractions are subject to the effect of rounding. Accordingly, the
                                                                     or implied by such forward-looking statements.
related bodies corporate or its Directors, officers, employees,                                                                             actual calculations of these figures may differ from figures set
professional advisors and agents (Related Parties). No               Such forward-looking statements are based on numerous                  out in this Presentation.
representation or warranty, express or implied, is made by any       assumptions regarding Eclipx’s present and future business
person, including Eclipx and its Related Parties, as to the          strategies and the political, regulatory and economic
fairness, accuracy, completeness or correctness of the               environment in which Eclipx will operate in the future, which
information, opinions and conclusions contained in this              may not be reasonable, and are not guarantees or predictions
Presentation.                                                        of future performance. No representation or warranty is made
                                                                     that any of these statements or forecasts (express or implied)
An investment in Eclipx securities is subject to investment and
                                                                     will come to pass or that any forecast result will be achieved.
other known and unknown risks, some of which are beyond the
control of Eclipx or its Directors. Eclipx does not guarantee any
particular rate of return or the performance of Eclipx securities.

                                                                                                                                                                                          37
You can also read