#SPORT ONON SOCIAL League Table 2020 - Report & Analysis - Redtorch
←
→
Page content transcription
If your browser does not render page correctly, please read the page content below
#SPORT   ON   SOCIAL
              League Table 2020
                      Report & Analysis
#SPORT   ON   SOCIAL

   CONTENTS
                       02-05                                        13-25                   40-51
                                 OVERVIEW                                   FACEBOOK                TWITTER
                            02   A Message from our CEO                14   Top 10             41   Top 10
                            03   Methodology                           15   Trends            42    Trends
                            04   #SportOnSocial League Table 2020      24   FIBA Insights     50    BWF Insights
                            05   Ollie’s Headlines

                       06-12                                        26-39                   52-62
                                 PLATFORM TRENDS                            INSTAGRAM               YOUTUBE
                                                                       27   Top 10            53    Top 10
                                                                      28    Trends            54    Trends
                                                                      38    WR Insights        61   World Athletics Insights

                       63
                                 SAY HELLO!
OVE RVIE W
A MESSAGE
FROM OUR CEO
Jonny Murch Welcome to the 4th edition of the #SportOnSocial How?
CEO, Redtorch
League Table — a ranking of 35 IOC-recognised
Our team of experts harnesses the power of data to
International Federations (IFs) according to their
provide invaluable market intelligence and
social media performance in 2019.
communications that are culturally relevant, timely
and inspiring.
Many variables impact the results each year — the
event calendar being a crucial one.
The outcome?
Redtorch believes a data-inspired creative Our programmes win hearts and minds, build brands,
approach between events, using ‘non-competition’ and help develop long-term audience relationships.
“
campaign narratives, will attract new audiences and
build stronger relationships with fans worldwide. We hope the #SportOnSocial League Table Report
2020 inspires you to improve the performance of
The time between events is important for IFs to your IF on social media.
Our motivation is simple: help sport
grow their inspirational role, engage more people
to promote its unique experiences, values Enjoy!
with healthy activities and use their influence to
and opportunities around the world.
“ encourage positive social impact.
What do we do?
We specialise in understanding audiences, enabling
us to design bespoke solutions that improve how
your sport, event or brand is regarded.
02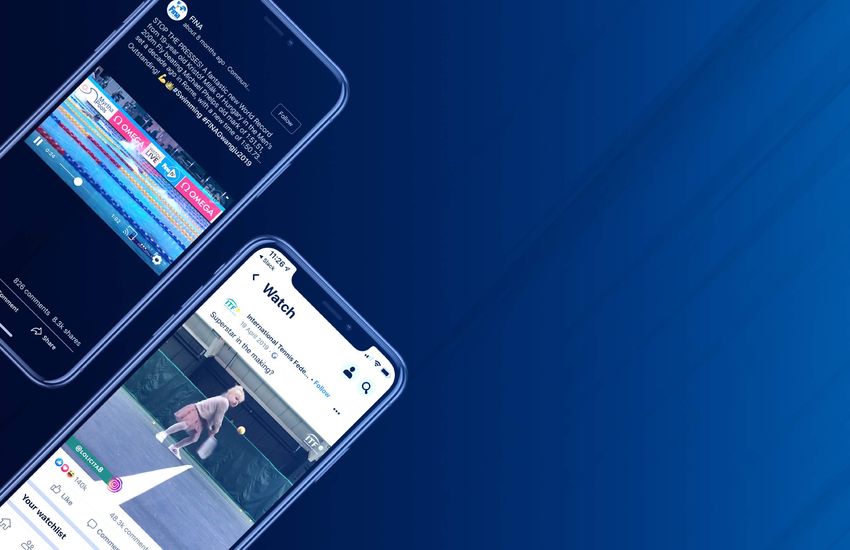
OVE RVIE W
METHODOLOGY
Data analysis period:
1 January – 31 December 2019
We analysed IFs’ main page/handle and discipline-specific or World We analysed open source data so couldn’t determine whether Engagements
Championship pages/handles. and Views were Organic or Paid.
The League Table ranks IFs on their performance across Facebook, The League Table includes AIBA.
Instagram, Twitter and YouTube.
*NEW*
Specifically, we analysed the following metrics:
Insight from the recent #SportOnSocial Survey 2019 enabled us to weight
Total Fans each social media channel as follows:
Absolute Growth Facebook (30%)
Instagram (30%)
Growth Rate
YouTube (25%)
Engagement Rate* Twitter (15%)
Total Engagements
Fig.1 FIFA often skews data and has therefore been excluded from certain
Engagements per Post analysis.
Total Views
When we provide % increases and decreases, these compare 2019 results with
Views per Video
those from 2018.
*Engagement Rate = no. of post engagements divided by no. of fans.
DISCLAIMER: Redtorch cannot guarantee the accuracy of analysis of #SportOnSocial and disclaims all warranties —either express or
implied — including warranties for merchantability, and fitness for any particular purpose.
03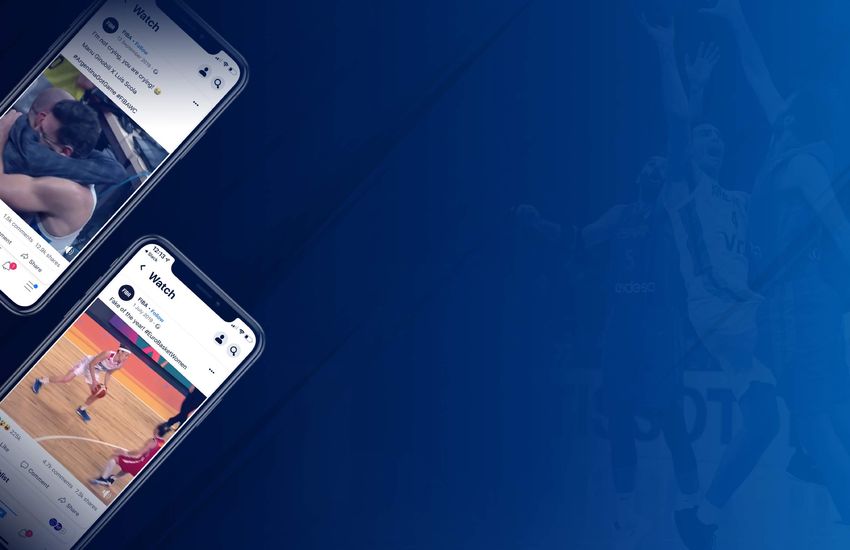
OVE RVIE W

     #SPORTONSOCIAL
     League Table 2020
                                                                                                                         Overall Ranking across 4 social media platforms

     INTERNATIONAL FEDERATION                                             2020   2019   CHANGE   INTERNATIONAL FEDERATION                                2020   2019   CHANGE

     FIBA              International Basketball Federation                 2      2      1       IHF     International Handball Federation                19     21    2
     WR                World Rugby                                         3      3      1       FIG     International Gymnastics Federation              20     17    3
     FIVB              International Volleyball Federation                 5      5     2        IBU     International Biathlon Union                     21     16    5
     BWF               Badminton World Federation                          4      12    8        IIHF    International Ice Hockey Federation              22     19    3
     World Athletics   World Athletics                                     5      6      1       AIBA    International Boxing Association                 23    34     11
     FIFA              International Federation of Association Football    6      1     5        WT      World Taekwondo Federation                       24    22     2
     ITTF              International Table Tennis Federation               7      4     3        ITU     International Triathlon Union                    25    23     2
     FEI               International Federation for Equestrian Sports      8      8     0    -   FISA    World Rowing Federation                          26    28     2
     IJF               International Judo Federation                       9      9     0    -   WS      World Sailing                                    27    29     2
     FINA              International Swimming Federation                   10    24     14       WCF     World Curling Federation                        28     26     2
     UWW               United World Wrestling                              11     13    2        FIE     International Fencing Federation                 29    27     2
     ISU               International Skating Union                         12     11    1        ICF     International Canoe Federation                   30    30     0      -
     UCI               International Cycling Union                         13     7     6        ISSF    International Shooting Sport Federation          31    25     6
     IWF               International Weightlifting Federation              14     18    4        FIL     International Luge Federation                    32    32     0      -
     FIS               International Ski Federation                        15     14    1        UIPM    International Modern Pentathlon Union            33     31    2
     FIH               International Hockey Federation                     16     10    6        IBSF    International Bobsleigh & Skeleton Federation    34    33      1
     WA                World Archery                                       17     15    2        IGF     International Golf Federation                    35    35     0      -
     ITF               International Tennis Federation                     18    20     2

04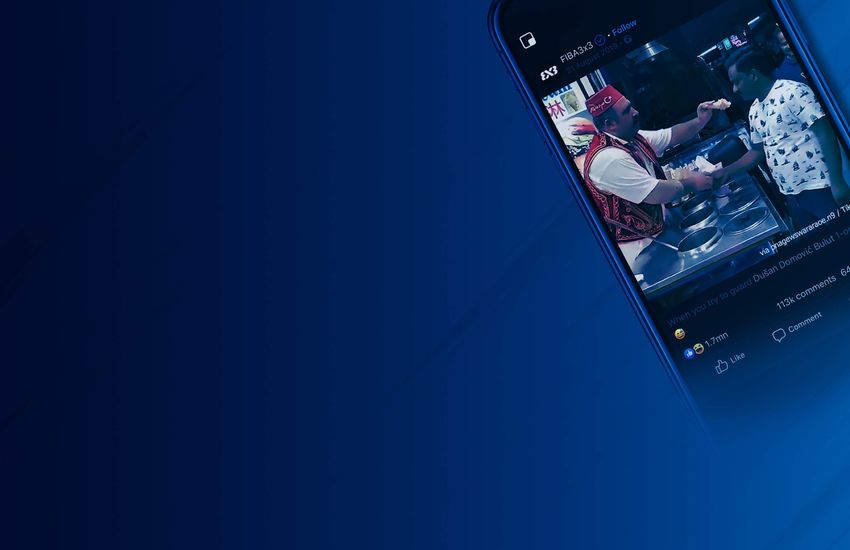
OVE RVIE W
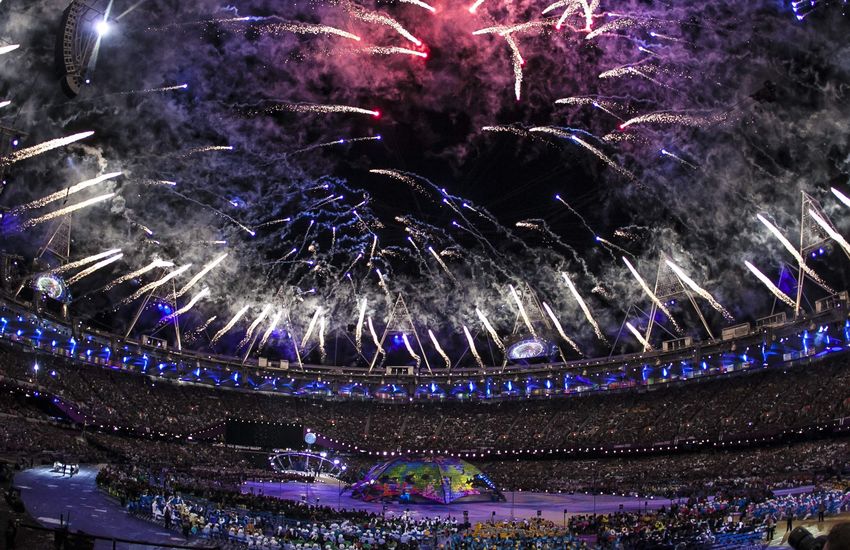
FIBA BWF
Took Overall Win Jumped to #4 Overall
The 2019 FIBA Basketball World Cup helped Launching an Instagram account before
Ollie Davis FIBA rank #1 overall whilst remaining 1st on the 2019 BWF World Championships
Head of Facebook, 2nd on Instagram and climbing to contributed to BWF’s jump from #12 to #4
Research & Insight 2nd on Twitter. overall.
WR FINA
“
Ranked #1 on Instagram Made Biggest Improvement
It was another incredible year for IFs 890k new fans, 46m+ engagements and The 2019 FINA World Aquatics
on social media, with some great success 186m+ video views ensured WR climbed Championships guaranteed FINA climbed
stories and highly engaging campaigns. 2 places to #1 on Instagram. 14 places to #10 overall and accounted for
Here are my headlines from the Report.
“ 52% of their new Facebook fans and 40% of
video views.
World Athletics ISU
OLLIE’S Took #1 on YouTube
Live streaming the 2019 World Athletics
Remained Highest Ranked Winter IF
Live streaming the 2019–20 ISU Grand Prix
HEADLINES
Championships to 150+ territories enabled of Figure Skating resulted in ISU climbing 5
World Athletics to climb 3 places to #1 on places on YouTube and remaining the highest
YouTube. ranked winter IF overall.
05
PLATFORM TRENDS
P L AT FO R M T R E NDS

     TOTAL FANS INCREASED BY                          15%
      Total fans per platform
                                          155.5m          total fans

              10%

      18%                                  +42%                               54%
                                    54%    growth rate on Instagram -
                                           higher than any other platform
                                                                              of all fans are on Facebook
                                                                              (58% in 2018)

        18%

                                           +2.3m                              YouTube’s growth fell from

                                                                                        3.8m
              Facebook    Twitter

              Instagram   YouTube          new Twitter followers, less than   7.0m to
                                           any other platform

07
P L AT FO R M T R E NDS

                                          INSTAGRAM FOLLOWERS INCREASED
                                                 MORE THAN ANY PLATFORM

              Total growth per platform                                          Average growth rate per platform

     Growth Rate
                                                                         Platform

       9.0m
                   8.1m
       8.0m                                                          Instagram                                                                41.6%
       7.0m

       6.0m
                             5.1m                                     YouTube                                                   30.6%
       5.0m
                                       3.8m
       4.0m
                                                                       Twitter                   9.1%
       3.0m                                      2.3m

       2.0m
                                                                     Facebook                 6.5%
       1.0m

       0
                                                          Platform                                                                                    Growth Rate

               Instagram   Facebook   YouTube   Twitter                             0%   5%    10%      15%   20%   25%   30%     35%   40%      45%

08
P L AT FO R M T R E NDS

     TWITTER REPRESENTED                       49% OF ALL POSTS
      Posts by Platform

                         14%                    246k     posts analysed — 10% increase

                                         23%    121k   tweets — 1% decrease

     49%                                        36k   Instagram posts — 23% increase

                                    14%
                                                33k   YouTube videos — 18% increase

             Facebook          Twitter

             Instagram         YouTube
                                                56k   Facebook posts — 3% increase

09
P L AT FO R M T R E NDS
434.8M ENGAGEMENTS
ACROSS ALL PLATFORMS
Engagements by Platform
5% 2%
434.8m total engagements — 13.8m increase
18%
325.2m Instagram engagements — 119% increase*
79.9m Facebook engagements — 118% increase*
75%
22.1m Twitter engagements — 108% increase*
Facebook Twitter
Instagram YouTube
*Please refer to Fig.1 in Methodology
10P L AT FO R M T R E NDS
INSTAGRAM’S ENGAGEMENT RATE
WAS THE BEST OF ANY PLATFORM
Engagement Rate by Platform
Platform
Instagram had the
highest average 3.5%
0.4%
3.5%
Instagram Facebook’s engagement
3.5%
rate dropped from 0.6% to
0.6%
Facebook
0.4%
An increase in overall subscribers and working with
0.1%
Youtube influencers helped increase YouTube’s average
0.2%
0.2%
engagement rate to
0.2%
Twitter
0.2%
Engagement
0.0% 0.5% 1.0% 1.5% 2.0% 2.5% 3.0% 3.5%
Rate IFs using Twitter for live updates, short highlight clips
and to drive website traffic ensured the platform’s
engagement rate remained the same
2018 2019
11P L AT FO R M T R E NDS
VIDEO VIEWS INCREASED BY 17%
Video views on Facebook, Instagram and YouTube increased
17% to 3.8bn Video Views per Platform
Video Views
Facebook accounts for 53%
of video views as a result
of (i) having the most fans and (ii) a 25% increase in video
2.5bn 2.0bn
2bn
1.5bn
Video views on Instagram increased by 93% to over 900m 1bn
887.9m
900.7m
500m
64% of Instagram content includes video
0
YouTube Instagram Facebook
Platform
72% increase in YouTube video views*
*Please refer to Fig.1 in Methodology
12FAC E BO O K
TOP 10
INTERNATIONAL FEDERATION 2020 2019 CHANGE
FIBA International Basketball Federation 1 1 0 -
BWF Badminton World Federation 2 7 5
FEI International Federation for Equestrian Sports 3 2 1
FIVB International Volleyball Federation 4 4 0 -
WR World Rugby 5 5 0 -
ITTF International Table Tennis Federation 6 6 0 -
World Athletics World Athletics 7 18 11
IWF International Weightlifting Federation 8 11 3
FIH International Hockey Federation 9 8 1
ITF International Tennis Federation 10 13 3
14FAC E BO O K
FIBA GENERATED 5.6X MORE
VIDEO VIEWS THAN THE AVERAGE IF
2.8 average number
of daily posts
0.5% increase
890 engagements
per post
38% 35% increase
of posts were photos
FIG (71% photos) and
44k views
per video
15%
FIFA (62% photos) average growth 91% increase
went against this trend
0.4%
rate in 2019 average
engagement rate
12% average growth rate in 2018
0.6% engagement rate in 2018
15FAC E BO O K
SUMMER IFS EXPERIENCED
15% GROWTH RATE
Growth Rate by Olympic Tier
Winter IFs
8%
Growth Rate
25% growth rate
21%
20%
16%
15%
15%
11% 12%
10% 8%
Tier B IFs with World Championships
5% Summer IFs had highest every 4 years experienced
0%
Olympic Tier growth rate 21%
an average
growth rate of 18%
Winter IFs A B C D E
IFs with annual World Championships
Tier D
9%
Followed by
Summer IFs with a growth saw a growth rate of
rate of 16%
16FAC E BO O K
FEI INCREASED ITS NUMBER OF
FANS BY 70%
Growth Rate by IF
FEI gained 613k
Growth Rate
80%
new fans
70% A 70% growth rate — higher than any other higher IF — due to discipline-specific pages and
data-driven creative campaigns at key equestrian events
60%
43% 42% 39%
525k new fans
40%
31%
FIVB attracted
20% A growth rate of 42% — 3rd highest — with June accounting for 32% of total growth due to
the 2nd edition of Men’s and Women’s 2019 FIVB Volleyball Nations League
0%
IF
FIBA amassed 2.3m new fans
FEI BWF FIVB ITF IHF
The 2019 FIBA Basketball World Cup’s opening week in September resulted in FIBA’s largest
weekly increase
17FAC E BO O K
10 WAYS TO “
We took learnings from 2018 to better adapt our
ENGAGE FANS content and strategy to the needs of each audience.
ON FACEBOOK
Strong results showed the positive impact on our reach
and engagement with the target audience;
this gave impetus to a continued focus on agile
Live coverage
content development.
Inspirational stories
Track / arena / stadium guides Combined with a focused paid strategy, we achieved
Athlete interviews strong follower growth and audience engagement
throughout 2019. We built on the year-on-year
Memes
success of new pages and paved the way to expansion
Winning moments onto other platforms.
“
Award ceremonies
Record-breaking moments
Alice Permain
Awareness campaigns Sports Content Manager, Broadcast & Digital
FEI
Compilation videos
18FAC E BO O K
IFS POSTED AN AVERAGE
2.8x PER DAY
Posts by Type
4%
48% of posts were video Summer IFs posted 2.8x per day
13%
35% of posts were photo 12% more than Winter IFs, who
posted 2.5x per day
48%
51% of content produced by ITTF posted 8.6x per day
35% Summer IFs was video more than any other IF
with frequency spiking at the 2019 World
Table Tennis Championships in April
Video Link 37% of content produced by
Winter IFs was video
Photo Other
19FAC E BO O K
VIDEO WAS KEY TO
ENGAGING FANS
Engagement Rate by Post Type
Post Type
0.4% average engagement rate of posts with video
Video 0.4%
0.2% higher than posts without video
Link 0.2%
Photo 0.2%
0.5% engagement rate on content posted by Winter IFs
0.2% higher than posts by Summer IFs
Other 0.1%
Engagement
Rate
0.0% 0.1% 0.2% 0.3% 0.4% 0.5%
20FAC E BO O K
REACTIONS
DOMINATED ENGAGEMENT
87% of engagements are Reactions
Followed by Shares (9%) and Comments (4%)
10% of ITF’s engagements were Comments
More than any other IF, partly due to one video generating 48k comments
11% of FINA’s engagements were Shares
More than any other IF, and was a result of viral world-record videos from
the 2019 FINA World Aquatics Championships
21FAC E BO O K
FACEBOOK ACCOUNTED FOR
OVER 2BN VIDEO VIEWS
Average Views per Video by
Olympic Tier
88% of views (1.8bn) from owned videos
and 12% of views (255m) from shared videos Video Views
120k
110.3k
Winter IFs had a greater reliance on shared videos 100k
with shared videos totalling 14% of their total video views (11m) 80k
but only 6% for Summer IFs (243m video views)
61.6k
60k 53.5k
39.4k
110k
40k
Tier B IFs generated views per video 20k
17.2k
8.1k
More than any other Tier and followed by Tier C IFs with an average
of 61k views per video 0 Olympic Tier
Winter IFs A B C D E
22FAC E BO O K
FIBA GENERATED 31% OF
ALL VIDEO VIEWS
FIBA’s 22k videos generated 631m views across its Facebook pages
FIBA’s 3x3 page featured a meme with the Serbian Basketball player Dušan Bulut that generated
195m views
The Rugby World Cup page generated 52% of its total video views during the 2019 tournament
The page’s mix of content — including players embracing new cultures, match highlights and emotive
clips — resulted in a total of 140m video views
23FAC E BO O K
FIBA INSIGHTS
FACEBOOK IS A CENTRAL PART OF FIBA’S DIGITAL ECOSYSTEM
Facebook is the bulk of our audience outside China. It’s the bread and butter of our social media distribution chain and where we
reach our biggest numbers.
Who is your most highly engaged audience on Facebook?
Asia in general is still very Facebook-centric (outside of China obviously, and Japan). A majority of our audience are avid
basketball fans from the Asia-Oceania region.
José Pages
Digital Content Manager Europe
FIBA How do you balance video content between Facebook and YouTube?
YouTube used to be the place where we put all long-form content; Facebook was where we placed visuals and short videos.
Nowadays, with the introduction of Facebook Watch, our approach to the two platforms has become more similar with the
posting of long-form content. Livestreaming (non-sold properties) is also an important feature of both platforms.
What role does video play in your Facebook content strategy?
A dominant one — the vast majority of our content is video.
What video metrics do you look at?
Views, engagement and overall interactions.
What type of video does your audience engage with most on Facebook during event-time?
It used to be ‘spectacular’ plays. Now it’s player and game highlights or mainstream/feel-good moments not necessarily directly
related to basketball.
24FAC E BO O K
How did you use video to engage your audience on Facebook during the
2019 FIBA Basketball World Cup?
To showcase the best moments of the competition and paint a picture of FIBA Basketball World Cup heroes.
What learnings will you implement for Tokyo 2020 to engage new fans in
basketball?
The Olympics are a bit tricky — not being allowed to use video content can prove quite a challenge. We will use
beautiful static imagery to promote our sport to a wider audience and take the opportunity to feature some of the
biggest overall stars of the Games.
What type of video does your audience engage with most on Facebook outside
of event-time?
Timeless content / archive footage from previous events or from basketball’s stars tend to be most popular.
Impressive and out-of-the-ordinary user-generated content also does well.
What are the main challenges you face with video?
Producing a large number of videos to stay ahead of the curve requires additional work and more attention to detail
than, for example, using pictures or link posts. Focusing on video slightly shifted the way we worked as we had to
take on more freelancers capable of editing videos or following the Games.
What are your objectives for video in your 2020 Facebook strategy?
To keep increasing our numbers, although it might be difficult to reach 2019’s metrics without a World Cup this year.
25INSTAGR AM
TOP 10
INTERNATIONAL FEDERATION 2020 2019 CHANGE
WR World Rugby 1 3 2
FIBA International Basketball Federation 2 2 0 -
FIVB International Volleyball Federation 3 6 3
World Athletics World Athletics 4 4 0 -
FIFA International Federation of Association Football 5 1 4
BWF Badminton World Federation 6 - - -
UWW United World Wrestling 7 5 2
AIBA International Boxing Association 8 33 25
FINA International Swimming Federation 9 15 6
ITTF International Table Tennis Federation 10 10 0 -
27INSTAGR AM
SUMMER IFS EXPERIENCED
A GROWTH RATE OF 77%
Growth Rate by
World Championship Event
Winter IFs growth rate 40%
Growth Rate
250%
IFs with World Championships every 4 years had
200%
205%
average growth rate of 205%
This is partly a result of WR’s growth rate of 603% and FIBA’s growth rate of 119%
150%
100%
59% 66%
50% 38% IFs with World Championships every 2 years
Frequency
61k
of World
0% Championship
event averaged new fans
No World Every 2 years Every 4 years Every year
Championship this was 1.8x higher than IFs with an annual World Championships, which averaged
33k new fans
28INSTAGR AM
FIFA ATTRACTED 4.4M NEW FANS –
MORE THAN ANY OTHER IF
Growth by IF*
Follower Growth
FIFA had growth rate of 36%
Contributing factors included the FIFA Women’s World Cup, nominees
500k for the FIFA Puskás Award and The Best FIFA Football Awards
445.5k
400k
300k
253.4k
Rugby World Cup page saw number of fans grow by
during the tournament’s opening two weeks
22%
190.1k 22k new fans were generated on the tournament’s 2nd day when
200k
151.3k New Zealand played South Africa
121.7k
0
69k
IF
WR FIBA FIVB World UWW
Athletics AIBA had 2nd highest growth rate with new fans
30% of their new fans came during the 2019 AIBA World Boxing Championships
*Please refer to Fig.1 in Methodology
29INSTAGR AM
CAROUSEL POSTS
HAD HIGHEST ENGAGEMENT
RATE ON INSTAGRAM
Carousel posts accounted for 25% of all posts — an increase of 17%
1.7 average number of
carousel posts per day
6% increase
69% average
growth rate
47% average growth rate in 2018
6k engagements
per post
3% increase
3.5%
No change
average
engagement rate
26 IFs used IGTV
an increase of 13, with BWF posting 356 times (more than any other IF)
which represented 26% of their total content
30INSTAGR AM
10 WAYS TO “
FIS is fortunate to have a sport that produces spectacular
ENGAGE FANS and unique visuals which is very well suited to Instagram.
ON INSTAGRAM
We always try to ensure that our posts are eye-grabbing,
which makes our followers stop scrolling through their
feeds to have a closer look at our posts, which ultimately
Emotion
drives engagement and helps further promote skiing. “
Inspire
Humour
International awareness days Jenny Wiedeke
Communications Manager
Social media trends FIS
Short highlights
User-generated content
Influencers
Pop culture / memes
Infographics
31INSTAGR AM
VIDEO REMAINED
THE MOST POPULAR FORMAT
Posts by Type 40% of Instagram posts were video
7%
17% 43% of Winter IF posts were photos
34% of Summer IF posts were photos
40%
Summer IFs posted 1.9x per day
36% more than Winter IFs who posted 1.4x per day
36%
Video
Photo
Carousel
IGTV
ITTF posted8.6x a day — more than any other IF
Frequency spiked during the ITTF World Tour and the 2019 Pan American Games in August
32INSTAGR AM
TIER E IFS ACHIEVED HIGHEST
AVERAGE ENGAGEMENT RATE
Engagement Rate by Olympic Tier
Engagement Rate
6.0%
5.0%
4.2% 4.1%
5.1%
Tier E IFs had the highest
average engagement rate 5.1%
Followed by Winter IFs with an average engagement rate of 4.2%
4.0%
3.1% 2.9%
3.0% 2.2%
2.0%
1.0%
0%
Summer and Winter IFs had
an average engagement rate of 4.4% on Carousel posts
Olympic Tier All other content averaged an engagement rate of 3.5%
Winter IFs A B C D E
Engagement Rate by Post Type
Post Type
IFs with World Championships every 2 years
had an average engagement rate of 4.0%
Carousel 4.4% IFs with annual World Championships generated an engagement rate of 3.8%
Video 3.5%
Photo 3.5%
Engagement
Rate
0.0% 1.0% 2.0% 3.0% 4.0% 5.0%
33INSTAGR AM
CAROUSELS AND PHOTOS ACHIEVED
MORE ENGAGEMENTS THAN VIDEO POSTS
Engagements per Post
95% of all engagements were on posts by Summer IFs Engagements
3.4x more engagements per post than Winter IFs 25k
20.0k
20k
Tier B IFs generated an average of
more engagements per post
2.8x 15k
10k
5.3k 4.9k
4.8k
5k
2.1k 2.9k
46.9m
0
Olympic tier
engagements generated by WR Winter IFs A B C D E
34INSTAGR AM
ENGAGEMENTS
ITU generated the highest proportion of Comments compared to Likes,
partly due to ITU’s ’12 Days of Christmas Giveaways’ where fans tagged friends
to enter
FIFA’s most popular content was dominated by The Best FIFA Football
Awards 2019
Its top 3 pieces of content (i) The Awards’ shortlist (ii) Awards Finalists
(iii) Winners Announced
WR achieved the 3rd highest number of Comments
Content from the Rugby World Cup Final generated the most engagements,
however 3 of the top 5 posts by Comments were reactions to the nominees for
the WR Annual Awards
35INSTAGR AM
BWF CAPITALISED ON IGTV
Video Views by IF
IF
BWF created the most content for IGTV
BWF’s total views on IGTV reached 13m — 40% of BWF’s total video views FIFA 205.6m
on Instagram
WR 186.2m
FIBA 122.8m
6.2x
FIVB 121.8m
Summer IFs generated more video views than Winter IFs ITTF 48.0m
Tier B and Tier E IFs generated 2.9x more video views than average
BWF 32.9m
UWW 28.3m
900m
World Athletics 24.6m
Video views on Instagram exceeded IJF 18.4m
4 IFs generated over 100m video views:
FIFA (206m); WR (186m); FIBA (123m); FIVB (122m) FIS 13.8m
Video Views
- 50m 100m 150m 200m 250m
36INSTAGR AM
ITF MADE THE MOST OF
ITS BIGGEST STAR
ITF’s #MyCourt campaign went viral
One video featuring a young athlete watching — and learning from — Roger Federer
has over 1.4m views
FIS accounted for 38% of all Winter IF video views
December-March made up 73% of FIS’ total video views, highlighting the challenge
of creating content all year round
FIVB created the most videos
with their 2k videos generating 118m views — the 4th highest number of views
37INSTAGR AM
WR INSIGHTS
MAKING THE MOST OF INSTAGRAM’S THREE CHANNELS
Instagram is one of social media’s most versatile platforms.
It offers 3-platforms-in-1 with (1) a main feed (2) Instagram Stories and (3) IGTV. This versatility presents both opportunities
and challenges. When planning our content, how can we best divide it between the three platforms?
Here’s our approach…
James Bass 1. Instagram main feed: Timeless content
Social Media Manager
We don’t use the Instagram main feed to post real-time match updates. Our feed is a place to tell stories and display key art —
WR
it needs to feel timeless.
Content that works really well isn’t always tournament specific — value-led content also hits the mark and taps into the World
Rugby ethos: e.g. Players interacting off the pitch, sharing a beer and swapping shirts.
2. Instagram Stories: Player-led content
Instagram Stories is predominantly about behind-the-scenes content during events. The ultimate insight for fans? Putting the
phone into a player’s hands and letting them take over. This tactic drives high engagement and creates content we can’t get
from anywhere else.
The recent Rugby World Cup is a great example of this approach in action — especially as in Japan players are treated more
like the sort of superstars associated with the NBA and NFL. Forget graphical templates. Hearing from a winning captain
immediately after a game is the best way to convey emotion and atmosphere; it breaks down barriers between World Rugby
followers and players — strategically that’s the sweet spot!
Using voting mechanisms is also a real driver of engagement — especially when there isn’t a current match or tournament. For
example, our successful knock-out at the end of 2019 led to fans choosing New Zealand’s Dan Carter as fans’ player of the decade.
38INSTAGR AM
3. IGTV: Long-form content
IGTV is our YouTube equivalent for long-form content. We include highlights and coverage from press
conferences — and at our top-level tournaments we always apply subtitles in multiple languages to
give fans the best possible user experience.
A final thought: Optimising resource to achieve full impact
We put heavy emphasis on multi-language content. Growing our four core language channels —
English, Spanish, French and Japanese — is a key World Rugby objective.
Four languages, three Instagram platforms, different tournament accounts… it all becomes a pretty
big pull on resource!
We meet regularly with our social community managers based in the UK, Argentina, France and
Japan. These experts work closely with camera operators and content production agencies to
create bespoke content from live events.
During Rugby World Cup 2019, tournament-specific content sat predominately on the Rugby World
Cup account. Additional content giving in-depth insights into the players sat on the World Rugby
account. And sometimes, to manage the challenge of serving content to fans across different time
zones, we’d duplicate content on both accounts at different times.
Always at the forefront of our mind? ‘How can we localise this?’ Think 4 languages, not 1.
39T WIT T E R
TOP 10
INTERNATIONAL FEDERATION 2020 2019 CHANGE
BWF Badminton World Federation 1 1 0 -
FIBA International Basketball Federation 2 3 1
ISU International Skating Union 3 2 1
WR World Rugby 4 7 3
FIVB International Volleyball Federation 5 8 3
ITTF International Table Tennis Federation 6 6 0 -
UCI International Cycling Union 7 4 3
FIFA International Federation of Association Football 8 5 3
World Athletics World Athletics 9 11 2
FINA International Swimming Federation 10 14 4
41T WIT T E R
IFS EXPERIENCED
DOUBLE DIGIT GROWTH
5.6
average number of
daily tweets
Down from 5.8 tweets per day
105 engagements
per tweet
17%
average
growth rate 24% increase
16% average growth rate in 2018
Video or image feature in
Retweets account for
65% of all tweets
0.2% average
growth rate
24% of all engagements
62% increase
No change
42T WIT T E R
SUMMER IFS TWITTER
GROWTH OUTPERFORMED THEIR
WINTER COUNTERPARTS
Summer IFs saw 10.3x more growth on Twitter than Winter IFs
Growth Rate by Olympic Tier
20%
16% 16%
Tier B and Tier C IFs experienced highest growth rate —
Followed by Tier A IFs with growth rate of 14%
16% 15%
12%
14%
13% 13%
10%
5%
20%
0%
growth for IFs with World Championships every 4 years Winter IFs A B C D E
8% growth for IFs without quadrennial World Championships
43T WIT T E R
THE KEY TO GROWTH?
MORE CONTENT
IHF experienced the highest growth rate
IHF had a growth rate of 56%, with content production
peaking at 68 tweets per day during January’s 2019 World
Men’s Handball Championship
BWF saw 2nd highest growth rate on Twitter
BWF saw its growth on Twitter jump 38%, experiencing substantial
growth during months with a high volume of fan retweets
ISU was the Winter IF with the highest growth rate
ISU had a growth rate of 22%, with content production peaking
at 19 tweets per day during March’s 2019 World Figure Skating
Championships
44T WIT T E R
10 WAYS TO “
Current, easy to share, snackable content is at the core of the
ENGAGE FANS International Skating Union’s strategy.
ON TWITTER We increased our output especially in video form on all social
media platforms during the 2019/20 season.
Twitter enables us to expand and amplify our reach among a
large and organic target audience.
Birthday messages
Providing ‘backstage access’ to major events and featuring our
Short highlights sport’s superstars lies at the core of our success on Twitter.
Athlete interviews
“
Fixture announcements
Score updates and results Andrès Duran
Digital Communications Coordinator
World ranking updates ISU
Throwback video
Award ceremonies
Humour
Record-breaking moments
45T WIT T E R
IFS TWEETED AN AVERAGE OF
9.8 PER DAY
Tweets
16%
Summer IFs tweeted 1.3x more than Winter IFs per day
IFs tweeting the most included FIFA, FIBA, WR, FIVB
The IFs tweeting the most govern sports that are more receptive to in-play
commentary and updates
FIFA Women’s World Cup page posted 37% of tweets during the tournament
Video or photo was included in 69% of 2.8k tweets posted during this period
84%
Summer Winter Summer IFs produced 101.4k tweets compared to 20.0k from Winter IFs
46T WIT T E R
ISU UTILISED STAR ATHLETES TO
ACHIEVE HIGHEST ENGAGEMENT RATE
Yuzuru Hanyu mentioned in ISU’s top 5 most engaging tweets
#FigureSkating featured in 85% of tweets, and half of tweets on the Figure
Skating page used the Japanese flag emoji
BWF generated one of the highest engagement rates
BWF used Twitter to (i) generate conversation during live broadcasts
and (ii) share athlete news outside of event-time
47T WIT T E R
FIFA GENERATED
806 ENGAGEMENTS PER TWEET
Engagements per Tweet
1k tweets
90%
Emojis were included in over of the most popular
900
806
800
Emojis led to increased fan engagements and add personality
700
597
600
42%
500
400
370
FIFA accounted for of all Twitter engagements 311
300
FIFA generated most of its 9.2m engagements across 3 highly
200 138 137 114
followed accounts: (i) @FIFAcom (ii) @FIFAWWC 105 90
100 80
(iii) @FIFAWorldCup
0
FIFA BWF WR ISU World ITTF FIBA FINA ITF IJF
Athletics
Over 340k
Emblem competition
votes were cast for FIFA World Cup
The competition asked fans to vote for the greatest FIFA World
Cup Official Emblem, and ran during the build-up to launching
the Official Emblem for the FIFA World Cup Qatar 2020
48T WIT T E R
BWF GENERATED
MORE RETWEETS PER TWEET
THAN ANY OTHER IF
BWF generated 174 Retweets per tweet
BWF capitalised on the World Mixed Team Championships to engage fans with a mix
of (i) near live clips (ii) highlights and (iii) breaking news
World Athletics engaged fans through different types of
emotive content
E.g: humorous highlight edits, voting in the Athlete Awards, inspirational stories
featuring older athletes, and powerful moments displaying true sportsmanship
FIBA resonated with all ages and focused on regional tournaments
Basketball’s global appeal is highlighted by Japan, Nigeria, Egypt and Spain all
featuring in FIBA’s most engaged with tweets
49T WIT T E R
BWF INSIGHTS
BOOSTING ENGAGEMENT ON TWITTER
Twitter is about immediacy and brevity.
Our Twitter coverage on @bwfmedia and @bwfscore therefore focuses on (i) Near Lives clips (ii) Highlights (iii) breaking news
and lives scores and (iiii) results.
We find Twitter behaviour to be regional specific and always keep our strategy focused: live — near live — breaking — current news.
Lloyd Green
Best practice for boosting engagement
Communications and Most of our video content is Near Live and Highlights, the best form of engagement is when fans become commentators and pundits.
Media Manager
BWF Our fans often watch live, and Twitter enables them to become part of the conversation — agreeing or disagreeing with
commentators on the live broadcast.
Engaging fans during event-time
Our Near Live clips of epic rallies or key moments generate the most engagement and views. Badminton is an incredibly
fast-paced sport so capturing these moments in bite-sized content works well!
While most fans follow individual athletes, Sudirman Cup — BWF’s 10+ day World Mixed Team Championships — encourages
national pride and enables friendly fan rivalries to play out on social media, particularly in Asia.
Engaging new fans at Tokyo 2020
The Olympics is the pinnacle of our sport.
Not owning video rights during the Games requires us to focus on results and breaking-news. We’re currently finalising our Tokyo
2020 Twitter Strategy and are excited to offer fans the most comprehensive Games coverage ever! One key area of focus? Convey
the atmosphere and vibe from Tokyo to our fans around the world.
50T WIT T E R
Engaging fans outside of events
Badminton fans love badminton, so uploading archive content performs amazingly!
Latest athlete news also generates huge engagement during times when there isn’t a live event.
Our recent and comprehensive content audit revealed fans want to connect with athletes on a more
personal level, so over the last 6 to 12 months we’ve worked on a new digital content approach to
maximise engagement outside of events. The new approach will impact the content across all social
platforms and focuses on posting user-generated content from fans and athletes.
Engagement challenges
Our biggest challenges include:
1. Customising Highlights and Near Live clips for Twitter (e.g. framing, length of video, cropping).
2. Creating content fans want — which requires an element of trial and error.
3. The high volume of new posts and consistent coverage is resource intensive.
Engaging fans in 2020
Adding visuals to live scores on @bwfscore is our biggest challenge in 2020. We’re therefore
utilising the latest technologies to produce automated and real-time graphical overlay on live scores.
51YOUTUBE
YO UT UBE

     TOP 10
     INTERNATIONAL FEDERATION                                             2020   2019   CHANGE

     World Athletics   World Athletics                                     1      4     3

     FIVB              International Volleyball Federation                 2      11    9

     WR                World Rugby                                         3      8     5

     BWF               Badminton World Federation                          4      3      1

     FIFA              International Federation of Association Football    5      1     4

     ITTF              International Table Tennis Federation               6      6     0    -

     FIBA              International Basketball Federation                 7      5     2

     IJF               International Judo Federation                       8      7      1

     WA                World Archery                                       9      13    4

     ISU               International Skating Union                         10     15    5

53
YO UT UBE
YOUTUBE
ENGAGEMENT RATE DOUBLED
50% average
growth rate
21%
38% average growth rate in 2018
increase in number of
videos produced
0.2% average
engagement rate
13 IFs each posted
over 500 videos
0.1% average engagement rate
in 2018
23k views
per video 18% increase
26k views per video in 2018
209 engagements
per video
5% increase
54YO UT UBE
TIER A IFS ACHIEVED
HIGHEST AVERAGE GROWTH RATE
Growth Rate by Olympic Tier
90% 85%
Summer IFs experienced growth rate of
Winter IFs saw growth rate of 33%
55% 80%
80%
70%
61%
60%
50% 45%
40% 34%
33%
Tier A IFs saw average growth rate of 85% 30%
20%
World Athletics experienced a growth rate of 147%
10%
0%
Winter IFs A B C D E
55YO UT UBE
IHF RECORDED HIGHEST
GROWTH RATE
FIFA experienced largest growth in subscribers
227k of FIFA’s 885k new subscribers came during the FIFA Women’s World Cup
BWF generated 2nd highest growth in subscribers
November’s China Open and Hong Kong Open helped BWF amass over 589k new
subscribers
The Rugby World Cup helped World Rugby attract 226k new subscribers
66% of its new subscribers came during the tournament
2019 Men’s Junior World Championship helped IHF achieve growth rate of
272%
56YO UT UBE
10 WAYS TO “
Weekly data analysis optimised our content production.
ENGAGE FANS
ON YOUTUBE With a new and adaptable digital framework implemented
in 2019 and a focus on engaging content, we were able to
quickly change our production for each platform and
provide the fans with what they want to watch.
Nation-specific content
Behind-the-scenes footage That is why we are developing in-house structure and
Extended highlights collaborating with state-of-the-art technologies that use
data to offer our fans a wide range of content, products
Inspirational videos
and services that are adapted to their needs. “
Influencers
Live coverage
Motasem El Bawab
Live draws Head of Digital
FIVB
Press conferences
Throwbacks
Athlete-focused compilations
57YO UT UBE
SUMMER IFS DOMINATED VIDEO VIEWS
Total Videos Views per Video
300,000
242,338
250,000
Summer
200,000
150,000
Winter
11% 100,000
93,820
79,740
53,704
33,923 29,181
50,000 25,781 22,096
17,269 17,064
0
89% FIFA BWF World WR FIVB ITTF IJF ITU FIBA WT
Athletics
Summer IFs produced 89% of all videos Summer IFs generated 28k views per video
Their 29.6k videos had 867m views and accounted 7x times more than the 4k views of videos posted by
for 98% of all video views Winter IFs
58YO UT UBE
FIFA WOMEN’S WORLD CUP
SHONE ON YOUTUBE
FIFA’s 233m video views accounted for 26% of all views
23 of the top 25 most viewed videos were highlights from the FIFA Women’s World Cup
The Rugby World Cup featured in 93 of the top 100 videos posted by WR
7.4m people watched England’s response to New Zealand’s Haka, making it WR’s most
watched video
BWF amassed 161m video views
Live coverage from the BWF World Championships resulted in 15 videos with viewing
figures over 1m
59YO UT UBE
FIBA ACCOUNTED FOR
11% OF VIDEO VIEWS
FIBA amassed 101m video views
Their two most watched videos were from ‘The World’s Got Game’ campaign
(i) #USAGotGame with 3.3m views and (ii) #HellasGotGame with 2.6m views
8 of the 25 most watched videos posted by World Athletics didn’t feature 2019 events
World Athletics generated millions of views by posting (i) full coverage and highlights of
London’s 2017 IAAF World Championships (ii) ‘Best Of’ — a series looking at top moments
in IAAF Diamond League history
ITTF generated 82m video views
2 of the top 3 most watched videos posted by ITTF were best shots of the year compilations.
Current Olympic and World Champion, Ma Long, featured in 30 of ITTF’s top 100 videos
60YO UT UBE
WORLD ATHLETICS INSIGHTS
ACCESS TO ATHLETICS FOR ALL
Laura Arcoleo Michael Lasserre
Senior Manager of Social Media Chief Editor and
and Fan Engagement Video Manager
2019 was a huge year for World Athletics as we unveiled our new name and logo. We used the rebrand to relaunch our YouTube account with original and exclusive
content such as the World Athletics Club. The aim was to service our entire fanbase with as much access to athletics as possible.
The objectives of our 2019 YouTube strategy were threefold:
1. As much live video content as possible
2. As much exclusive content as possible
3. Make the most of archive footage
Our YouTube audience is diverse because we produce different types of video to cater for multiple audiences. Dynamic short-form videos, such as highlight videos,
attract our core audience of 18-24 and 25-34 year olds, while long-form videos, such as documentary-style videos using archive footage, attract an older audience.
Anchoring archive footage to key moments
Athletics is one of the oldest sports in the world. We have a lot of history, plenty of archive footage and many stories to tell.
We created a long-form video playlist with footage from the 1991 World Athletics Championships in Tokyo to leverage interest in the 2020 Olympic Games and the
fact the 1991 Championships took place in the same city.
We launched the playlist to coincide with the opening of the new Olympic Stadium in Tokyo with the aim of tapping into the buzz of this Olympic moment. The
playlist performed well. It engaged our core fans already interested in the upcoming Games, and it resonated with an older audience who remember watching the 1991
event and recall where they were on that day.
61YO UT UBE
Getting creative with live content
We sell the live broadcast rights to our World Championships to enable our sport to be seen on live and terrestrial television
around the world. The challenge is we can only show live content on our own channels in territories where the rights have
not been sold. But our ambition is to offer the same level of live access to the whole world.
This has given us the opportunity to become more creative. We created the World Athletics Club, an exclusive and innovative
in-house production featuring event highlights, athlete interviews, exclusive behind-the-scenes access and more. Via the
World Athletics Club which aired on the World Athletics YouTube and Facebook page, we were able to provide a live element
from the World Championships around the world every day without geo-blocking.
We used this approach for other World Athletics Series events in 2019, and plan to use it for our 2020 events too.
Consciously cross-promoting content
There was a conscious effort to cross-promote content. Everything we did on YouTube was highlighted and advertised on
our other channels. We used our Facebook and Twitter handles extensively.
We identified a trend in how Facebook could support long-form videos. Our World Athletics Club content also sits on
Facebook but we used different edits, and encouraged our audience to follow us on YouTube for more extensive edits such
as behind-the-scenes video.
Most of our content on YouTube was also reshaped and repurposed for Instagram. However, because Instagram is a unique
platform with different formats and shorter video lengths, there was a focus on more trailer-style videos.
The glue that holds it together
Our YouTube channel is the glue that holds all our platforms together. Video is our best-performing content which is why we
put all our effort into making YouTube the central point of reference for our fans.
Video drives our fans, so we want to offer as much of it as possible to all our fans and followers, including federations and
athletes.
In 2020 we want to experiment with different types of content. We have plans to explore more cinematic-style videos and
artistic, long-form documentaries. And not just for our YouTube channel — though YouTube will be the start of it.
62CO NTAC T
SAY HELLO!
Redtorch is an independent sports marketing agency based in London.
Our team of sport-obsessed data fanatics, strategic thinkers and creative communicators
grow and engage audiences with data-driven strategies and campaigns.
Call us +44 (0) 207 036 8080
Email us hello@redtorch.co
Visit us Unit 37, 1st Floor
Tileyard Studios
London, N7 9AH
Check out our NEW website: www.redtorch.sport
63 #SportOnSocial League Table Report © 2020You can also read