Shemaroo Entertainment Limited | Investor Presentation FEBRUARY 2020
←
→
Page content transcription
If your browser does not render page correctly, please read the page content below
1

    Shemaroo Entertainment Limited | Investor Presentation FEBRUARY 2020
2

    ABOUT SHEMAROO
3
     At a Glance

    Over 55 years experience as a household media                   One of the largest content houses with 3,900+         Offering content to most Bollywood services across
                        brand                                                       content library                                        leading platforms

     Offering content across Bollywood, Devotional,               Strong understanding of consumers’ entertainment         Extensive content offerings in multiple countries
    Regional, Comedy, Kids, Health and Lifestyle, etc.                                 needs                                              across the globe

                   REVENUE                                      EBITDA                                          PAT                              NETWORTH
                     FY19                                        FY19                                          FY19                                 FY19
             INR   5,678 Mn                               INR   1,578 Mn                                 INR   830 Mn                         INR   5,717 Mn

          5 Year CAGR 16.50%                             5 Year CAGR 19.67%                          5 Year CAGR 25.00%                     5 Year CAGR 26.79%
4
       Overview
    • Founded in 1962 as a book circulating library, today Shemaroo Entertainment Limited (Shemaroo) is a leading Indian content power house with a global
      reach, headquartered out of Mumbai and employs over 600 people.
    • Shemaroo is a pioneer in content aggregation and distribution in India and globally with offerings spread across Television, Mobile, Internet, OTT, Preloaded
      devices, etc.
    • Identifying that movies have the longest shelf life for television and other media content, Shemaroo pioneered the movie library syndication business by
      acquiring movie titles from producers and distributing it to broadcasters and other media platforms.
    • Shemaroo has grown multifold over the years, developing excellent relationships across the media industry value chain, to become one of the largest
      organized players in a fragmented industry.
    • The company’s digital business contribution has grown from less than 10% in FY14 to over 30% in FY19.

      Operational Revenue (INR Mn) and EBITDA Margin (%)                                                    FY19 Revenue Distribution
                                28.71%    29.96%         29.16%
                    26.86%                                          27.79%
         24.30%
                                                         1,305       1,718
                                                                               20.46%                              Digital
                                            923
                                  635                                                                              media
                      373                                                      1,520
                                                                                                                    30%
           246                                                                                                               Traditional
                                                         3,586       3,960
                                 3,113     3,332                                                                               Media
          2,387      2,861                                                      2,384                                           70%

          FY14        FY15        FY16     FY17           FY18       FY19     9M-FY20
                  Traditional (INR)      Digital (INR)           EBITDA Margin (%)
5
    Key Milestones
                                                                                     Commenced
              Home                                         Evolved into a        distributing content                                     Launched
              Video                 Digital Post           content house          over digital Media            Got listed             ‘ShemarooMe’
           Distribution             production              by acquiring            platforms like             on BSE and                   OTT
             started                  started             perpetual rights             YouTube                    NSE                    application

    1962       1987         1993         2001         2003        2005        2008          2009        2012      2014          2018          2019

Started book          One of the first               Entered             Started content           Completed                 Refreshed the           Launched
 circulating             to enter                   Overseas             aggregation and            50 years                 brand identity     Pre-loaded devices
  library in            Broadcast                  markets for           distribution for                                    after 55 years      like Bhajan Vani,
  Mumbai               Syndication                 distribution          MVAS platforms                                                         Shrimad Bhagavad
                                                                                                                                                      Gita etc.
6
    Awards & Accolades

          Amazing OTT Newcomer             NASSCOM Awards, 2019 for     YouTube Diamond play
          Award at OTTV Mumbai             NASSCOM Awards, 2019 for     button for YouTube channel
          2019                             for Shemaroo Bhakti
                                           Shrimad Bhagavad Gita        Shemaroo Filmi Gaane
          ShemarooMe                       Audio Book

                                            Best Marketing Strategy   Best Brand Campaign for
             YouTube Diamond play button    in OTT at BCS Ratna       an OTT Platform- ScreenXX
             for YouTube channel            Award 2019                2019

             Shemaroo Entertainment         ShemarooMe                ShemarooMe
7
    Experienced Leadership
         Buddhichand Maroo - Chairman - He is founder of Shemaroo Group. He started the business with a book library in 1962 and gradually transformed it
         into a well-diversified corporate in the Media and Entertainment Sector. He has an experience of approximately 57 years, out of which, he has been
         associated for 36 years of experience in the Media and Entertainment Industry

         Raman Maroo - Managing Director - He has an experience of approximately 45 years, out of which he has spent around 36 years in the Media and
         Entertainment Industry. He has been instrumental in the Group‘s expansion into television rights syndication as well as transformation of Shemaroo
         into an established filmed entertainment content house. He has always remained the driving force in the Company, taking it into new directions.

         Atul Maru - Joint Managing Director - He has around 39 years of experience in the Media and Entertainment industry. He has managed the transition
         of the Company from VHS days to today’s multi-platform operations. He has been actively involved in the operations of the Company and has
         spearheaded various initiatives including the home video division of our Company

         Hiren Gada – CEO & CFO - He has been at the helm of driving the corporate & financial growth, digital direction, strategy, and the transformation of
         the company from a family run business to a professional corporate firm. He has approximately 23 years of work experience, out of which, he has
         around 16 years of experience in the Media and Entertainment Industry. After a successful stint in the financial sector, he joined Shemaroo. Hiren is an
         industry thought leader and brings a fresh perspective to the M&E space in India.

         Jai Maroo – Executive Director - He has experience in the technology industry in USA and Singapore and approximately 16 years of experience in the
         Media and Entertainment industry. He has worked with the leading firms in the technology industry at USA and Singapore. Given his strong technical
         background, he has catalysed Shemaroo’s expansion on digital distribution platforms such as Mobile, Internet, OTT etc. Currently, he is steering the
         Organization Transformation & Excellence portfolio for the Company.

         Kranti Gada Arambhan - Chief Operating Officer - Kranti heads the revenue function of the Company to drive extensive and sustainable growth. She
         joined Shemaroo in 2006 after a successful stint in the FMCG industry in the field of marketing at PepsiCo. She is instrumental in incubating the
         Company’s expansion into the DTH segment, digital media and international business verticals. She pioneered and set-up the Company’s mobile
         business and played a key role in the Company’s early adoption of digital platforms.
8
    Our Independent Board
          Gnanesh Gala - Independent Director - He has around 36 years of experience in the Educational Publishing Industry. He was the President
          (Finance) of Navneet Publications (India) Limited for more than 23 years and is presently the Managing Director of the said company.

          Dr. (CA) Reeta Bharat Shah - Independent Director - She has over 31 years of experience in the field of education and administration in
          various capacities. DR. CA Reeta is a Ph.D. from IIT Bombay, a member of Institute of Chartered Accountants of India, Masters in
          Philosophy, Masters in Commerce, Masters in Business Administration (HRM), Bachelors of Law (General) and Bachelors of Commerce
          (Hons.). She is engaged as Growth strategist, Tedx and International Keynote Speaker. She is presently the Head of Department
          (Accountancy) at SIES College of Commerce & Economics.

          Vasanji Mamania - Independent Director - He has around 57 years of experience in various industrial sectors including Film Processing,
          Civil Constructions, Heavy Engineering and Non-ferrous Metals. He was the Co-Founder of Adlabs. Mr. Mamania has handled
          responsibilities ranging from operations to financial planning and engineering inputs in design and processes.

          Shashidhar Sinha - Independent Director - He is a B.Tech from IIT Kanpur and is a post graduate from IIM Bangalore, India. He has over
          30 years of experience in media and advertising. He is presently the CEO of India-IPG Mediabrands. He is widely recognized for his
          strategic approach to media solutions across a wide portfolio of over 100 blue chip clients. He is actively involved and drives key industry
          bodies like the Advertising Standards Council of India, AAAI’s, Audit Bureau of Circulation, Readership Studies Council of India (RSCI), the
          Broadcast Audience Research Council India (BARC). He is also an honorable member of the prestigious Facebook India Client Council.

          Kirit Gala - Independent Director - He has completed his Masters in Business Administration and Mechanical Engineering from Mumbai
          University. He has around 29 years of business experience. Mr. Gala is the Managing Director of Gala Precision Engineering Private
          Limited. He has been guest speaker on various entrepreneurial and venture capital/private equity forums and has already been featured
          in some leading Business magazines for his expertise.
9
       Key Strengths
                                                                      Established Brand Name
                                           • Brand in existence for over 55 years
                                           • The “Shemaroo” brand has high consumer recall and media visibility

                  Diversified Distribution Platforms                                                   Vast, Diverse and Growing Content Library
    • Presence across television, digital media and other media                               • Most Bollywood services that require content would have at
    • Distribution reach is a key advantage, as company is able to                              least some content provided by Shemaroo
      offer “anytime anywhere” entertainment to consumers                                     • Content Library of more than 3,941 titles spanning Bollywood,
                                                                                                Devotional, Regional, Comedy, Kids, Health & Lifestyle, etc.
                                                                                              • Perpetual Rights of 1,195 films, of which 498 are Hindi

                   Strong Industry Relationships                                                     Experienced Directors and Management Team
    • Managed to create, maintain and build goodwill in the                                   • Strong management team with years of industry experience
      industry
                                                                                              • In-depth understanding of the film industry, deep insights on
    • Repeated transactions with known names – STAR, SONY,                                      technology and market trends
      Viacom 18, R.K. Studios, Tips Industries, Nadiadwala
      Grandson etc.
                                                                     De-risked Business Model
                                                     • Large number of titles
                                                     • Width and depth of distribution platforms
                                                     • Multiple genres and types of content
10

     CONTENT
11
The Business Model
Complete Ownership Rights In-House Creation Limited Ownership Rights
Perpetual Rights – Complete ownership rights Aggregate Rights - Rights limited by either
for distribution across all geographies, period of usage, platforms, geography or a
platforms, and perpetual periods combination thereof
• Hindi Films • Comedy
Content Library • Regional • Music
• Devotional • Special Interest Content
• Kids • Other Content
Monetisation Platforms
Traditional Media
Digital Media
Television Others
Youtube | OTT | Others
Satellite | Terrestrial | Cable | DTH In-Flight | Devices | Overseas, etc.12
Content Powerhouse
Shemaroo is one of the largest Indian Content Houses
Digital Media Traditional Media
5 year CAGR – 47.51% | 30% Revenue Contribution 5 year CAGR – 10.65% | 70% Revenue Contribution
Youtube Broadcasters:
Shemaroo Filmi Gaane, Shemaroo Ent, Shemaroo Zee, Sony, Star, Viacom18 etc.
Movies, etc.
Cable Operators:
Syndication Hathway, InCable, GTPL etc.
Amazon Prime, YuppTV, Mubi etc.
ShemarooME
INR 5,678 Mn D2H Operators:
Subscriptions with Tata Sky, Airtel TV, Dish TV
Mi TV, Apple TV, Roku, Amazon Fire Stick, Ixigo, Revenues
Dainik Bhaskar, Android TV, MX Player etc. (FY19) In-Flight Entertainment
Emirates, Qatar, Singapore Airlines, Etihad etc.
Telcos Partnerships:
Vodafone Play, Jio, Airtel etc. 3,900+ Content Titles Preloaded Devices
Shrimad Bhagavad Gita, Bhajan Vani etc.
1,195 2,746
Perpetual Titles Aggregate Titles13
Shemaroo’s Role In The Value Chain
Fragmented Production Houses One of the largest Content Houses Monetisation Platforms
Creates Value
There are many production Increasing the life of the movie and creating value for Requires unbundled and re-
houses/ content owners in India all the stakeholders bundled content with
with smaller content lot Convenient and Hassle Free customisation
For both Producers and Platforms, it is convenient to
deal with one aggregator rather than multiple players
Smaller content lot is difficult to Need a consistent flow of
unbundle Large Content Ownership content
Large content ownership gives Shemaroo an advantage
for unbundling and re-bundling of content
This fragmented market Premium Quality Requires clean and litigation
necessitates the need of a Offers quality content to platforms by adhering to free titles
content aggregator and robust selection criteria
distributor like Shemaroo
Legally Clean Titles High volume of content for
Offering undisputed titles diversified platforms to
Quality Content monetise
High quality source material with in-house upgradation
and restoration facility14
Shemaroo’s Role In A Movie Lifecycle
• Shemaroo typically participates in the second and subsequent cycles of film monetisation
• These subsequent cycles of film monetisation have been typically growing due to various factors like increasing advertisement
spends, digitisation etc.
• There is a lower risk in these cycles due to visibility of performance of movie during first cycle of launch
• Shemaroo decides on the cost of the content after it is confident of achieving the desired ROI at portfolio level
• Shemaroo then distributes this content over different platforms like Broadcasting channels & Digital Media platforms
Theatrical, Television and
overseas release generate ~80-
90%* of the revenues in the
first cycle of movie launch,
Revenue
where Shemaroo is not
typically present
Shemaroo is present in the
ancillary revenue streams like
digital Media & In-Flight movie
distribution, which contribute
towards the remaining 10 -
20%* of the revenues
* Industry estimates
First Cycle Second Cycle Third Cycle Subsequent Cycles15
Content Selection Criteria
Shemaroo uses proprietary tools and considers various other factors for content valuation as shown below. The company purchases forward rights to
movies and decides on the cost of the content after it is sure to achieve a desired return on investment at a portfolio level.
Sr. No. Content Selection Criteria Sr. No. Content Selection Criteria
Production House
1. Viewership rating 5.
Track Record
ROMANCE
ACTION
2. Box Office Records 6. Genres
COMEDY
DRAMA
Reviews and
3. Cast 7.
Awards
Comparable
4. Music 8.
Movie Valuation16
Content IPs - Best of Bollywood
Ownership of over 1,964 Hindi Film Content Titles
Bollywood
Classics
1990’s
2000’s
2010’s17
Content IPs - Regional & Special Other Content
MARATHI
COMEDY
SPECIAL INTEREST CONTENT
REGIONAL TITLES
GUJARATI
KIDS
DEVOTIONAL
PUNJABI
1,665 Number of Titles 3,000+ Hours of Content18
DIGITAL MEDIA19
Digital Media Industry
Digital Advertising revenues in India grew by 37% to reach INR 160 bn in Digital Advertisement Spend (INR bn)
FY19 over FY18. It is expected to grow at a 27% CAGR over the period FY19-
FY24 to reach INR 539 bn
539
Digital Subscriptions (audio and video) in India grew at 45% in FY18 to
reach INR 13 bn in FY19 and expected to reach INR 83 bn by FY24. The
video subscription ecosystem has evolved over the past years and now has 423
over 30 OTT players in India
333
Highlights 266
210
✓ Advancements in digital infrastructure, increasing penetration from non-
urban areas, cheaper data and high adoption of mobile phones has 160
contributed to growth in digital advertising 116
✓ The number of smartphone users in India is expected to rise by 84% to 86
65
859 mn by 2022 from 468 mn in 2017 47
✓ Videos are expected to contribute around ~77% of the mobile data
traffic by 2022 from ~50% in 2017 FY15 FY16 FY17 FY18 FY19 FY20E FY21E FY22E FY23E FY24E
✓ Digital video consumption has increased from 11 minutes to 24 minutes Digital Advertisment Spend (INR bn)
per day during 2017-2019
✓ YouTube reported 96% of its users watched videos in regional language
SOURCE: KPMG, PWC and BCG-CII20
Strategic Drivers for Growth in Digital Media
Broadband Technology Rise of OTT Rapid digital adoption in
Infrastructure • Growing availability of • Increase in the non-metros
• Increasing reach of sub INR 5,000 smart number of OTT • Next wave of internet video
4G & fall in data phones destinations for users will come from the
prices to enhance • Increased penetration online video non-metros driving video
the consumption of of Hybrid connected watching consumption
videos TV STBs, Smart TVs • Surge in the width • 75% of new internet users
• The ‘Digital India’ etc. and depth of are expected to consume
initiative from the content offered for data in local languages by
Government Indian consumers 202021
Digital Potential
Rising Internet Users (Mn) Increasing Share of Mobile Internet Consumption for Video in India
637
Internet users are projected to reach 2017 2022E
494
227 over 700 mn by 2021 because of the
following factors: Video
146 Video
50%
• Low cost smart phone Web and
76%
Audio other data
410 • Improved rural internet connectivity 10% 15%
348 Web and
• Rising regional language popularity other data File Sharing
38% 2%
2018 2019
• Voice enabled utilization of internet File Sharing
3% Audio…
Urban Rural
2x Growth of Online Video Viewers (Mn) Cheapest Mobile Data in the World
Per GB Cost (INR) This has resulted in
313 growth of average
data usage/month to
8.7 GB in 2018 from
160 250 500 18.5 0.9 GB in 2016
2016 2017 2023E 2015 2019
Online Video Viewers (Mn)
SOURCE: KPMG & EY22
Shemaroo In Digital Media
Digital Media Revenue (INR Mn)
Shemaroo was one of
the early Indian media 1,718
companies to syndicate
its library in the high 1,520
growth digital media 1,305
platforms, thereby
gaining early mover
advantage 923
635
• The company caters to all types of revenue models like subscription, pay per 373
transaction, advertisement supported (free to consumer) etc. 246
• Due to its large library ownership Shemaroo has the ability to slice and dice content
FY14 FY15 FY16 FY17 FY18 FY19 9M-FY20
and package it in different ways that are more suited for the digital media platforms
Digital Media Presence
Internet and OTT Mobile Value Added services (MVAS) / Mobile Internet ShemarooMe
• Shemaroo has agreements with • The company has agreements with major telecom • ShemarooMe is the OTT platform launched in Feb’19 –
various internet video operators, namely Airtel, Vodafone, Idea to distribute offering vast content library across Bollywood, Gujarati,
platforms like YouTube, Hotstar, videos, full songs, live streaming etc. under MVAS Marathi, Kids, Punjabi, Devotional etc.
Reliance Jio, Apple iTunes,
Google Play etc.23
YouTube
Shemaroo’s content on YouTube gets over 1.8 Bn views a month at an average of
more than 60 Mn views per day. YouTube Views Growth
• The company’s flagship channels ‘ShemarooEnt‘ crossed 21 Mn subscribers and
‘FilmiGaane’ crossed 32 Mn subscribers in Jan 2020 on YouTube
• The high viewership, content connect and viewer stickiness has translated into higher
revenues for Shemaroo over the years
Revenue Model for You Tube
• Shemaroo gets revenue from the advertisements shown on its channel on YouTube, in
many ways, for example:
• Banner Ads
• Pre roll ads
• Mid roll ads etc.
• Shemaroo gets a revenue share from the advertisement revenue that Youtube makes
from Shemaroo channels
Shemaroo is among the most viewed channel partners for YouTube in India and has
more than 50 channels of its own on YouTube
32 Mn
subscribers 21 Mn
6th most subscribed subscribers
Indian channel on Youtube24
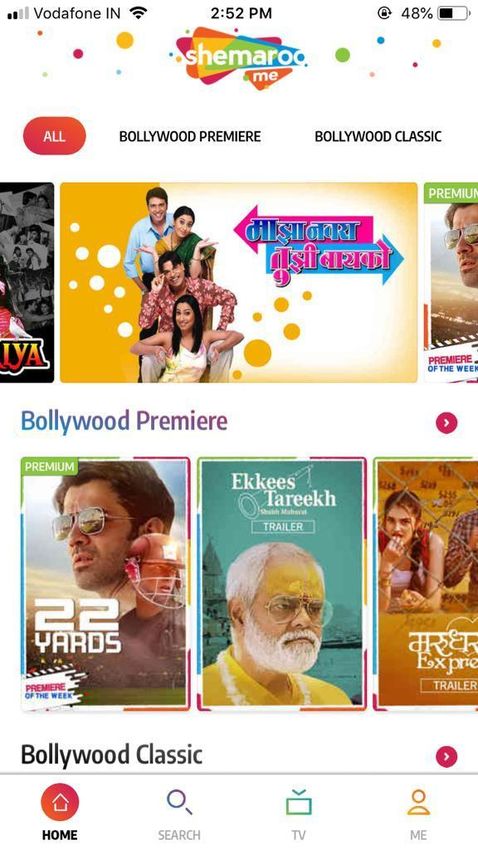
ShemarooMe
• Is a hybrid (subscription + advertisement) digital platform launched in FY19
• Is available in more than 150 countries globally
• Offers a vast content library across Bollywood, Gujarati, Marathi, Punjabi, Bengali, Devotional and Kids genres
• Works on a B2B2C partnership model and is available on platforms like Vodafone Play, Airtel, Ixigo, MX Player etc.
• Have partnered with Android TV, Apple TV, Fire TV Stick, Roku, Mi TV etc.
10,000+
HOURS OF CONTENT
3000+ Music Videos
600+ Bollywood Movies
800+ Comedy Videos & Web Series
550+ hrs Bhakti &
Ibaadat content 320+ Short Movies
LONG SHORT
Format Format
700+ Gujarati,
content content 300+ Kids Rhymes
Marathi and
Punjabi Movies
Available on Multiple Devices:
TV25
TRADITIONAL MEDIA26
Television Industry
Industry Dynamics Under penetrated Rural India (TV) (Mn Homes)
• Television syndication is the sale of content rights to broadcasters No. of Households Penetration 200
• The Indian television broadcasting segment currently has more than six genres and Movies
as a genre is second in terms of viewership after General Entertainment Channels
• The standard practice of the Indian television industry is to purchase forward rights for a 55%
period of 5 to 7 years 100
• There is a one time fixed fee payment made at the network level for exclusive license to
89%
broadcast the content for multiple telecasts
Urban Rural
On any given day, an average of 8 movies are shown on a Movie channel. Even considering
the repeat telecast of these movies, the broadcaster would need access to a significantly Although the number of households for TV viewership
large movie library in rural area is 22% more than urban area, the
penetration is as low as 55%
TV as a medium is
100 Mn i.e.
300 Mn 198 Mn the largest platform
33% of Indian
HHs in India TV HHs in India for video
Households
consumption (93%)
don’t have TV!
SOURCE: BARC & Census 201127
TV - Choice of MASSES & Headroom for Growth
TV will continue to be one of the most popular media consuming platform.
% %
CAGR
Segment (INR Bn) FY19 FY24E Contribution Contribution
(2019-24E)
in FY19 in FY24E
TV 714 1,215 11% 44% 40%
Print 333 409 4% 20% 13%
Films 183 260 7% 11% 8%
Digital 173 621 29% 11% 20%
Animation & VFX 88 184 16% 5% 6%
Rise in Rural and Middle Class Income:
Gaming 62 250 32% 4% 8% • More money in the hands of rural consumers
has led to 10% growth in TV ownership in 2018
OOH 34 52 9% 2% 2%
Benefit of Village Electrification:
Radio 28 45 10% 2% 1% • TV and Refrigerator are two general use items
people BUY FIRST once they get electricity
Music 17 35 16% 1% 1%
Decrease in TV Price:
Total 1,631 3,070 13% 100% 100% • Over 10-20% decrease in last one year
Source : BARC & KPMG28
TV Industry Performance and Projection
TV Industry Performance (INR Bn) Broadcasters’ Revenue (INR Bn) India’s Pay TV ARPU is one of the lowest globally
1,215 724 Countries Pay TV ARPU Digital ARPU
pm pm
824 269
714 443 US
760 371
166 $40-80 $8-12
547 120
463 455
455 251 277
251 277 UK
$25-40 $6-12
FY19 FY20P FY24P FY19 FY20P FY24P
Advertisement Subscription Total Advertisement Subscription Africa
$15-20 $5-8
✓ TV Industry grew from INR 652 Bn in ✓ Broadcaster’s overall revenue increased
FY18 to INR 714 Bn in FY19, a growth of from INR 331 Bn to INR 371 Bn in FY19;
9.5%; expected to grow at a CAGR of expected to grow at a CAGR of 14.3% by Middle
11.2% by FY24 FY24 East
$15-20 $6-12
✓ Advertisement revenue contributed 35% ✓ Broadcaster’s subscription revenue
of the industry in FY19; expected to grow growth is expected to be driven by:
to 38% by FY24 • long term contracts with escalation Thailand
✓ Ad revenues is expected to be driven by clauses $30-70 $6-12
increase in viewership across urban and • digitisation of TV
rural markets, rise in advertising rates • increased transparency contributing
and increasing focus on regional India
to higher revenue share
advertising spends $2-5 $3-8
SOURCE: KPMG and Secondary Research29
Shemaroo in Traditional Media
Television Syndication
• Shemaroo has a diverse content library which it syndicates rights to various Satellite
Traditional Media Revenue (INR Mn)
Channels, Cable & Terrestrial Networks
• Considering the vast and diverse library of Shemaroo, it can be easily assumed that most
broadcasting channels would have some content syndicated from Shemaroo at sometime or
the other 3,960
3,586
3,332
TV Syndication Platforms 2,861
3,113
• Predominantly consists of Hindi films 2,387 2,384
• This includes Movie Channels, Kids Channels, Music Channels,
News Channels etc.
Satellite Television
• Enter into exclusive agreements for a film or package of films with
a particular group of movie channels for a specified period of FY14 FY15 FY16 FY17 FY18 FY19 9M-FY20
time
• The company also licenses content for broadcasting on terrestrial
Terrestrial Television
television network
Subscription Based Services
• In partnership with major DTH and Cable operators, Shemaroo operates subscription-based, ad-free content services across various genres like Movies,
Devotion, Comedy and Regional
Advertisement led Satellite Channel
• Shemaroo launched a satellite FTA channel named as ‘Shemaroo MarathiBana’ in Dec’19, targeted to be a prominent leader in the Marathi movie genre
• The company has over the years built a strong library in the regional space through which it plans to strategically capture a vacuum in the Marathi movie
genre30
RECENTLY LAUNCHED - Preloaded Audio Devices
• Launched 7 preloaded devices with devotional content in FY20; namely Srimad Bhagwad Gita, Bhakti Bhajan Vani, Amrit Bani, Ibaadat, Ganesh Vani, Krishna
Bhajan Vani and Sai Bhajan Vani
• Distributed across 20 states India with a retail presence of +2,500
• Available on major online retail platforms like Amazon, Flipkart, Tata Cliq, etc. as well as offline stores like Crosswords, Archies etc.
Device Shrimad Ibaadat Quran Ganesha Bhajan Krishna Bhajan
Bhajan Vani Amrit Bani Sai Bhajan Vaani
type Bhagavad Gita Majeed Vani Vani
Content
80+ 60+ 150+ 16+ 18+ 210+ 18+
Hours
Content Designed to replicate Bhakti Bhajan Vani Quran- Pak verses, Ganesh Bhajan Vani Krishna Bhajan Vani Shri Guru Granth Sai Bhajan Vani offers
Offering the sacred scripture offers Bhajans, Aartis, Quran Sharif offers Ganesha offers Krishna Songs Sahib ji, Sahaj Paath, Sai Baba Songs in two
Shrimad Bhagavad Jaaps, Mantras, Translation Bhajans, Aartis, in two languages – Kathas, Kirtans, languages – Hindi &
Gita in three and Stotras Chants, Mantras & Hindi, Gujrati Dharmik Geet and Marathi
languages - Hindi, Stotras Simrans
Sanskrit, and English31
STRATEGY32
Road Ahead
“Shemaroo’s multifold growth over the years has been a result of its excellent relationships with its partners in the media industry. Shemaroo will
continue to strengthen its position in the industry by providing unparalleled value addition to all stakeholders”
Riding on the Digital With a fundamental shift happening in how consumers consume the content,
Wave Shemaroo aims to be at the forefront of digital and technological innovations
Strengthening IPs In line with the fast growing appetite of multiple genres of content by consumers,
and Entering new Shemaroo aims to further strengthen its Bollywood and non-Bollywood IPs like
domains regional, devotion, kids, etc.
Expanding our There is an increasing affinity towards Indian content globally. Shemaroo aims to
footprint globally significantly scale up its presence internationally serving diaspora as well as non
diaspora audience to tap this growing demand
Increasing B2C Shemaroo aims to significantly increase its B2C presence in the next few years
presence through innovative product offerings meeting the changing needs of the consumers33
FINANCIALS34
Consolidated Income Statement (Ind-As)
Particulars (INR Mn) FY17 FY18 FY19 9M-FY20
Revenue from Operations 4,255 4,891 5,678 3,904
Total Expenses 2,980 3,465 4,100 3,105
EBITDA 1,275 1,426 1,578 799
EBITDA Margin (%) 29.96% 29.16% 27.79% 20.46%
Other Income 30 12 18 19
Depreciation 43 51 56 55
Finance Cost 324 307 256 173
PBT 938 1,080 1,284 591
Tax 342 367 457 146
PAT 596 713 827 445
Minority Interest & Share of profit/ (loss) in associate company 18 (1) 3 (4)
PAT after adjustments 614 712 830 441
PAT Margin (%) 14.43% 14.56% 14.62% 11.31%
Comprehensive Income - 3 3 0
Total Profit including Comprehensive Income( Net of tax) 614 715 833 441
EPS (INR)(not annualised) 22.60 26.18 30.52 16.2435
Consolidated Balance Sheet (Ind-As)
Equity and Liabilities (INR Mn) FY18 FY19 H1-FY20 Assets (INR Mn) FY18 FY19 H1-FY20
Shareholders Fund Non Current Assets
Share Capital 272 272 272 Fixed Assets
Other Equity 4,662 5,445 5,747 Property, Plant & Equipment 323 306 324
Total Equity 4,934 5,717 6,019 Intangible assets 10 10 11
Non controlling interest (36) (42) (41) Intangible assets under development - - 2
Non Current Liabilities Right of use Assets - - 22
Long Term borrowings 21 4 3 Investments 67 65 89
Lease liability - - 23 Long Term Loan and Advances - 1 1
Deferred tax liabilities (Net) 36 34 24 Other Financial Assets 3 3 1
Long tem provisions 16 32 41 Other Non Current Assets 31 58 45
Total Non-Current Liabilities 73 70 91 Total Non-Current Assets 434 443 495
Current Liabilities Current Assets
Short Term Borrowings 1,858 1,969 2,136 Inventories 5,297 6,027 6,794
Trades payables 181 298 490 Trade Receivables 1,406 1,590 1,410
Other Financial Liabilities 135 63 185 Cash and cash equivalents 13 16 27
Other Current Liabilities 28 68 14 Short Term loan and advances 4 6 6
Short Term Provisions 15 8 8 Other Financial Assets - 8 -
Current Tax Liabilities (Net) 125 151 116 Other Current Assets 159 212 286
Total Current Liabilities 2,342 2,557 2,949 Total Current Assets 6,879 7,859 8,523
Total 7,313 8,302 9,018 Total 7,313 8,302 9,01836
Historical Consolidated Financial Charts
Operational Revenue* (INR Mn) EBITDA (INR Mn) and EBITDA Margin (%)
5 Year CAGR 16.50% 5 Year CAGR 19.67%
5,678 2,000 35.00%
28.69% 29.96% 29.16%
4,891 26.84% 27.79% 30.00%
1,600
24.30%
4,255 1,578 25.00%
3,751 1,200 1,426
3,234 1,275 20.00%
2,646 800
1,076 15.00%
868 10.00%
400 643
5.00%
- 0.00%
FY14 FY15 FY16 FY17 FY18 FY19 FY14 FY15 FY16 FY17 FY18 FY19
Net Worth (INR Mn) and ROCE (%) PAT (INR Mn) and EPS (INR)
7,000 5 Year CAGR 26.79% 900
5 Year CAGR 25.00% 30.52 35
20.31% 19.96% 23.00%
26.18 830 30
19.60% 19.20% 18.10%
5,250 18.60% 20.00%
22.60 712 25
5,717
600
19.18
17.35 614
4,932 17.00% 20
3,500 13.68 521
4,232 14.00% 15
3,174 3,649 300
409
11.00% 10
1,750
272
1,745 8.00% 5
- 5.00%
- 0
FY14 FY15 FY16 FY17 FY18 FY19 FY14 FY15 FY16 FY17 FY18 FY19
* Note: FY17 to FY19 numbers are as per IND-As37
Rights Accounting Policy – Charge To P&L
Aggregated Rights Long Term Rights
(=10 years)
Specific Bundled Rights First 5 years - Next 5 years –
(Satellite + 65% in year of 35% in year of
Rights Digital Rights) sale sale
Satellite,
Satellite rights - Satellite rights -
overseas, etc. - Digital rights - Digital rights -
Digital rights 85% in year of 85% in year of
100% in year of 15% over 5 years 15% over 5 years
sale sale
sale
New Titles – 70% in
Catalogue –equally
first year & balance
over 60 months
over 4 years38
Capital Market
20.0%
10.0%
0.0%
-10.0%
-20.0%
-30.0%
-40.0%
-50.0%
-60.0%
-70.0%
-80.0%
Jan-19 Feb-19 Mar-19 Apr-19 May-19 Jun-19 Jul-19 Aug-19 Sep-19 Oct-19 Nov-19 Dec-19
Shemaroo BSE Sensex
Share Holding Pattern as on 31st December, 2019
Price Data (As of 31st December, 2019) INR
Face Value 10.0 Public
13.67%
Market Price 140.4
FII
52 Week H/L 454.9/131.0
20.24%
Market Cap (INR Mn) 3,817.7 Promoters
65.83%
Equity Shares Outstanding (Mn) 27.2 DII
0.26%
1 Year Avg. Trading Volume ('000) 13.439
Disclaimer
Shemaroo Entertainment Limited
No representation or warranty, express or implied, is made as to, and no reliance should be placed on, the fairness, accuracy, completeness or correctness of the information or opinions contained in this presentation. Such
information and opinions are in all events not current after the date of this presentation. Certain statements made in this presentation may not be based on historical information or facts and may be "forward looking
statements" based on the currently held beliefs and assumptions of the management of Shemaroo Entertainment Limited (“Company” or “Shemaroo”), which are expressed in good faith and in their opinion reasonable,
including those relating to the Company’s general business plans and strategy, its future financial condition and growth prospects and future developments in its industry and its competitive and regulatory environment.
Forward-looking statements involve known and unknown risks, uncertainties and other factors, which may cause the actual results, financial condition, performance or achievements of the Company or industry results to
differ materially from the results, financial condition, performance or achievements expressed or implied by such forward-looking statements, including future changes or developments in the Company’s business, its
competitive environment and political, economic, legal and social conditions. Further, past performance is not necessarily indicative of future results. Given these risks, uncertainties and other factors, viewers of this
presentation are cautioned not to place undue reliance on these forward-looking statements. The Company disclaims any obligation to update these forward-looking statements to reflect future events or developments.
This presentation is for general information purposes only, without regard to any specific objectives, financial situations or informational needs of any particular person. This presentation does not constitute an offer or
invitation to purchase or subscribe for any securities in any jurisdiction, including the United States. No part of it should form the basis of or be relied upon in connection with any investment decision or any contract or
commitment to purchase or subscribe for any securities. None of our securities may be offered or sold in the United States, without registration under the U.S. Securities Act of 1933, as amended, or pursuant to an exemption
from registration there from.
This presentation is confidential and may not be copied or disseminated, in whole or in part, and in any manner.
Valorem Advisors Disclaimer:
Valorem Advisors is an Independent Investor Relations Management Service company. This Presentation has been prepared by Valorem Advisors based on information and data which the Company considers reliable, but
Valorem Advisors and the Company makes no representation or warranty, express or implied, whatsoever, and no reliance shall be placed on, the truth, accuracy, completeness, fairness and reasonableness of the contents of
this Presentation. This Presentation may not be all inclusive and may not contain all of the information that you may consider material. Any liability in respect of the contents of, or any omission from, this Presentation is
expressly excluded. Valorem Advisors also hereby certifies that the directors or employees of Valorem Advisors do not own any stock in personal or company capacity of the Company under review.
For further information please contact our Investor Relations Representative:
Mr. Anuj Sonpal
Valorem Advisors
Tel: +91-22-4903-9500
Email: shemaroo@valoremadvisors.com
Investor Kit Link: www.valoremadvisors.com/shemaroo40
THANK YOUYou can also read