Signatures of fluid-fluid displacement in porous media: wettability, patterns, and pressures
←
→
Page content transcription
If your browser does not render page correctly, please read the page content below
This draft was prepared using the LaTeX style file belonging to the Journal of Fluid Mechanics   1
arXiv:1906.02364v2 [physics.flu-dyn] 14 Jan 2020

                                                           Signatures of fluid-fluid displacement in
                                                           porous media: wettability, patterns, and
                                                                           pressures
                                                       Bauyrzhan K. Primkulov1 , Amir A. Pahlavan2 , Xiaojing Fu3 ,
                                                     Benzhong Zhao4 , Christopher W. MacMinn5 , and Ruben Juanes1 †
                                                      1
                                                          Massachusetts Institute of Technology, 77 Massachusetts Avenue, Cambridge, MA, USA
                                                                           2
                                                                             Princeton University, Olden St., Princeton, NJ, USA
                                                                 3
                                                                   University of California at Berkeley, McCone Hall, Berkeley, CA, USA
                                                                    4
                                                                      McMaster University, 1280 Main Street West, Hamilton, Canada
                                                                       5
                                                                         University of Oxford, Parks Road, Oxford, United Kingdom
                                                                                 (Received xx; revised xx; accepted xx)

                                                   We develop a novel “moving capacitor” dynamic network model to simulate immiscible
                                                   fluid-fluid displacement in porous media. Traditional network models approximate the
                                                   pore geometry as a network of fixed resistors, directly analogous to an electrical circuit.
                                                   Our model additionally captures the motion of individual fluid-fluid interfaces through
                                                   the pore geometry by completing this analogy, representing interfaces as a set of moving
                                                   capacitors. By incorporating pore-scale invasion events, the model reproduces, for the
                                                   first time, both the displacement pattern and the injection pressure signal under a
                                                   wide range of capillary numbers and substrate wettabilities. We show that at high
                                                   capillary numbers the invading patterns advance symmetrically through viscous fingers.
                                                   In contrast, at low capillary numbers the flow is governed by the wettability-dependent
                                                   fluid-fluid interactions with the pore structure. The signature of the transition between
                                                   the two regimes manifests itself in the fluctuations of the injection pressure signal.

                                                   Key words:

                                                   1. Introduction
                                                     A beautiful array of flow patterns arises when a low-viscosity fluid displaces a
                                                   more-viscous fluid in a porous medium. The problem has been extensively examined
                                                   through laboratory experiments, as well as numerical simulations and theoretical
                                                   models (Saffman & Taylor 1958; Bensimon et al. 1986; Homsy 1987; Paterson 1981;
                                                   Tryggvason & Aref 1983; Nittmann et al. 1985; Kadanoff 1985; Arnéodo et al. 1989;
                                                   Li et al. 2009; Bischofberger et al. 2015; Chen & Wilkinson 1985; Måløy et al. 1985;
                                                   Chen 1987; Fernández et al. 1990). The dynamics of such displacement can be
                                                   characterized by two dimensionless groups: the ratio of viscous to capillary forces, or
                                                   the capillary number (Ca), and the ratio of defending to invading fluid viscosities,
                                                   or viscosity contrast (M ). For high Ca, the resulting displacement patterns are
                                                   reminiscent of diffusion limited aggregation (Witten et al. 1981; Daccord et al. 1986;
                                                   Meakin et al. 1989; Niemeyer et al. 1984; Conti & Marconi 2010). For low Ca, the
                                                                          † Email address for correspondence: juanes@mit.edu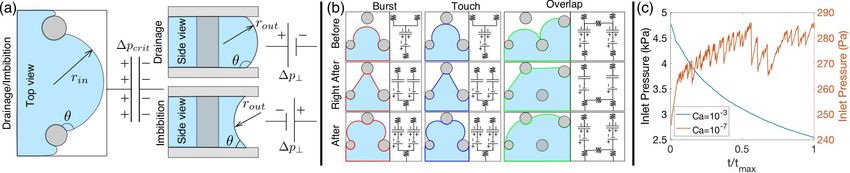
2                                  B.K. Primkulov et al.
displacement dynamics becomes more intricate, and the emerging patterns display a
strong dependence on the pore geometry (Lenormand & Zarcone 1985; Lenormand et al.
1983, 1988; Fernandez et al. 1991; Måløy et al. 1992; Furuberg et al. 1996; Ferer et al.
2004; Toussaint et al. 2005; Holtzman et al. 2012) and the wettability of the medium,
that is, the chemical affinity of the solid for each fluid (Stokes et al. 1986; Trojer et al.
2015; Zhao et al. 2016; Odier et al. 2017). In particular, an intermittent injection
pressure signal emerges in the limit of low Ca (Furuberg et al. 1996; Måløy et al. 1992).
Given that in most practical applications visualization of the flow in porous media is
not possible, the pressure signal is often the only source of information. Surprisingly,
no modeling approach to date has been able to capture the injection pressure signal
across different Ca and pore wettabilities. Here, we develop a new pore-network model
that fills this gap, and we use it to explore the transition from viscous-dominated to
capillary-dominated flow regimes by examining the connections among fluid morphology
and pressure signal.
  Pore network models of flow in porous media can be broadly classified into two
groups: quasi-static and dynamic models (Blunt 2001; Meakin & Tartakovsky 2009;
Joekar-Niasar & Hassanizadeh 2012). Quasi-static models neglect viscous effects and
advance the invading fluid through either invasion-percolation (Chandler et al. 1982;
Lenormand et al. 1988) or event-based algorithms (Cieplak & Robbins 1990, 1988). Al-
though a quasi-static approach can be effective in reproducing experimental invasion
patterns at low Ca (Primkulov et al. 2018), it is unable to capture the temporal evo-
lution of the injection pressure signal. Dynamic network models approximate the flow
channels with a network of interconnected capillary tubes. Viscous pressure drops are
calculated by assuming fully developed viscous flow within each tube. Local capillary
pressures within the network are calculated from either the interface position within
pore throats (Aker et al. 1998a; Gjennestad et al. 2018) or through mass balance of
the two phases in pore bodies (Al-Gharbi & Blunt 2005; Joekar-Niasar et al. 2010).
Another notable class of models is invasion-percolation in a gradient: a percolation
model designed to incorporate buoyancy forces (Wilkinson 1984; Birovljev et al. 1991;
Frette et al. 1992; Meakin et al. 1992), and then extended to model (linear) pressure
gradients (Yortsos et al. 1997). None of the invasion-percolation in a gradient studies,
however, incorporate any notion of wettability (they all deal exclusively with strong
drainage), pore-scale dynamics, or capillary-number-dependent pressure fluctuations.
   In fact, most existing pore-network models, both quasi-static and dynamic, are
limited to strong drainage (or injection of non-wetting fluid) and do not include
wettability-induced cooperative pore filling (Joekar-Niasar et al. 2010; Aker et al.
1998a; Al-Gharbi & Blunt 2005; Holtzman & Juanes 2010). The only dynamic pore
network model to date that includes cooperative pore filling events (Holtzman & Segre
2015) does so by combining pore-level invasion events of Cieplak & Robbins (1988, 1990)
with viscous relaxation through the pore-network. This viscous-relaxation assumption
is at odds with the physics of interface motion in the capillary-dominated regime and,
as a result, this model is unable to capture the injection pressure signal observed
experimentally in the limit of intermediate and low Ca (Zhao et al. 2016; Furuberg et al.
1996; Måløy et al. 1992). We present in §2 a consistent framework that combines
viscous, capillary, and wettability effects in a single dynamic network model that builds
a direct analogy between local fluid-fluid interfaces and electric capacitors. Our model
reproduces, quantitatively, the fluid-fluid displacement patterns for a wide range of Ca
and wettabilities (§3), and points to a surprising and heretofore unrecognized transition
in the pressure fluctuations between the low and high Ca flow regimes (§4).
Signatures of fluid-fluid displacement in porous media                       3

Figure 1. (a) Schematic diagram of in-plane and out-of-plane curvatures within the flow cell.
Out-of-plane curvature represents the overall affinity of the porous medium to the invading fluid.
It is determined by θ and is analogous to a battery. In-plane curvature changes as the local
interface evolves while pinned to a pore throat, and it is analogous to a capacitor. (b) Evolution
of burst, touch, and overlap events. (c) Temporal profiles of the injection pressure bear close
resemblance to similar experiments in the drainage regime at low (orange) and high (blue) Ca
(Furuberg et al. 1996; Zhao et al. 2016).

2. Moving Capacitor Model
   Consider a moving fluid-fluid interface in a micromodel (FIG 1a). Neglecting dynamic-
contact-angle effects (Hoffman 1975) for simplicity, the shape of the meniscus between
posts is uniquely defined by the combination of Laplace pressure and substrate wet-
tability defined through a contact angle θ at which the interface meets post surfaces
(Cieplak & Robbins 1988, 1990). As the interface advances, the Laplace pressure in-
creases until the interface encounters a burst, touch or overlap event, as defined by
Cieplak & Robbins (1988, 1990). The burst event is equivalent to a Haines jump (Haines
1930; Berg et al. 2013), while the touch and overlap events take place when the local in-
terface either touches the nearest opposing post or coalesces with a neighboring interface
respectively [FIG. 1(b)]. If the interface becomes unstable due to burst or touch, a single
pore is invaded and two new interfaces appear. In the case of an overlap event, two (in
some cases more) pores are filled simultaneously. These pore-level events are an integral
part of the model and, indeed, this sensitivity is what permits capturing wettability effects
within the model. The events evolve differently at different wettabilities—burst events
are most frequent in drainage, while touch and overlap are most frequent in imbibition
(or injection of wetting fluid) (Cieplak & Robbins 1990; Primkulov et al. 2018).
   We can explicitly calculate the critical Laplace pressure ∆pcrit corresponding to
all events from the values of the contact angle, radii and coordinates of the posts
(Primkulov et al. 2018), and thus can use the analogy between electric capacitors and
fluid-fluid interfaces in constructing our network model. A capacitor represents the
pinning of the fluid–fluid interface at a pore throat, and is active in both drainage
and imbibition: the interface moves only when a local depinning threshold (∆pcrit ) is
reached, and the fluid front moves to restart the pinning–depinning cycle from zero
in-plane curvature [Fig. 1(b)]. This progression of the in-plane curvature in our model
was motivated by the work of Cieplak and Robbins (Cieplak & Robbins 1988, 1990) [see
also (Rabbani et al. 2018)] and experiments on the progression of the in-plane curvature
between the Hele-Shaw cell posts (Jung et al. 2016; Lee et al. 2017). This is what allows
capturing pressure fluctuations in the limit of low Ca [Fig. 1(c)]. The battery analogy
represents the overall affinity of the porous medium to the invading fluid, set by the
out-of-plane curvature at the fluid front. The out-of-plane curvature is fixed throughout
a single simulation, and determined by the value of the contact angle (given the constant
gap between the flow-cell plates): it is positive in drainage and negative in imbibition
[Fig. 1(a)]. To complete the analogy between an electric circuit and a pore network,
one can think of a network of resistors being responsible for viscous effects, capacitors
4 B.K. Primkulov et al.
(a) (b) (c) (d)
Quasi-static Model
Contact Angle (deg)
Dynamic Model
Ca Contact Angle (deg) Contact Angle (deg) Contact Angle (deg)
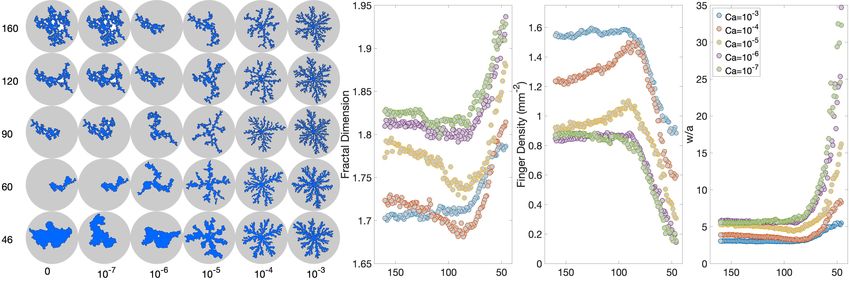
Figure 2. (a) Phase diagram of the invading fluid morphology at breakthrough; (b) Fractal
dimension, computed by means of the box-counting method; (c) Number of fingers per unit area
of injected fluid, which exhibits a maximum near θ = 90◦ ; (d) Normalized finger width (w/a)
at different Ca and wettabilities measured at breakthrough. Finger width increases as the posts
become more wetting to the invading fluid.
and batteries responsible for capillary effects, and local rules for circuit rearrangements
responsible for wettability effects [FIG. 1(b)].
Therefore, the pressure drop across an edge of the network containing a fluid-fluid
interface has three components: (i) pressure drop due to viscous dissipation, (ii) Laplace
pressure drop due to in-plane curvature of the interface, and (iii) Laplace pressure drop
due to out-of-plane curvature of the interface. We calculate the viscous pressure drop
assuming Poiseuille flow in a capillary tube, which is analogous to the potential drop
across a resistor. The out-of-plane component of the Laplace pressure can be expressed
2γ cos θ
as either a positive or negative pressure jump (∆p⊥ = − , where γ is the interfacial
h
tension, and h is the cell height) depending on the substrate wettability; this is analogous
to a battery in an electric circuit. The Laplace pressure due to in-plane curvature of the
interface is analogous to a capacitor which allows flow until it reaches the critical pressure
(∆pcrit = min{pburst , ptouch , poverlap }). Since we can calculate ∆pcrit for all edges at the
invading fluid front, we use a linear estimate of the in-plane Laplace pressure drops
within our network (Φ(t)∆pcrit ), where Φ(t) stands for the filling ratio of a given throat.
When Φ(t) → 0, the in-plane Laplace pressure is negligible. When Φ(t) → 1, the throat
is nearly full and has a critical in-plane Laplace pressure ∆pcrit . This analogy between
local interfaces and capacitors allows us to incorporate local changes in Laplace pressure
due to filling of pore throats. Once a node in the network reaches its maximal potential,
which coincides with its filling capacity, it becomes unstable and the interface advances.
We assume that the in-plane and out-of-plane Laplace pressures are decoupled, and this
is done to maintain the simplicity of the overall model. With this assumption, one can run
the model for either ha ≫ 1 or ha ≪ 1, where these conditions would result in negligible
or dominant contributions of the out-of-plane curvature in the model, respectively.
The topology of the pore network is captured through the incidence matrix A by
examining the adjacency of the pores (Strang 2007). We number all pores and adopt
the convention that pore connections are oriented in the direction of increasing pore
numbers. Rows of A represent edges, and columns of A represent nodes of the network.
We also make use of the diagonal conductance matrix C, whose elements are hydraulic
conductivities of the network edges. The elements of this matrix can be calculated as
πr 4
c = 8µL , assuming fully developed Hagen-Poiseuille flow through a rectangular tube
with hydraulic radius r and length L, where µ is the effective viscosity of the fluid in the
channel.Signatures of fluid-fluid displacement in porous media 5
The pressure difference across the network edges can be calculated as e = b−Ap, where
b and p stand for pressure change due to out-of-plane contribution to Laplace pressure
(batteries) and node pressures, respectively. The network flow rates can be calculated
from this pressure difference as q = Ce. At the same time, flow rates must obey mass
conservation, AT q = f , where f stands for flow sources at the nodes. After eliminating
e, the flow through the network without the in-plane contribution to Laplace pressure
(capacitors) is obtained through the following system of equations:
q = C(b − Ap), (2.1)
T
A q = f. (2.2)
We set constant flow boundary conditions at the inlet pores (at the center of the flow cell)
and constant pressure boundary conditions at the outlet pores (at the edges of the flow
cell). We note that Ap can be decomposed into components of nodes with prescribed
pressure and all other nodes (Ap = Aouter pouter + Ãp̃), and therefore Eqs. (2.1)-(2.2)
transform to:
−1
C Ã q b − Aouter pouter b̃
= = ˜ . (2.3)
A˜T 0 p̃ f˜ f
The solution to (2.3) provides values of both edge flow rates and node pressures for given
boundary conditions.
Finally, we incorporate the pressure drop due to in-plane Laplace pressure (capacitors)
within the network. Taking into account the direction of the edges (an array d(t)
consisting of 1 and −1), the total pressure drop across the network edges can be written
as e = b̃− Ãp̃−d(t)Φ(t)∆pcrit . In other words, the in-plane Laplace pressure is the product
of the filling ratio and the critical pressure from the quasi-static model (Primkulov et al.
2018). Therefore, the equations governing two-phase flow through the network can be
written as:
−1
C (t) Ã q(t) b̃ − d(t)Φ(t)∆pcrit
= . (2.4)
A˜T 0 p̃(t) f˜
We now discuss the mechanics of the time-stepping in our two-phase flow model. After
we initialize the interface locations within the network, we use an adaptive forward Euler
time stepping to update the filling ratios of the network edges at the interface Φ(t). We
ensure that only a fraction of the edge total volume at the interface flows within the time-
step (Aker et al. 1998a). After every time-step, we use Φ(t) to update the conductance
matrix C(t) and resolve the flow through Eq. (2.4) with updated pressure drops across
the fluid-fluid front.
In the spirit of the fundamental contributions from Cieplak and Robbins (Cieplak & Robbins
1988, 1990), our model takes the form of an arrangement of cylindrical posts confined
between the plates of a Hele-Shaw cell. The approach is simple enough to lead to
universal findings, yet sufficiently complex to have direct relevance to microfluidic
geometries, as well as engineered and natural porous media—much like Lenormand’s
phase diagram (Lenormand et al. 1988). By doing so, we demonstrate the ability to
reproduce physics—in particular, pressure fluctuations under a wide range of wetting
conditions—which, until now, were inaccessible to pore-network modeling. A limitation
of the model presented here is that it does not extend to contact angles below 45◦ ,
where the wetting fluid preferentially wets the corners of the pore-geometry at low Ca
and forms film flow at high Ca (Zhao et al. 2016; Odier et al. 2017).6 B.K. Primkulov et al.
3. Invasion Patterns
We simulate immiscible fluid-fluid displacement by setting a constant injection rate at
the center of the flow cell and zero pressure at the outlets. The invading and defending
fluid viscosities are set to 8.9 × 10⁻⁴ Pa · s and 0.34 Pa · s respectively. The post height h
is 100µm, and interfacial tension γ is set to 13 × 10−3 N/m. These parameters as well as
the pore geometry are chosen to mimic the experiments of Zhao et al. (2016). The flow
cell has an outer diameter of 30 cm. We perform simulations for wetting conditions from
strong drainage (θ = 160◦ ) to weak imbibition (θ = 46◦ ). FIG. 1(c) shows the pressure
profiles for θ = 160◦ at Ca ∈ {10−3 , 10−7 }, respectively. In the limit of high Ca, the more-
viscous defending fluid sustains substantial spatial pressure gradients, and the injection
pressure gradually drops as more of the defending fluid is displaced (Zhao et al. 2016). In
contrast, in the limit of low Ca, the pressure field is virtually uniform in each fluid, and the
injection pressure exhibits intermittent fluctuations typical of slow capillary-dominated
drainage (Knudsen & Hansen 2002; Aker et al. 1998b; Måløy et al. 1992; Moebius & Or
2012).
The morphology of the invading fluid at breakthrough can be analyzed by means of
a binary-image representation of the invasion patterns (Cieplak & Robbins 1990, 1988;
Primkulov et al. 2018) [FIG. 2(a)]. We estimate the width and number of fingers in
the invading fluid pattern following the protocol outlined in (Cieplak & Robbins 1988,
1990) and modified in (Primkulov et al. 2018). The binary image is sliced horizontally
and vertically, with each slice containing clusters of invading fluid pixels. We calculate
the finger width as the mean size of these clusters. FIG. 2(d) shows that the finger
width, normalized by the typical pore size, increases as θ → 46◦ for all Ca, which
is in agreement with experimental observations (Stokes et al. 1986; Trojer et al. 2015;
Zhao et al. 2016). While FIG. 2(a) demonstrates that the number of fingers increases
with Ca (Lenormand et al. 1988; Fernández et al. 1990; Zhao et al. 2016), we observe
an unexpected behavior [FIG. 2(b)]: the finger density changes with the substrate
wettability, and exhibits a maximum around θ = 90◦ . This effect is most pronounced
for 10−6 < Ca < 10−3 (when viscous and capillary effects are comparable).
We explain the peak in the viscous finger density at θ ≈ 90◦ in FIG. 2(b) by considering
in-plane and out-of-plane contributions to the Laplace pressure. At a fixed Ca, the ratio
of viscous and capillary forces in the micromodel changes as a function of substrate
wettability. The capillary forces have out-of-plane contributions, which are nominally
equal to zero when θ = 90◦ , so the ratio of viscous and capillary forces increases as
θ changes from 160◦ to 90◦ at fixed Ca. In addition, when θ changes from 90◦ to
46◦ , the cooperative pore filling mechanisms become dominant and widen the largest
fingers, which in turn consume the smaller ones and reduce the number of fingers. The
combination of these two effects results in the local maximum in the number of viscous
fingers around θ ≈ 90◦ across different Ca [FIG. 2(b)].
For a contact angle θ near 160◦ (strong drainage) and high values of Ca (10−3 and
10−4 ), the invading fluid front advances through viscous fingers with fractal dimension
close to 1.71, typical of DLA-type morphology (Witten et al. 1981). As Ca is reduced
to a low value (10−7 ), the fractal dimension increases to about 1.82, characteristic of
invasion-percolation (Wilkinson & Willemsen 1983) [FIG. 2(b)]. This increasing trend in
fractal dimension is consistent with the decrease in finger density [FIG. 2(c)] and the
increase in finger width [FIG. 2(d)].
As the contact angle approaches 46◦ , cooperative pore filling becomes the dominant
flow mechanism at all values of Ca. This flow regime results in the compact displacementSignatures of fluid-fluid displacement in porous media 7 Figure 3. (a)-(b) Temporal evolution of the injection pressure at Ca = 10−3 and Ca = 10−7 respectively. At high Ca, the injection pressure decreases as the viscous fingers approach the outer boundary of the flow cell. At low Ca, the injection pressure is dominated by Laplace pressure fluctuations at the interface. We use wavelet decomposition (Cai 2002; Sygouni et al. 2006, 2007) to split the pressure signal (Ca = 10−5 and θ = 160◦ here) into its (c) global trend and (d) cyclic component. (e) The standard deviation of the pressure fluctuations point at two different regimes. At low Ca, pressure fluctuations are dominated by stick-slip changes in Laplace pressure. At high Ca, pressure fluctuations are dominated by changes in the effective hydraulic conductance of dominant flow channels. of the defending fluid, and thus the fractal dimension increases, approaching a value of 2 at low Ca, indicative of stable displacement. 4. Pressure Signature The fundamental difference in the fluid-fluid displacement process between low and high Ca is reflected in the temporal injection-pressure signals [FIG. 3]. When the capillary number is relatively high (Ca = 10−3 ), viscous forces dominate, and the injection pressure decreases with time for all substrate wettabilities (Zhao et al. 2016) [FIG. 3(a)]. Here, most of the pressure drop takes place in the more-viscous defending fluid. Consequently, as more of the defending fluid is displaced, the pressure required to maintain the prescribed injection flow rate decreases. In contrast, at Ca = 10−7 , viscous dissipation is negligible, and the injection pressure is determined by the sum of outlet and Laplace pressures. As a result, the injection pressure fluctuates in a stick- slip manner around a mean value [FIG. 3(b)], as has been documented in slow drainage experiments (Måløy et al. 1992; Furuberg et al. 1996; Moebius & Or 2012). The pressure signals in FIG. 3(b) highlight the roles that in-plane and out-of-plane curvatures play in our model. Out-of-plane curvature plays the role of batteries, and thus provides additional resistance/drive (in drainage/imbibition, respectively) to the flow at the interface. The magnitude of the pressure drop/rise at the batteries is a function of wettability, which explains why the mean value of the injection pressure signal also varies with wettability [FIG. 3(b)]. The in-plane curvature plays the role of capacitors. As the invading fluid is injected, the in-plane component of Laplace pressure grows at the interface until the meniscus near the pore with lowest critical entry pressure becomes unstable due to burst, touch or overlap. This results in the rapid advance of the local interface, which pressurizes the defending fluid ahead. This overpressure then dissipates (see video S1 in supplemental materials). The critical pressures of touch and overlap are always smaller than the critical pressures of burst events (Primkulov et al. 2018; Cieplak & Robbins 1990, 1988), so the magnitude of the pressure fluctuations decreases as the substrate becomes more wetting to the invading fluid [FIG. 3(b)]. To gain further insight into the difference in the pressure signature between low and high Ca, we decompose the injection pressure signal into its global trend and fluctuating components with Block James-Stein wavelet decomposition (Cai 2002) (see FIG. 3c- d). We compute the standard deviation of the fluctuating component of the pressure
8 B.K. Primkulov et al.
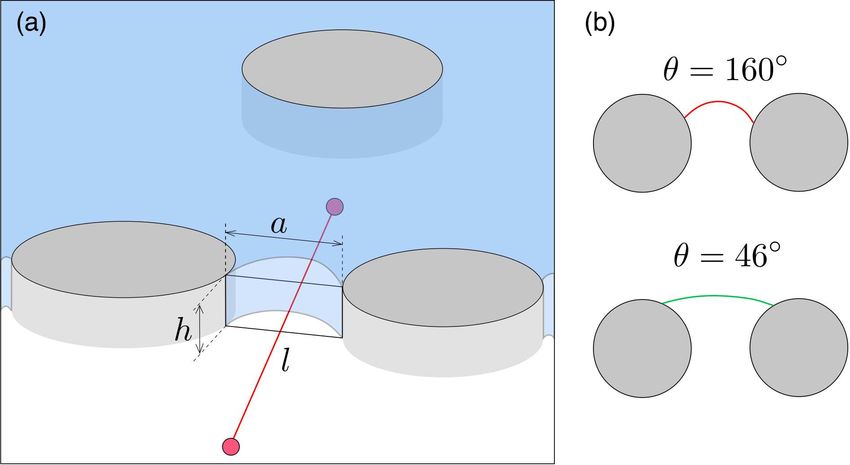
Figure 4. (a) Pore-scale perspective for the scaling of pressure fluctuations. The diagram shows
a typical pore being invaded. The characteristic distance between the pore centers is l (red
line), the post height is h, and a characteristic throat size is a. (b) Typical configurations of the
fluid-fluid interface in drainage and imbibition. Burst events are prevalent in drainage and the
typical radius of out-of-plane curvature is of order a. Overlap events are prevalent in imbibition
and the typical radius of out-of-plane curvature is an order of magnitude greater than a.
signal for both drainage and imbibition conditions (θ = 160◦ and 46◦ , respectively) for
a wide range of Ca, and find that it exhibits two distinct regimes [FIG. 3(e)]. At low
Ca, pressure fluctuations are controlled by the stick-slip-type changes in local Laplace
pressures. In contrast, at high Ca, pressure fluctuations are controlled by changes in the
effective hydraulic conductance of the dominant flow channels. In the limit of high Ca,
the Laplace pressure drop is negligible in comparison with the viscous pressure gradient,
but the dominant flow channels are rearranged slightly as the fingers grow (see video S2
in supplementary materials). Since the pore geometry has a heterogeneous distribution
of throat sizes, shifts in the dominant flow channels result in viscosity-driven pressure
fluctuations at high Ca.
Scaling arguments support the findings from the model simulations. Let us take a
pore-scale perspective (see Fig. 4). Invading a single pore involves overcoming a capillary
pressure and pushing defending fluid out through a throat of width a and height h at a
speed proportional to the injection rate. The capillary pressure is pcap ≈ γ( h1 + af1(θ) ),
where f (θ) is a wettability-dependent function that takes a value ∼ 1 near drainage and
∼ 10 near strong imbibition [Fig. 4(b)]. Taking variations of pcap with a yields
γ
δpcap ∼ 2 δa. (4.1)
a f (θ)
The characteristic flow velocity through a typical throat is u = k(a,h)
µ
pvisc
l , where k(a, h) =
2 ah
Rh /8 is the rectangular channel permeability and Rh = 2(a+h) the hydraulic radius. Thus
2
the viscous pressure is pvisc ∼ 32(a+h) 32µul 2
a2 h2 µul = h2 (1 + h/a) . Taking variations of pvisc
with a yields
64µul h 64µul
δpvisc ∼ (1 + h/a) 2 δa = (1 + h/a)δa. (4.2)
h2 a ha2
The magnitude of the total characteristic pressure fluctuation is δpcap + δpvisc , and its
two components are comparable when δp δpcap ∼ 1. Using equations (4.1) and (4.2),
visc
δpvisc 64µul a2 f (θ) l
∼ 2
(1 + h/a) = Caf (θ)64 (1 + h/a) ∼ 1, (4.3)
δpcap ha γ h
which implies a crossover Ca,
h
Ca∗ ∼ , (4.4)
64f (θ)(1 + h/a)l
between flowrate-independent and flowrate-dependent pressure fluctuations [FIG. 3(e)].Signatures of fluid-fluid displacement in porous media 9
The above argument suggests two interesting implications. First, one can potentially infer
the characteristic pore size of the material from the fluctuations of the pressure signal
in both viscously-dominated and capillary-dominated flow regimes. This is especially
useful when visualization of the flow in pore space is not possible, which is the case
in most porous materials. Second, the characteristic h, a, and l used in this study
yield Ca∗ ≈ 10 ∗
∼ 10−3 for drainage and Ca∗ ∼ 10−4
−3
f (θ) , which reduces to Ca
for imbibition, in agreement with the data in FIG. 3(e). This means that one should
expect the transition from capillary-dominated to viscously-dominated flow regimes at
different Ca* in drainage and imbibition. The order of magnitude of f (θ) was obtained
by calculating ∆pcrit for all pore throats at θ ∈ {46◦, 160◦ } with the quasi-static model
(Primkulov et al. 2018) and taking an average of f (θ) = a∆pγcrit for each contact angle.
Finally, the viscous pressure fluctuation component scales as δpvisc ∼ µu, which is
equivalent to δpvisc ∼ Ca when interfacial tension is kept constant. This explains the
slope of the viscously-dominated portion of the graph in FIG. 3(e).
5. Conclusion
Overall, our moving-capacitor network model provides new fundamental insights into
the dynamics of immiscible fluid-fluid displacement in porous media for a wide range of Ca
and wettabilities. The model completes the picture of the displacement by covering both
high and low Ca which allows, for the first time, to reproduce experimental observations
of invading fluid patterns (Zhao et al. 2016), injection pressure and front velocity in
drainage (Måløy et al. 1992; Furuberg et al. 1996; Moebius & Or 2012) and imbibition.
Our observations and scaling arguments on the transition from viscous-dominated to
capillary-dominated flow regime suggest that it is possible to infer the character of the
multiphase-flow displacement purely from the injection pressure signal. This poses an
exciting prospect for detailed experiments.
REFERENCES
Aker, Eyvind, Måløy, Knut Jørgen, Hansen, Alex & Batrouni, G.George 1998a A
Two-Dimensional Network Simulator for Two-Phase Flow in Porous Media. Transport in
Porous Media 32 (2), 163–186.
Aker, Eyvind, Måløy, Knut Jørgen & Hansen, Alex 1998b Simulating temporal evolution
of pressure in two-phase flow in porous media. Physical Review E 58 (2), 2217–2226.
Al-Gharbi, Mohammed S. & Blunt, Martin J. 2005 Dynamic network modeling of two-
phase drainage in porous media. Physical Review E 71 (1), 016308.
Arnéodo, A., Couder, Y., Grasseau, G., Hakim, V. & Rabaud, M. 1989 Uncovering
the analytical Saffman-Taylor finger in unstable viscous fingering and diffusion-limited
aggregation. Physical Review Letters 63 (9), 984–987.
Bensimon, David, Kadanoff, Leo P., Liang, Shoudan, Shraiman, Boris I. & Tang,
Chao 1986 Viscous flows in two dimensions. Reviews of Modern Physics 58 (4), 977–999.
Berg, Steffen, Ott, Holger, Klapp, Stephan A, Schwing, Alex, Neiteler, Rob,
Brussee, Niels, Makurat, Axel, Leu, Leon, Enzmann, Frieder, Schwarz, Jens-
Oliver, Kersten, Michael, Irvine, Sarah & Stampanoni, Marco 2013 Real-time
3D imaging of Haines jumps in porous media flow. Proceedings of the National Academy
of Sciences of the United States of America 110 (10), 3755–9.
Birovljev, A., Furuberg, L., Feder, J., Jøssang, T., Måløy, K. J. & Aharony, A. 1991
Gravity invasion percolation in two dimensions – Experiment and simulation. Physical
Review Letters 67, 584–587.
Bischofberger, Irmgard, Ramachandran, Radha & Nagel, Sidney R. 2015 An island of
stability in a sea of fingers: emergent global features of the viscous-flow instability. Soft
Matter 11 (37), 7428–7432.10 B.K. Primkulov et al.
Blunt, Martin J. 2001 Flow in porous media pore-network models and multiphase flow.
Current Opinion in Colloid & Interface Science 6 (3), 197–207.
Cai, T. Tony 2002 On Block Thresholding in Wavelet Regression: Adaptivity, Block Size, and
Threshold Level. Statistica Sinica 12, 1241–1273.
Chandler, Richard, Koplik, Joel, Lerman, Kenneth & Willemsen, Jorge F. 1982
Capillary displacement and percolation in porous media. Journal of Fluid Mechanics
119 (-1), 249.
Chen, J. D. 1987 Radial viscous fingering patterns in Hele-Shaw cells. Experiments in Fluids
5 (6), 363–371.
Chen, Jing Den & Wilkinson, David 1985 Pore-scale viscous fingering in porous media.
Physical Review Letters 55 (18), 1892–1895.
Cieplak, Marek & Robbins, Mark O. 1988 Dynamical Transition in Quasistatic Fluid
Invasion in Porous Media. Physical Review Letters 60 (20), 2042–2045.
Cieplak, Marek & Robbins, Mark O. 1990 Influence of contact angle on quasistatic fluid
invasion of porous media. Physical Review B 41 (16), 11508–11521.
Conti, M. & Marconi, U. M. B. 2010 Diffusion limited propagation of burning fronts. In
WIT Transactions on Ecology and the Environment, , vol. 137, pp. 37–45. WIT Press.
Daccord, Gerard Gérard, Nittmann, Johann & Stanley, H. Eugene 1986 Radial viscous
fingers and diffusion-limited aggregation: Fractal dimension and growth sites. Physical
Review Letters 56 (4), 336–339.
Ferer, M., Ji, Chuang, Bromhal, Grant S., Cook, Joshua, Ahmadi, Goodarz & Smith,
Duane H. 2004 Crossover from capillary fingering to viscous fingering for immiscible
unstable flow: Experiment and modeling. Physical Review E 70 (1), 016303.
Fernández, Julio F., Albarrán, Jesús M., Fernandez, Julio F & Albarran, Jesus M
1990 Diffusion-limited aggregation with surface tension: Scaling of viscous fingering.
Physical Review Letters 64 (18), 2133–2136.
Fernandez, Julio F, Rangel, Rafael & Rivero, Juan 1991 Crossover length from invasion
percolation to diffusion-limited aggregation in porous media. Physical Review Letters
67 (21), 2958–2961.
Frette, V., Feder, J., Jøssang, T. & Meakin, P. 1992 Buoyancy-driven fluid migration in
porous media. Physical Review Letters 68, 3164–3167.
Furuberg, Liv, Måløy, Knut Jørgen & Feder, Jens 1996 Intermittent behavior in slow
drainage. Physical Review E 53 (1), 966–977.
Gjennestad, Magnus Aa., Vassvik, Morten, Kjelstrup, Signe & Hansen, Alex 2018
Stable and Efficient Time Integration of a Dynamic Pore Network Model for Two-Phase
Flow in Porous Media. Frontiers in Physics 6, 56.
Haines, William B. 1930 Studies in the physical properties of soil. V. The hysteresis effect
in capillary properties, and the modes of moisture distribution associated therewith. The
Journal of Agricultural Science 20 (01), 97.
Hoffman, Richard L 1975 A study of the advancing interface. I. Interface shape in liquidgas
systems. Journal of Colloid and Interface Science 50 (2), 228–241.
Holtzman, Ran & Juanes, Ruben 2010 Crossover from fingering to fracturing in deformable
disordered media. Physical Review E 82 (4), 046305.
Holtzman, Ran & Segre, Enrico 2015 Wettability Stabilizes Fluid Invasion into Porous
Media via Nonlocal, Cooperative Pore Filling. Physical Review Letters 115 (16), 164501.
Holtzman, Ran, Szulczewski, Michael L. & Juanes, Ruben 2012 Capillary Fracturing in
Granular Media. Physical Review Letters 108 (26), 264504.
Homsy, G. M. 1987 Viscous Fingering in Porous Media. Annual Review of Fluid Mechanics
19 (1), 271–311.
Joekar-Niasar, V. & Hassanizadeh, S. M. 2012 Analysis of Fundamentals of Two-Phase
Flow in Porous Media Using Dynamic Pore-Network Models: A Review. Critical Reviews
in Environmental Science and Technology 42 (18), 1895–1976.
Joekar-Niasar, V., Hassanizadeh, S. M. & Dahle, H. K. 2010 Non-equilibrium effects
in capillarity and interfacial area in two-phase flow: dynamic pore-network modelling.
Journal of Fluid Mechanics 655, 38–71.
Jung, Michael, Brinkmann, Martin, Seemann, Ralf, Hiller, Thomas, Sanchez de LaSignatures of fluid-fluid displacement in porous media 11
Lama, Marta & Herminghaus, Stephan 2016 Wettability controls slow immiscible
displacement through local interfacial instabilities. Physical Review Fluids 1 (7), 074202.
Kadanoff, Leo P. 1985 Simulating hydrodynamics: A pedestrian model. Journal of Statistical
Physics 39 (3-4), 267–283.
Knudsen, Henning Arendt & Hansen, Alex 2002 Relation between pressure and fractional
flow in two-phase flow in porous media. Physical Review E 65 (5), 056310.
Lee, Hyundo, Gupta, Ankur, Hatton, T. Alan & Doyle, Patrick S. 2017 Creating
Isolated Liquid Compartments Using Photopatterned Obstacles in Microfluidics. Physical
Review Applied 7 (4), 044013.
Lenormand, Roland, Touboul, Eric & Zarcone, Cesar 1988 Numerical models and
experiments on immiscible displacements in porous media. Journal of Fluid Mechanics
189 (-1), 165.
Lenormand, Roland & Zarcone, Cesar 1985 Invasion Percolation in an Etched Network:
Measurement of a Fractal Dimension. Physical Review Letters 54 (20), 2226–2229.
Lenormand, R., Zarcone, C. & Sarr, A. 1983 Mechanisms of the displacement of one fluid
by another in a network of capillary ducts. Journal of Fluid Mechanics 135 (-1), 337.
Li, Shuwang, Lowengrub, John S., Fontana, Jake & Palffy-Muhoray, Peter 2009
Control of Viscous Fingering Patterns in a Radial Hele-Shaw Cell. Physical Review Letters
102 (17), 174501.
Måløy, Knut Jørgen, Feder, Jens & Jøssang, Torstein 1985 Viscous fingering fractals
in porous media. Physical Review Letters 55 (24), 2688–2691.
Måløy, Knut Jørgen, Furuberg, Liv, Feder, Jens & Jossang, Torstein 1992 Dynamics
of slow drainage in porous media. Physical Review Letters 68 (14), 2161–2164.
Meakin, P., Feder, J., Frette, V. & Jøssang, T. 1992 Invasion percolation in a destabilizing
gradient. Physical Review A 46 (6), 3357.
Meakin, Paul & Tartakovsky, Alexandre M. 2009 Modeling and simulation of pore-scale
multiphase fluid flow and reactive transport in fractured and porous media. Reviews of
Geophysics 47 (3), RG3002.
Meakin, P., Tolman, S. & Blumen, A. 1989 Diffusion-Limited Aggregation. Proceedings of
the Royal Society A: Mathematical, Physical and Engineering Sciences 423 (1864), 133–
148.
Moebius, Franziska & Or, Dani 2012 Interfacial jumps and pressure bursts during fluid
displacement in interacting irregular capillaries. Journal of Colloid and Interface Science
377 (1), 406–415.
Niemeyer, L., Pietronero, L. & Wiesmann, H. J. 1984 Fractal Dimension of Dielectric
Breakdown. Physical Review Letters 52 (12), 1033–1036.
Nittmann, Johann, Daccord, Gérard & Stanley, H. Eugene 1985 Fractal growth
viscous fingers: quantitative characterization of a fluid instability phenomenon. Nature
314 (6007), 141–144.
Odier, Céleste, Levaché, Bertrand, Santanach-Carreras, Enric & Bartolo, Denis
2017 Forced Imbibition in Porous Media: A Fourfold Scenario. Physical Review Letters
119 (20), 208005.
Paterson, Lincoln 1981 Radial fingering in a Hele Shaw cell. Journal of Fluid Mechanics
113 (-1), 513.
Primkulov, Bauyrzhan K., Talman, Stephen, Khaleghi, Keivan, Rangriz Shokri,
Alireza, Chalaturnyk, Rick, Zhao, Benzhong, MacMinn, Christopher W. &
Juanes, Ruben 2018 Quasistatic fluid-fluid displacement in porous media: Invasion-
percolation through a wetting transition. Phys. Rev. Fluids 3, 104001.
Rabbani, Harris Sajjad, Zhao, Benzhong, Juanes, Ruben & Shokri, Nima 2018 Pore
geometry control of apparent wetting in porous media. Scientific Reports 8 (1), 15729.
Saffman, P. G. & Taylor, G. 1958 The Penetration of a Fluid into a Porous Medium or
Hele-Shaw Cell Containing a More Viscous Liquid. Proceedings of the Royal Society A:
Mathematical, Physical and Engineering Sciences 245 (1242), 312–329.
Stokes, J. P., Weitz, D. A., Gollub, J. P., Dougherty, A., Robbins, M. O., Chaikin,
P. M. & Lindsay, H. M. 1986 Interfacial Stability of Immiscible Displacement in a
Porous Medium. Physical Review Letters 57 (14), 1718–1721.
Strang, Gilbert. 2007 Computational Science and Engineering. Wellesley-Cambridge Press.12 B.K. Primkulov et al.
Sygouni, Varvara, Tsakiroglou, Christos D. & Payatakes, Alkiviades C. 2006
Capillary pressure spectrometry: Toward a new method for the measurement of the
fractional wettability of porous media. Physics of Fluids 18 (5), 053302.
Sygouni, V., Tsakiroglou, C. D. & Payatakes, A. C. 2007 Using wavelets to characterize
the wettability of porous materials. Physical Review E 76 (5), 056304.
Toussaint, R, Løvoll, G, Méheust, Y, Måløy, K. J & Schmittbuhl, J 2005 Influence
of pore-scale disorder on viscous fingering during drainage. Europhysics Letters (EPL)
71 (4), 583–589.
Trojer, Mathias, Szulczewski, Michael L. & Juanes, Ruben 2015 Stabilizing Fluid-Fluid
Displacements in Porous Media Through Wettability Alteration. Physical Review Applied
3 (5), 054008.
Tryggvason, Gretar & Aref, Hassan 1983 Numerical experiments on Hele Shaw flow with
a sharp interface. Journal of Fluid Mechanics 136 (-1), 1.
Wilkinson, D. 1984 Percolation model of immiscible displacement in the presence of buoyancy
forces. Physical Review A 30 (1), 520–531.
Wilkinson, D. & Willemsen, J. F. 1983 Invasion percolation: a new form of percolation
theory. Journal of Physics A: Mathematical and General 16 (14), 3365–3376.
Witten, T. A., Sander, L. M. & Sander, I. M. 1981 Diffusion-Limited Aggregation, a
Kinetic Critical Phenomenon. Physical Review Letters 47 (19), 1400–1403.
Yortsos, Y. C., Xu, B. & Salin, D. 1997 Phase diagram of fully-developed drainage in porous
media. Physical Review Letters 79 (23), 4581–4584.
Zhao, Benzhong, MacMinn, Christopher W. & Juanes, Ruben 2016 Wettability control
on multiphase flow in patterned microfluidics. Proceedings of the National Academy of
Sciences of the United States of America 113 (37), 10251–6.You can also read