Water Quality Monitoring at Saratoga National Historical Park - Northeast Temperate Network 2013 Summary Report Natural Resource Data Series ...
←
→
Page content transcription
If your browser does not render page correctly, please read the page content below
National Park Service
 U.S. Department of the Interior

 Natural Resource Stewardship and Science

Water Quality Monitoring at Saratoga National
Historical Park
Northeast Temperate Network 2013 Summary Report
Natural Resource Data Series NPS/NETN/NRDS—2014/658
ON THE COVER
Kroma Kill, May 2013
Photograph by: Linda White
Water Quality Monitoring at Saratoga National
Historical Park
Northeast Temperate Network 2013 Summary Report
Natural Resource Data Series NPS/NETN/NRDS—2014/658

William G. Gawley
National Park Service
Acadia National Park
PO Box 177
Bar Harbor, Maine 04609

A. Hali Roy
National Park Service
Northeast Temperate Network
54 Elm Street
Woodstock, VT 05091

May 2014

U.S. Department of the Interior
National Park Service
Natural Resource Stewardship and Science
Fort Collins, Colorado
The National Park Service, Natural Resource Stewardship and Science office in Fort Collins,
Colorado, publishes a range of reports that address natural resource topics. These reports are of
interest and applicability to a broad audience in the National Park Service and others in natural
resource management, including scientists, conservation and environmental constituencies, and the
public.

The Natural Resource Data Series is intended for the timely release of basic data sets and data
summaries. Care has been taken to assure accuracy of raw data values, but a thorough analysis and
interpretation of the data has not been completed. Consequently, the initial analyses of data in this
report are provisional and subject to change.

All manuscripts in the series receive the appropriate level of peer review to ensure that the
information is scientifically credible, technically accurate, appropriately written for the intended
audience, and designed and published in a professional manner.

This report received informal peer review by subject-matter experts who were not directly involved
in the collection, analysis, or reporting of the data.

Views, statements, findings, conclusions, recommendations, and data in this report do not necessarily
reflect views and policies of the National Park Service, U.S. Department of the Interior. Mention of
trade names or commercial products does not constitute endorsement or recommendation for use by
the U.S. Government.

This report is available from the Northeast Temperate Network website
(http://science.nature.nps.gov/im/units/netn/monitor/programs/lakesPonds/lakesPonds.cfm) and the
Natural Resource Publications Management website (http://www.nature.nps.gov/publications/nrpm/).
To receive this report in a format optimized for screen readers, please email irma@nps.gov.

Please cite this publication as:

Gawley, W. G., A. H. Roy. 2014. Water quality monitoring at Saratoga National Historical Park:
Northeast Temperate Network 2013 summary report. Natural Resource Data Series
NPS/NETN/NRDS—2014/658. National Park Service, Fort Collins, Colorado.

NPS 374/124616, May 2014

                                                    ii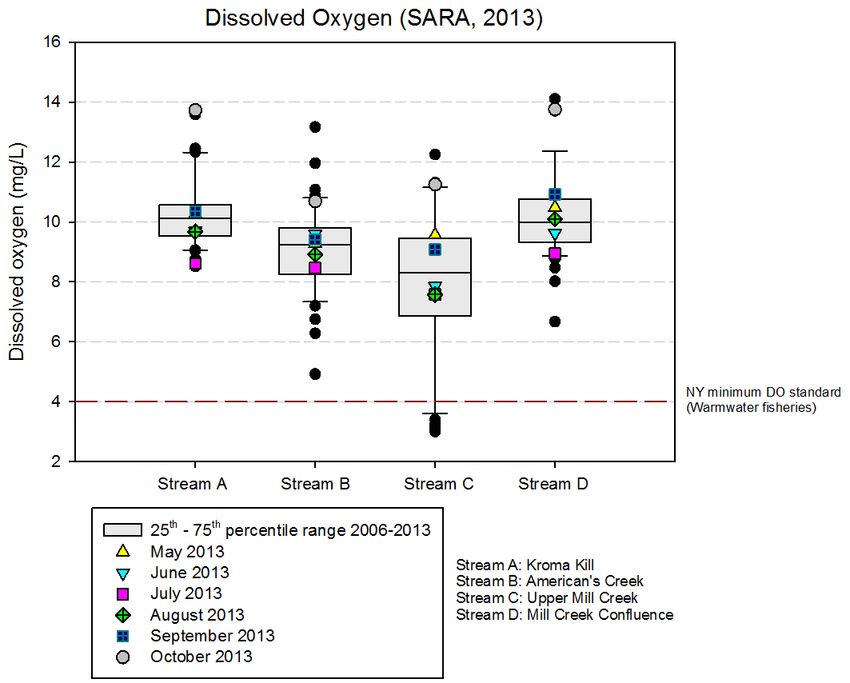
Contents
                                                                                                                                         Page

Figures ........................................................................................................................................v

Tables ....................................................................................................................................... vi

Executive Summary ................................................................................................................. vii

Introduction ................................................................................................................................1

Sampling Sites ............................................................................................................................1

Methods ......................................................................................................................................4

Water Quality Standards .............................................................................................................4

Results ........................................................................................................................................6

      Water Quality.......................................................................................................................7

           Specific Conductance ......................................................................................................7

           pH Level..........................................................................................................................8

           Temperature ....................................................................................................................9

           Dissolved Oxygen .........................................................................................................10

           Acid Neutralizing Capacity............................................................................................11

           Apparent Color ..............................................................................................................12

           Dissolved Organic Carbon .............................................................................................13

           Turbidity .......................................................................................................................14

      Nutrient Enrichment ..........................................................................................................15

           Phosphorus ....................................................................................................................15

           Nitrogen ........................................................................................................................16

      Other Analytes ...................................................................................................................17

           Chloride ........................................................................................................................17

           Sulfate ...........................................................................................................................18

                                                                       iii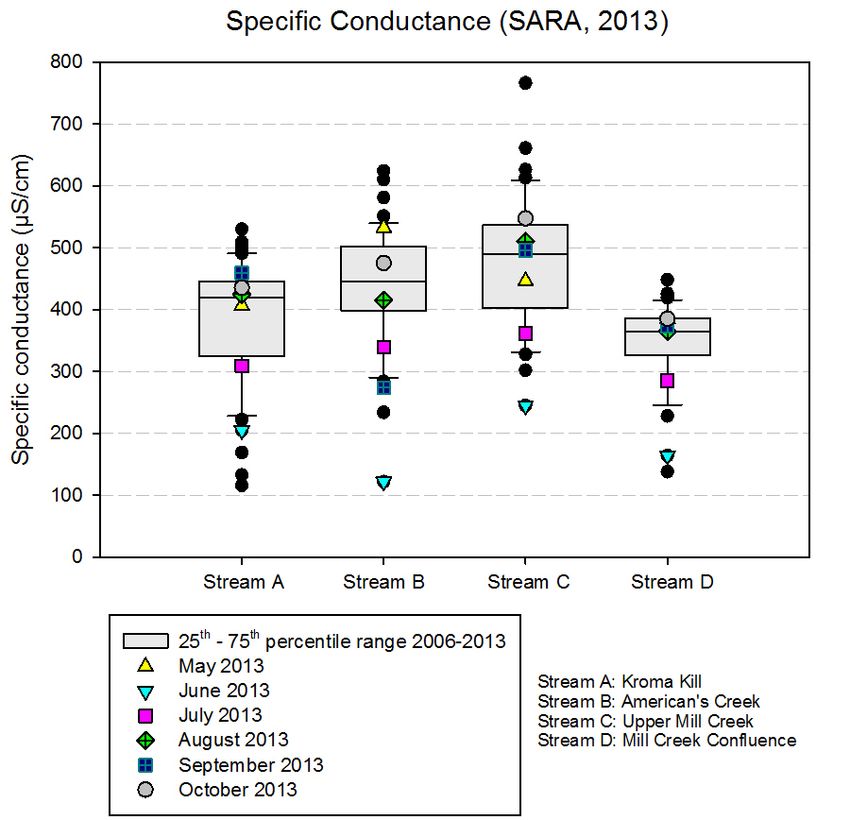
Contents (continued)
                                                                                                                                         Page

      Water Quantity ..................................................................................................................19

      Invasive Aquatic Plants .......................................................................................................20

Quality Assurance and Quality Control (QA/QC) ......................................................................21

      Nutrient QC Sample Results ...............................................................................................21

Summary...................................................................................................................................22

Literature Cited .........................................................................................................................23

Appendix A. Saratoga National Historical Park (SARA) Water Monitoring Data,
2013. .........................................................................................................................................23

Appendix B. Saratoga National Historical Park (SARA) Blank and Replicate Water
Samples, 2013. ..........................................................................................................................26

                                                                       iv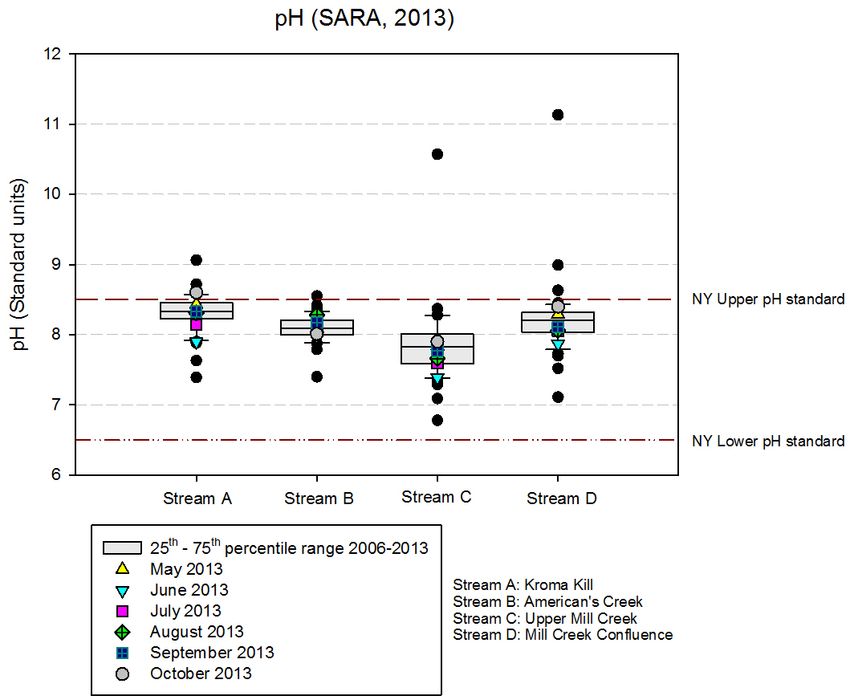
Figures
Page
Figure 1. NETN water monitoring sites at Saratoga NHP. ..........................................................2
Figure 2. Explanation of box plot graph......................................................................................6
Figure 3. Specific conductance from 2013 YSI sonde in-situ measurements overlaid
on a box plot of measurements taken from 2006-2013. ................................................................7
Figure 4. pH from 2013 YSI sonde in-situ measurements overlaid on a box plot of
measurements taken from 2006-2013. .........................................................................................8
Figure 5. Water temperature (surface) from 2013 YSI sonde in-situ measurements
overlaid on a box plot of measurements taken from 2006-2013. ..................................................9
Figure 6. Dissolved oxygen (surface) from 2013 YSI sonde in-situ measurements
overlaid on a box plot of measurements taken from 2006-2013. ................................................10
Figure 7. Acid neutralizing capacity from 2013 water samples overlaid on a box plot
of measurements taken from 2006-2013. ...................................................................................11
Figure 8. Apparent color from 2013 water samples overlaid on a box plot of
measurements taken from 2006-2013. .......................................................................................12
Figure 9. Dissolved organic carbon (DOC) from 2013 spring and summer water
samples. The data are overlaid on a box plot of measurements taken from 2012-2013. .............. 13
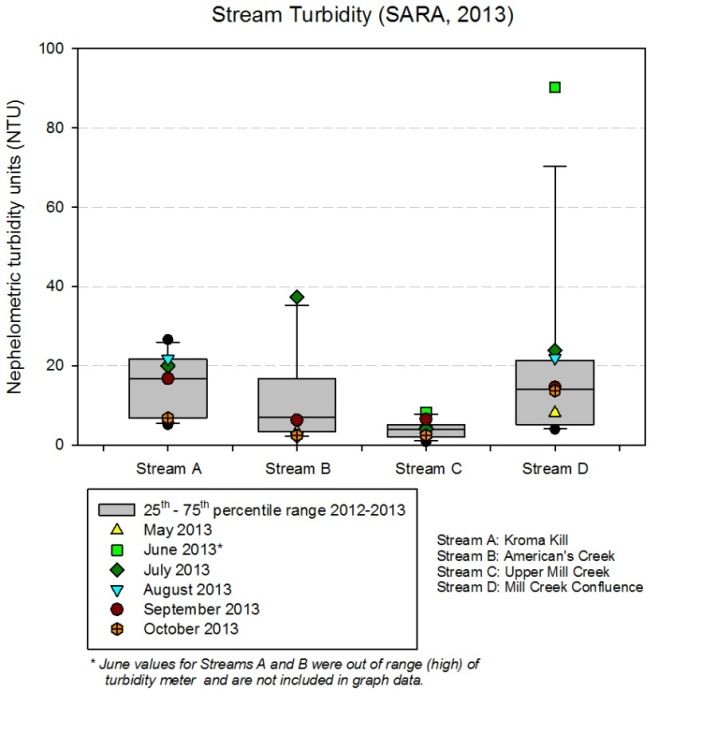
Figure 10. Stream turbidity from 2013 monthly measurements. The data are overlaid
on a box plot of measurements taken in 2012-2013. ..................................................................14
Figure 11. Total phosphorus (TP) from spring and summer water samples. The data
are overlaid on a box plot of measurements taken from 2006-2013............................................15
Figure 12. Total nitrogen (TN), nitrate (NO3-N), nitrite (NO2) and ammonia (NH3)
from 2013 water samples. The data are overlaid on a box plot of measurements taken
from 2006-2013. .......................................................................................................................16
Figure 13. Chloride from 2013 spring and summer water samples. The data are
overlaid on a box plot of measurements taken from 2012-2013. ................................................17
Figure 14. Sulfate from 2013 spring and summer water samples. The data are
overlaid on a box plot of measurements taken from 2012-2013. ................................................18
Figure 15. Stream stage obtained in 2013 by measuring from a permanent datum
point to the water surface. .........................................................................................................19
v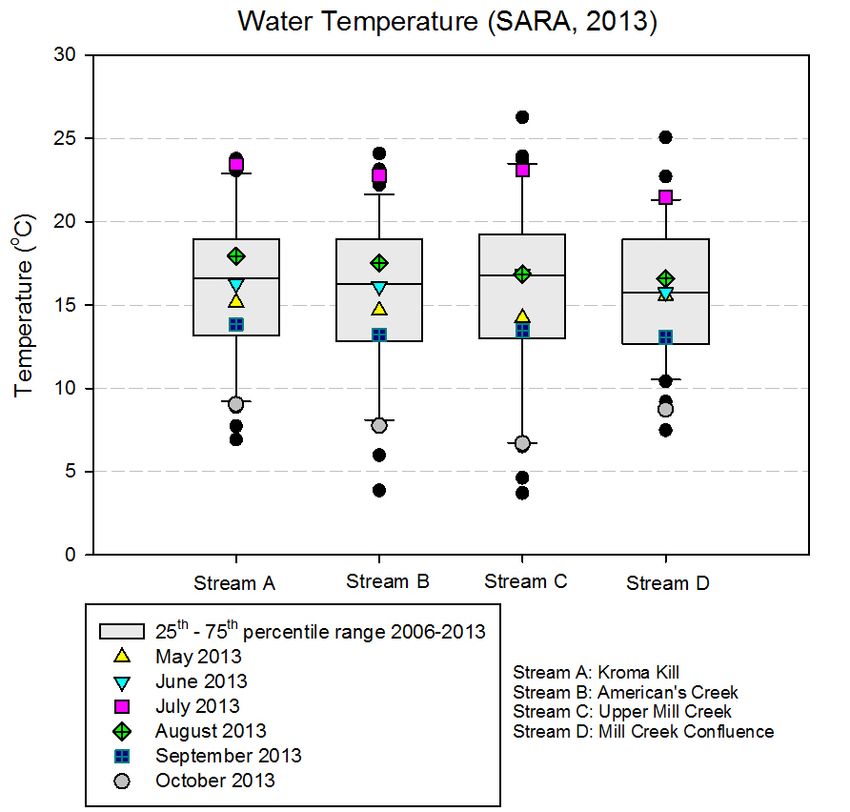
Tables
                                                                                                                 Page

Table 1. Water quality monitoring sites at Saratoga NHP............................................................3

Table 2. New York stream water quality standards. ....................................................................5

Table 3. EPA Ecoregion 7 nutrient criteria for streams. ..............................................................5

                                                          vi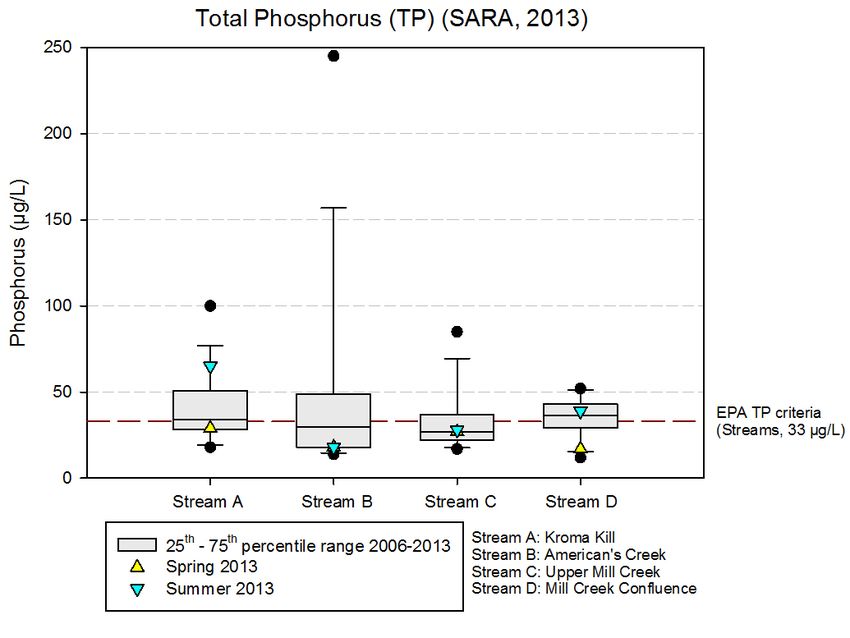
Executive Summary
This report on the water quality of Saratoga National Historical Park (SARA) includes data gathered
by the Northeast Temperate Network (NETN) in the 2013 monitoring season and displays these
results in graphic form, accompanied by a brief interpretation. The data address the NETN objective
to detect change in the status of physical, chemical, or biological attributes of park freshwater bodies.

The NETN Freshwater Monitoring Protocol calls for a total of four park streams to be sampled
monthly from May through October at SARA. Staff measured physical and in-situ water
chemistry parameters each month and periodically collected water samples for analysis at the
University of Maine’s Sawyer Environmental Chemistry Research Laboratory.

Monthly sampling parameters included in-situ water quality measures (pH, specific conductance,
temperature, dissolved oxygen, and turbidity), weather, stream flow (discharge), and stream
stage. In May and August, water samples were obtained and analyzed for acid neutralizing
capacity (ANC), color, nutrients, dissolved organic carbon (DOC), chloride, and sulfate.

Most water quality parameters for the monitored streams were within state standards, and were
generally within the ranges of the historic NETN monitoring data from SARA. The exception was
pH in Kroma Kill, which exceeded the state standard in October. Kroma Kill and the Mill Creek
Confluence had high values for color, turbidity, TP, TN, and NO3. The pattern suggests impacts on
the water quality due to agricultural activity in the watershed, and TP and TN values were well above
the non-regulatory EPA criteria. The TN values were well above the 2.0 mg/L standard used in some
other northeastern states (New York has no numeric TP standard). Other findings of note include
high chloride values in Upper Mill Creek and more moderate values in Kroma Kill and the Mill
Creek Confluence. The chloride levels are likely due to runoff from road deicing. In addition, the
sulfate level in American’s Creek was high, possibly due to natural sources. ANC measurements
showed that all streams had sufficient buffering to avoid severely depressed pH values from spring
snowmelt and runoff that can contribute acidity and sediment to the stream water.

                                                   vii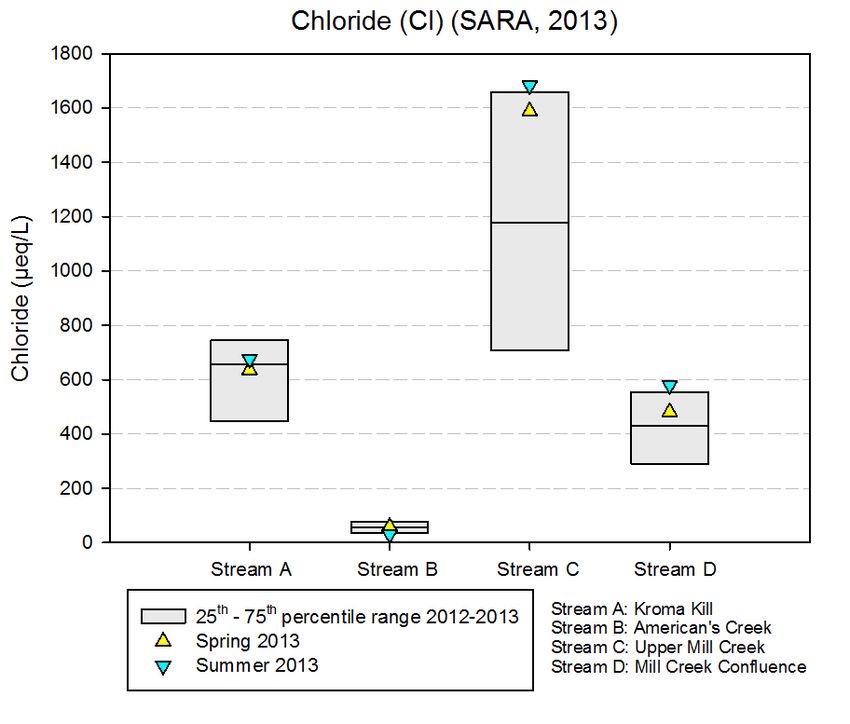
Introduction
This report on the water quality of Saratoga National Historical Park (SARA) generated by the
Northeast Temperate Network (NETN) Water Quality Monitoring Program includes data gathered in
the 2013 monitoring season and displays these results in graphic form, accompanied by a brief
interpretation. Appendix A contains tabular data collected in 2013.
The vital signs for freshwater bodies included in the NETN Freshwater Monitoring Protocol
(Lombard et al. 2006) are water chemistry, nutrient enrichment, water quantity, and the detection of
invasive plant species. These metrics were chosen to address the NPS Inventory and Monitoring
Program objective to detect change in the status of physical, chemical, or biological attributes of the
ecosystem.
The NETN Freshwater Monitoring Protocol calls for a total of four park streams to be sampled
monthly from May through October at SARA. A NETN hydrologic technician measured physical
and in-situ water chemistry parameters each month and periodically collected water samples for
analysis at the University of Maine’s Sawyer Environmental Chemistry Research Laboratory. All
monitoring data are incorporated into a series of comprehensive databases that ultimately feed the
U.S. Environmental Protection Agency’s “STORET” data system, the repository for all NPS water
quality and quantity data.
Sampling Sites
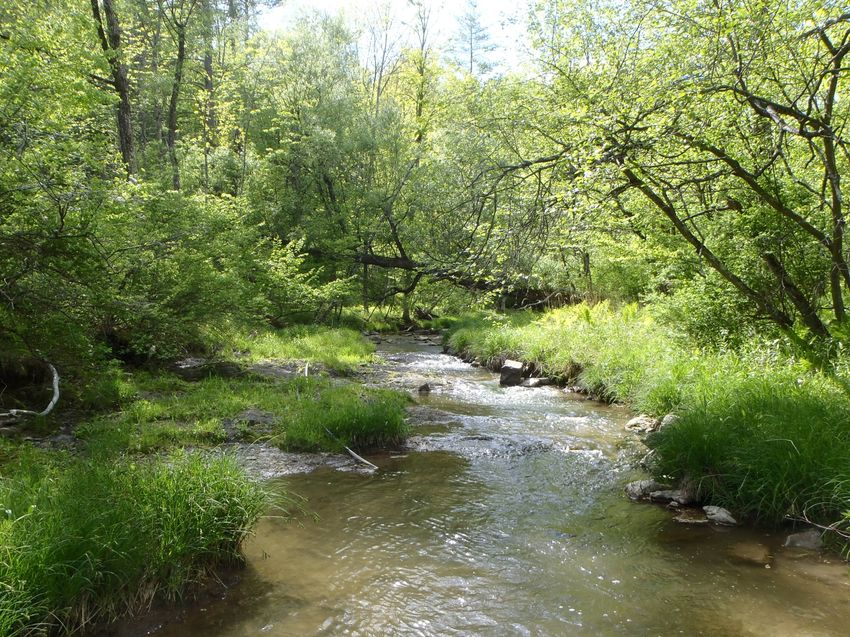
There are 8 miles of perennial streams divided between four watersheds in SARA that all flow into
the Hudson River (Figure 1). These watersheds are the Kroma Kill, Mill Creek, American’s Creek
and Great Falls Creek. In addition, the historic ruins of the old Champlain Canal cut across the
downstream end of the major drainages of park, and water from the Hudson River can back up into
the park. Since there are no major ponds or impoundments in Saratoga, NETN monitoring is
designed to characterize only the streams in the park (Lombard et al 2006).
One monitoring site has been identified in each major watershed in the park where water quality
samples can be taken and streamflow measured (Table 1). In addition, there are major tributaries in
the Mill Creek watershed within park boundaries, and thus an additional site has been identified on
the North Fork of Mill Creek. The three park streams monitored by NETN are considered warm
water fisheries, capable of supporting bass, perch, sunfish, and similar species (Vana-Miller et al
2001). Kroma Kill (SARASA) is a third order stream in the park and is monitored upstream of the
first bridge crossing along the Park Entrance Road from Route 4. The bridge provides an adequate
staff gage site, a constricted area for hydraulic control, and a platform for sampling during high
flows.
The sample site established for American’s Creek (SARASB) is below Bemis Point at the end of the
American River Fortifications. Here the stream flows through a narrow channel incised into bedrock.
Flow proves difficult to measure in very dry years.
1Mill Creek enters the Hudson River as a second order stream. The Upper Mill Creek site (SARASC)
is located near where the stream enters the park, just downstream of the park tour road. The stream is
very small at this location but appears to be perennial and the box culvert can be used for accurate
discharge measurements when flows are elevated.
The Lower Mill Creek site (SARASD) is approximately 200 m downstream of the confluence of the
North and South Forks (historic site SARA0053). This site provides an integrated sample for the
watersheds of the North and South Forks. The South Fork can have low flow and would not be a
reliable year-round sampling site that meets sampling site criteria.
Figure 1. NETN water monitoring sites at Saratoga NHP.
2Table 1. Water quality monitoring sites at Saratoga NHP.
Water Body NETN Site Code Latitude Longitude
Kroma Kill (Stream A) SARASA 43.0058333 -73.61730
American’s Creek (Stream B) SARASB 42.9771667 -73.63100
Upper Mill Creek (Stream C) SARASC 42.9973833 -73.64855
Mill Creek Confluence (Stream D) SARASD 42.9889500 -73.62555
3Methods
Detailed descriptions of all monitoring methods are found in the original protocol (Lombard et al.
2006) and the most recent protocol update (Gawley et al. 2014). Monthly sampling parameters
included in-situ water quality measures (pH, specific conductance, temperature, and dissolved
oxygen) determined with a YSI 600XL sonde, turbidity measured with a LaMotte 2020e meter,
weather, stream flow (discharge), and stream stage (water level). In May and August, water samples
were obtained and analyzed for acid neutralizing capacity (ANC), color, and nutrients. Beginning in
2012, fractions of these water samples were also analyzed for dissolved organic carbon (DOC),
chloride, sulfate, and chlorophyll a. Nutrient chemistry parameters were analyzed from a grab sample
obtained by submerging the sample bottle directly in the stream with a gloved hand.
Stream discharge was measured using U.S. Geological Survey protocols (Rantz et al 1982),
employing a measuring tape, wading rod, and a SonTek FlowTracker current meter or a Price Pygmy
current meter to measure a particular cross-sectional area of the stream and the velocity of the water
at that cross section. Stream stage was measured by using a measuring tape or folding ruler to “tape
down” or “tape up” from a fixed datum point to the surface of the water, or by reading the water level
off of a staff gauge. Bolts were installed to permanently mark some of the datum points in July 2012.
Staff gauges were installed at Upper Mill Creek in July 2013 and Kroma Kill in August 2013.
In-situ stream water chemical and physical measurements and water samples were collected within 5
meters from the location of the discharge measurement. Sonde measurements were taken in the main
stream flow with care taken that the sonde was not resting directly on the stream bottom.
Water Quality Standards
New York’s Surface Water Quality Standards (New York State Department of Environmental
Conservation 2008) designates Class AA as the most restrictive stream classification for water
quality. The standard for color states there will be none that will “impair the waters for their best
usages”. For phosphorus and nitrogen, there will be “none in amounts that will result in growths of
algae, weeds and slimes that will impair the waters for their best usages.” pH “shall not be less than
6.5 nor more than 8.5,” color “shall not exceed 15 color units (platinum-cobalt method),” and
turbidity “shall not exceed 5 nephelometric units” (New York State Department of Environmental
Conservation 2008).
“For trout spawning waters (TS), the DO concentration shall not be less than 7.0 mg/L from other
than natural conditions. For trout waters (T), the minimum daily average shall not be less than 6.0
mg/L, and at no time shall the concentration be less than 5.0 mg/L. For nontrout waters, the
minimum daily average shall not be less than 5.0 mg/L, and at no time shall the DO concentration be
less than 4.0 mg/L” (New York State Department of Environmental Conservation 2008).
4Table 2. New York stream water quality standards.
Color
Min
Water quality Max pH Range Max Total Max Total (color units,
Dissolved Turbidity Sulfate
classification Temperature (standard Nitrogen Phosphorus platinum-
Oxygen (NTU) (mg/L)
code (°C) units) (µg/L) (µg/L) cobalt
(mg/L)
method)
No
No algae
AA -- 4.0 6.5-8.5 algae -- -- --
growth
growth
EPA Ecoregion 7 water quality criteria (Table 2; U.S. Environmental Protection Agency 2000) are
also used as a benchmark in this report. EPA water quality criteria for nutrients help translate
narrative criteria within State or Tribal water quality standards by establishing values for causal
variables (e.g., total nitrogen and total phosphorus) and response variables (e.g., turbidity and
chlorophyll a). Causal variables are necessary to provide sufficient protection of designated uses
before impairment occurs and to maintain downstream uses. Early response variables are necessary
to provide warning signs of possible impairment and to integrate the effects of variable and
potentially unmeasured nutrient loads (U.S. Environmental Protection Agency 2002).
Table 3. EPA Ecoregion 7 nutrient criteria for streams.
Nutrient Criteria Value
Total Phosphorus 33 μg/L
Total Nitrogen 0.54 mg/L
These criteria were developed specifically for Ecoregion 7 (which includes both NETN parks in New
York) and are designed to represent conditions of surface waters that are minimally impacted by
human activities and thus protect against the adverse effects of nutrient over-enrichment from
cultural eutrophication. The values are EPA’s scientific recommendations regarding ambient
concentrations of nutrients that protect aquatic resource quality. They do not have any regulatory
impact or meaning.
The criteria were established based on the lower 25th percentile of streams for which the EPA found
data. This percentile of all streams is expected to approximately correspond to the 75th percentile of
reference (undisturbed) streams. In other words, 75% of streams in the ecoregion do not meet the
criteria, nor do roughly 25% of reference streams. (U.S. Environmental Protection Agency 2000).
5Results
Monitoring results for 2013 are displayed in scatter-plot graphs showing all data for each site for a
given parameter. The scatter plots of 2013 data are overlaid on box plots representing the overall
range and distribution of data values collected from 2006 through 2013 for the specified parameter
and site (Appendix A contains all data in tabular form). A box plot (Figure 2) is a summary plot that
graphs data as a box representing statistical values. The boundary of the box closest to zero indicates
the 25th percentile, a line within the box marks the median, and the boundary of the box farthest from
zero indicates the 75th percentile. Whiskers (error bars) above and below the box indicate the 90th and
10th percentiles respectively. Outliers are displayed as black filled circles. At least nine data points
are required to compute the 5th, 10th, 90th and 95th percentiles. If a percentile point cannot be
computed, that set of points is not drawn. If EPA or other water quality criteria exist for a particular
parameter they are displayed on the graphs as specification lines.
Figure 2. Explanation of box plot graph.
6Water Quality
Measures of water quality include specific conductance, pH, water temperature, dissolved oxygen
(DO), acid neutralizing capacity (ANC), and apparent color. Assessment of water quality data aids in
the interpretation of the biotic condition and ecological processes of surface water resources.
Specific Conductance
Specific conductance (Figure 3) is a measure of the ability of water to carry an electrical current, and
is directly related to the level of dissolved ions in the water. An increase in specific conductance can
be an indicator of pollutants in the water. Naturally occurring values range from less than 20 to more
than 1,000 microsiemens per centimeter (μS/cm). Specific conductance values from 2013 were
within the appropriate range for high ionic strength waters, and were generally within the range of
values shown on the box plots. The June values at American’s Creek (Stream B) and Upper Mill
Creek (Stream C) were the lowest values on record for each site.
Figure 3. Specific conductance from 2013 YSI sonde in-situ measurements overlaid on a box plot of
measurements taken from 2006-2013.
7pH Level
The pH of a water body reflects how acidic or basic the water is, measured on a scale of 1 to 14, with
7 being neutral. Acid waters are below 7, and alkaline waters are above 7. A one unit change in pH
represents a 10-fold change in acidity or alkalinity. New York standards, like those of most northeast
states, indicate that a pH between 6.5 and 8.5 is within the acceptable range. pH values from the 2013
monitoring season (Figure 4) were basic, and were between the upper and lower New York water
quality standards, with the exception of the October value at Kroma Kill (Stream A).
Figure 4. pH from 2013 YSI sonde in-situ measurements overlaid on a box plot of measurements taken
from 2006-2013.
8Temperature
Temperature can affect water chemistry and biology. For example, the amount of oxygen that water
can hold is directly related to the temperature of the water. The higher the temperature, the less
oxygen water can hold, which can be observed in both diel (day and night) and seasonal shifts.
Oxygen will naturally decline during the summer months as water temperatures rise. Temperature
can also determine the kinds of plants and animals found in the lake or pond. Certain species of fish,
insects, and algae will predominate during the cooler temperatures of the spring and fall, yet be less
apparent during the warmer temperatures of summer. The majority of the surface water temperatures
(Figure 5) appeared to be within the normal range of variability in 2013, and as expected the coldest
values were recorded in October and the warmest were recorded in July.
Figure 5. Water temperature (surface) from 2013 YSI sonde in-situ measurements overlaid on a box plot
of measurements taken from 2006-2013.
9Dissolved Oxygen
Dissolved oxygen (DO) is a critical indicator of water quality because aquatic life generally needs
DO concentrations at or above 5 mg/L to thrive. Low oxygen can directly kill or stress organisms
such that they will not be able to successfully reproduce or grow. Water with less than 1 part per
million (ppm) of oxygen is considered anoxic (no oxygen present). All SARA sites were well
oxygenated in 2013 (Figure 6), and above the 4 mg/L state DO standard.
Figure 6. Dissolved oxygen (surface) from 2013 YSI sonde in-situ measurements overlaid on a box plot
of measurements taken from 2006-2013.
10Acid Neutralizing Capacity
Acid neutralizing capacity (ANC) is also known as alkalinity, or buffering capacity. It is due
primarily to the presence of naturally available bicarbonate, carbonate, and hydroxide ions, with
bicarbonate being the major form. Most states do not have numerical criteria for ANC in their water-
quality standards. ANC values greater than 100 μeq/L are considered well-buffered, while values less
than zero typify acidic waters (Stoddard et al. 2003). Acid neutralizing capacity measured in the 2013
samples (Figure 7) illustrates that SARA streams were extremely well-buffered, likely due to the
underlying geology. The SARA streams did not follow the typical pattern of lower May (Spring)
ANC values. This pattern usually occurs due to episodic acidification from spring snowmelt and
runoff.
Figure 7. Acid neutralizing capacity from 2013 water samples overlaid on a box plot of measurements
taken from 2006-2013.
11Apparent Color
Color in pond and stream water is caused by natural metallic ions, humus and peat materials,
plankton, weeds, and industrial wastes. Color is reported in Pt-Co units (PCU). True color is the color
measurement of water from which suspended particles have been removed by filtration. Apparent
color (the measurement method utilized by NETN) is determined on original samples without
filtration. Color can be a rough indicator for organic acidity.
Water bodies with apparent color values of greater than 25 PCU are considered to be highly colored,
and often exhibit reduced water clarity and high phosphorus concentrations. Values of color are
usually not included in water quality standards, except to note that they should be “as naturally
occurs”.
Most of the color measurements from 2013 monitoring were near or above median color values
displayed on the boxplot (Figure 8), and show SARA streams to be highly colored. Summer color
values for Kroma Kill and the Mill Creek Confluence were among the highest recorded for each site,
and may reflect contributions from agricultural activity in the watersheds. Much of the color is likely
due to runoff and sediment input to the streams, rather than dissolved constituents, since the samples
were not filtered before analysis.
Figure 8. Apparent color from 2013 water samples overlaid on a box plot of measurements taken from
2006-2013.
12Dissolved Organic Carbon
NETN began measuring dissolved organic carbon in 2012. Carbon is a nutrient required for
biological processes. Sources of organic carbon in water include humic substances from plant and
soil organic matter, wetland peat deposits, and atmospheric deposition. Certain forms of DOC can
contribute to “tea” color in water, which can affect light attenuation. DOC is also an important part of
the energy balance and acid-base chemistry in many freshwater systems. It also affects the transport
(solubility and bioavailability) of metals, including mercury, in aquatic systems.
DOC concentrations in most streams in temperate zones range from 1 mg/L to 20 mg/L, with a
worldwide mean of 5.75 mg/L (Meybeck 1982). SARA DOC concentrations (Figure 9) were
moderate in 2013.
Figure 9. Dissolved organic carbon (DOC) from 2013 spring and summer water samples. The data are
overlaid on a box plot of measurements taken from 2012-2013.
13Turbidity
Turbidity is the measure of the relative clarity of a liquid. It is measured by passing light through a
water sample to determine how much light is scattered, and the results are reported in nephelometric
turbidity units (NTU). Turbidity is caused by suspended matter or impurities that interfere with the
clarity of the water. These impurities may include clay, silt, finely divided inorganic and organic
matter, soluble colored organic compounds, and plankton and other microscopic organisms. In
natural waters, turbidity is often used as an indicator of water quality and productivity. Turbidity is
measured in the field using an electronic meter.
Turbidity in the water can create aesthetic, ecological, and health issues. Turbid water may indicate
runoff from construction, roads, agriculture or other types of pollution. Suspended sediment can
carry nutrients and pesticides throughout the water system. Suspended particles near the surface
absorb additional heat from sunlight, raising the water temperature. High turbidity levels can reduce
the amount of light reaching lower depths of lakes and streams, which can inhibit growth of
submerged aquatic plants, and reduce dissolved oxygen levels. Suspended materials can clog fish
gills, affecting fitness, growth, and reproduction (U.S. Environmental Protection Agency 1997). A
number of the turbidity values measured in SARA streams during 2013 (Figure 10), the second year
of NETN turbidity testing, were greater than the expected range of dry-weather turbidity of surface
waters, which normally
ranges from 0 to 10 NTU
(U.S. Environmental
Protection Agency 1999).
Occasional higher values at
Kroma Kill, American’s
Creek, and the Mill Creek
Confluence may be attributed
to runoff from precipitation
events prior to sampling.
However, consistently high
values at sites at Kroma Kill
and the Mill Creek
Confluence may also reflect
agricultural activity in the
watersheds. June values for
Kroma Kill and American’s
Creek were eliminated due to
a rain event leading to
turbidity values outside of the
range of the turbidity meter.
Figure 10. Stream turbidity from 2013 monthly measurements. The data are overlaid on a box plot of
measurements taken in 2012-2013.
14Nutrient Enrichment
Nutrient enrichment and the acceleration of eutrophication have been identified in most NETN parks
as one of the stressors of greatest concern. Total phosphorus and several forms of nitrogen are
measured to give managers information regarding the trophic status and productivity of freshwater
systems.
Phosphorus
Phosphorus (P) is one of the major nutrients needed for plant growth. It is generally present in small
amounts in natural systems and limits the plant growth in streams and ponds. Total phosphorus (TP)
is a measure of both inorganic and organic forms of phosphorus, and is the common water quality
standard or criteria metric. Although several forms of phosphorus were tested individually since
2006, tests for total dissolved phosphorus (TDP) and soluble reactive phosphorus (SRP) were
discontinued in 2012.
In 2013 all total phosphorus concentrations (Figure 11) were moderately high. Most of the
measurements were below the EPA Ecoregion 7 criterion of 33 µg/L and two measurements (one
from Kroma Kill and one from Mill Creek Confluence) were above the criterion. As described above
(“Water Quality Standards”), the EPA criteria do not have any regulatory meaning.
Figure 11. Total phosphorus (TP) from spring and summer water samples. The data are overlaid on a
box plot of measurements taken from 2006-2013.
15Nitrogen
Total nitrogen (TN) is a measure of all forms of nitrogen (organic and inorganic). Nitrogen is an
essential plant element and is often the limiting nutrient in marine waters, and it can also limit some
freshwater systems. The importance of nitrogen in the aquatic environment varies according to the
relative amounts of the forms of nitrogen present, including nitrate, nitrite, and ammonia. Nitrate
(NO3) is the most oxidized and stable form of nitrogen in a water body, and is the primary form of
nitrogen used by plants as a nutrient. Nitrite (NO2) is an unstable form of nitrogen that is either
rapidly oxidized to nitrate (nitrification) or reduced to nitrogen gas (de-nitrification). This form of
nitrogen can also be used as a source of nutrients for plants. Ammonia (NH3) is generated by bacteria
as a decomposition product of nitrogenous organic compounds, and is also readily assimilated by
plants. Results of NO3, NO2, and NH3 tests are all reported as the concentrations of the N component
of these compounds, expressed in mg/L.
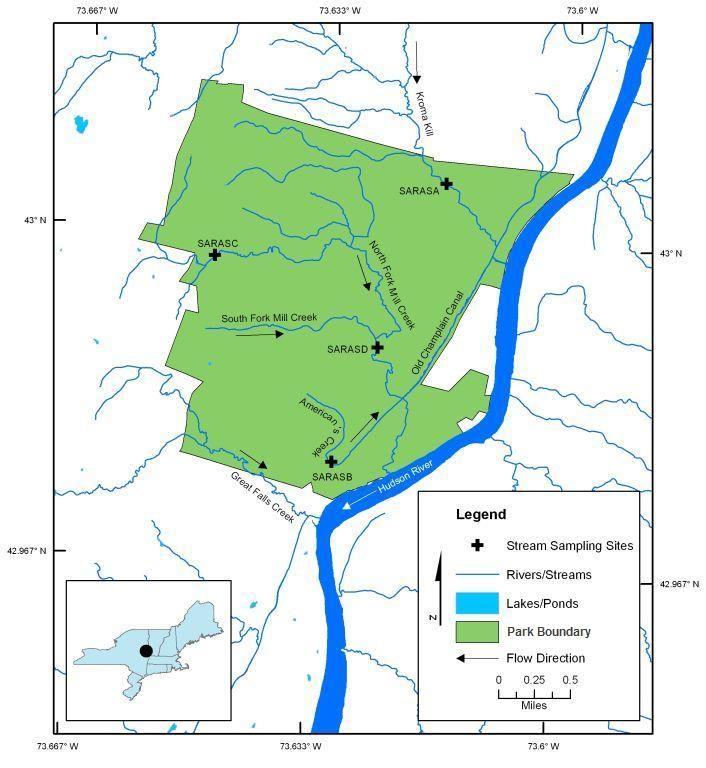
Test results for several forms of nitrogen are shown in Figure 12. TN values for Kroma Kill and the
Mill Creek Confluence were high and exceeded the EPA Region 7 criterion of 0.54 mg/L, although
as with TP this criterion does not have regulatory meaning. NO3 results from these sites were also
extremely high, suggesting effects from agricultural activities in the watersheds. TN measurements at
these sites were above 2.0 mg/L, the value used as a TN standard in several northeast states (New
York has no numeric TN standard). Nitrite test results in all streams were low, and all of the 2013
ammonia test results were below the method reporting limit of 0.08 mg/L.
Figure 12. Total nitrogen (TN), nitrate (NO3-N), nitrite (NO2) and ammonia (NH3) from 2013 water
samples. The data are overlaid on a box plot of measurements taken from 2006-2013.
16Other Analytes
Chloride
Chloride is one of the major negatively-charged ions in fresh water systems. The chloride content of
natural surface waters will depend to a great extent on the geology of the area. Concentrations are
generally greater in lakes that are in proximity to marine regions. Another source of chloride is road
run-off from de-icing materials. Chloride is important in terms of metabolic processes, as it
influences osmotic salinity balance and ion exchange.
Average chloride concentration in natural fresh water is 234.1µeq/L (Wetzel 1983). Chloride values
in SARA samples were moderately high in 2013, with the exception of low values at American’s
Creek (Stream B) and high values at Upper Mill Creek (Stream C) (Figure 13).
Figure 13. Chloride from 2013 spring and summer water samples. The data are overlaid on a box plot of
measurements taken from 2012-2013.
17Sulfate
Sulfate is found in most natural waters, originating from watershed geology and soils, and also from
atmospheric transport and deposition (in precipitation) of by-products from the combustion of fossil
fuels. Sulfate can play a major role in acidification of lakes and streams. Sulfate concentrations in
atmospheric deposition have declined significantly since 1982, in part due to the 1995
implementation of Phase I controls of the Clean Air Act Amendments and in part to other long-term
pollution reduction efforts (Kahl 1999).
The usual range of sulfate concentration in natural water is 104 µeq/L to 695 µeq/L (Wetzel 1983).
Sulfate concentrations at SARA were moderate in most sites and very high in American’s Creek in
2013 (Figure 14).
Figure 14. Sulfate from 2013 spring and summer water samples. The data are overlaid on a box plot of
measurements taken from 2012-2013.
18Water Quantity
Monthly stream discharge measurements, taken with a current meter and wading rod, can be used to
calculate loading of nutrient chemical constituents (flow times concentration), and also provide a
record of variations in stream flow. Stream stage (height of water) measurements can be paired with
discharge values and over time a stage to discharge relationship can be calculated. Once this
relationship is established, investigators can interpolate the stream discharge from the stage
measurement alone. Numerous discharge measurements at all ranges of streamflow are required to
establish and maintain an accurate stage to discharge relationship. Stream stage measurements from
2013 are graphed in Figure 15. Discharge and stage measurements from 2013 are listed in Table A3
in Appendix A.
Stage measurements were consistent during the 2013 season. Higher stage measurements in June and
July indicate rain events. NETN staff are currently reviewing discharge and stage measurement
methodology and quality assurance/quality control procedures in order to enhance the quality and
utility of the water quantity data. A stage to discharge relationship graph will be produced once
sufficient data are collected.
Figure 15. Stream stage obtained in 2013 by measuring from a permanent datum point to the water
surface.
19Invasive Aquatic Plants
Invasive aquatic plant monitoring was not conducted at SARA during the 2013 monitoring season,
since the protocol specifies that targeted invasive aquatic plant monitoring is only conducted at pond
and lake sites. However, during future visits to all NETN parks, monitoring crews will be
increasingly attentive for the presence of Didymo (Didymosphenia geminata), also known as “rock
snot,” a highly invasive algae species that has recently invaded the northern reaches of the
Connecticut River in New Hampshire and the White River and Battenkill Rivers in Vermont. This
species has a great potential to alter habitats and displace native species, and is of great concern to
officials in regions where infestations have been established.
Didymo can easily be spread by waders and potentially by water monitoring equipment and other
gear that touches the bottoms of streams in infested areas. Just one cell breaking off and drifting
downstream can spread the algae. Enhanced equipment cleaning and decontamination procedures are
being included in the latest NETN monitoring protocol revision (Gawley et al. 2014).
Since non-native, invasive plants have recently been detected with increasing frequency in
Northeastern lakes and ponds, it has become crucial to closely monitor the status of park waters. The
early detection of an infestation can make eradication or control more feasible, and it can lead to
efforts that reduce the spread of the plant to neighboring water bodies. Designating the early
detection of these plants as a NETN vital sign and the ongoing partnership with state and local
monitoring and eradication efforts are highly effective prevention strategies.
20Quality Assurance and Quality Control (QA/QC)
QA/QC is important to the success of a long-term data collection and trend detection program.
Quality assurance (QA) is achieved through the establishment and use of the NETN Freshwater
Monitoring Protocol. Specific procedures are used to control critical components of a project such as
sampling at the right place with the right equipment and using the right methods. Over the years, staff
will change, equipment may be updated, and methods may evolve. Although these changes will be
kept to a minimum, changes are inevitable and therefore following an established and well-
documented protocol will ensure that the data remain valid.
QA requirements incorporated in the protocol include consistency and low turnover in project leaders
and staff, consistency in staff training and oversight, consistency in equipment used and calibration
methods, the selection of a well-established chemical laboratory with a proven track record, and a
robust sample design that includes an adequate number of field and laboratory quality control (QC)
samples.
QC includes the assessment of bias and variability through the use of additional samples such as
blank and replicate samples. QC samples are an objective assessment of whether or not QA protocols
are adequate. The protocol calls for the collection of two blank and two replicate samples (one each
from lakes/ponds and streams, respectively) during both the spring and summer nutrient sampling
months at Acadia NP, and the same number, distribution, and schedule at the combined eight “Lower
NETN” parks. Sample collection sites are selected at random from both monitoring groups.
The latest (2014) protocol revision requires in situ measurements, including Secchi transparency,
sonde water quality, and stream discharge, to be periodically replicated to ensure that field equipment
and observers are performing within the required precision standards. Water quality sonde
temperature, pH and specific conductance measurements are to be compared monthly in the
laboratory with similar measurements made with a NIST-traceable thermometer and benchtop pH
and conductivity meters. Sonde dissolved oxygen measurements will be compared in the field to
measurements made using a LaMotte dissolved oxygen test kit (Winkler titration method). These
additional procedures will begin network-wide in the 2014 monitoring season.
Nutrient QC Sample Results
Analysis results of all 2013 blank samples collected from Lower NETN ponds and streams
(Appendix B, Table B1) were below the method reporting limits, indicating little or no contamination
was introduced during the sampling, handling and analysis processes. Replicate sample analysis
results (Appendix B, Table B2) showed that most Lower NETN samples were in the acceptable
range of precision (relative percent difference < 10%). The replicate pair from SAIRSB (Turning
Basin at Saugus Iron Works NHS) was the notable exception to this statement. There is a significant
tidal influence on Turning Basin water quality, and the highly elevated chloride and sulfate
concentrations in the replicate sample suggest that this sample was collected after the (flood) tide
change.
21Summary
Most water quality parameters for the monitored streams were within state standards, and were
generally within the ranges of the historic NETN monitoring data from SARA. The exception was
pH in Kroma Kill, which exceeded the state standard in October. Kroma Kill and the Mill Creek
Confluence had high values for color, turbidity, TP, TN, and NO3. The pattern suggests impacts on
the water quality due to agricultural activity in the watershed, and TP and TN values were well above
the non-regulatory EPA criteria. The TN values were well above the 2.0 mg/L standard used in some
other northeastern states (New York has no numeric TP standard). Other findings of note include
high chloride values in Upper Mill Creek and more moderate values in Kroma Kill and the Mill
Creek Confluence. The chloride levels are likely due to runoff from road deicing. In addition, the
sulfate level in American’s Creek was high, possibly due to natural sources. ANC measurements
showed that all streams had sufficient buffering to avoid severely depressed pH values from spring
snowmelt and runoff that can contribute acidity and sediment to the stream water.
Monitoring under the NETN protocol builds on the historic water quality monitoring by the National
Park Service and other agencies to provide critical baseline information on the chemical and physical
status of the streams monitored in Saratoga National Historical Park. Several changes implemented
in the 2012 monitoring season, including the addition of sulfate, chloride, and dissolved organic
carbon (DOC) analyses to the spring and summer water chemistry testing, are helping to expand the
scope and usefulness of the monitoring data. As more data are collected, the ability to detect changes
outside this natural range of variability will increase, which in turn will more clearly indicate the
status of the vital signs of water quality, nutrient enrichment, water quantity, and the detection of
invasive plant species.
22Literature Cited
Gawley, W. G., B. R. Mitchell, and E. A. Arsenault. 2014. Northeast Temperate Network lakes,
ponds, and streams monitoring protocol. 2014 Revision. Natural Resource Report
NPS/NETN/NRR—2014/XXX. National Park Service, Fort Collins, Colorado.
Kahl, S. 1999. Responses of Maine surface waters to the Clean Air Act Amendments of 1990. EPA
CX826563-01-0. Published Report-602094.
Lombard, P., W. Gawley, J. Caldwell. 2006. Freshwater Vital-Signs Monitoring Plan for National
Parks in the Northeast Temperate Network (NETN) PHASE III: Water-Quality Monitoring
Protocols in Lakes, Ponds and Streams. USGS, Augusta, Maine, 222 p.
Meybeck, M. 1982. Carbon, nitrogen, and phosphorus transport by world rivers. American Journal of
Science, Vol. 282, April 1982, p. 401-450.
New York State Department of Environmental Conservation. 2008. Surface water and groundwater
quality standards and groundwater effluent limitations. http://www.dec.ny.gov/regs/4590.html,
link checked on 13 December 2013.
Rantz, S.E., et al. 1982. Measurements and computation of streamflow, volumes 1 and 2: U.S.
Geological Survey Water-Supply Paper 2175: 631 p.
Stoddard, J., J. S. Kahl, F. Deviney, D. DeWalle, C. Driscoll, A. Herlihy, J. Kellogg, P. Murdoch, J.
Webb, and K. Webster. 2003. Response of surface-water chemistry to the Clean Air Act
Amendments of 1990. U.S. Environmental Protection Agency USEPA/620/R-03/001,
Washington, DC, 78 p.
Vana-Miller, D., C. Martin, L. White. 2001. Water resources management plan : Saratoga National
Historical Park, New York. National Park Service, Saratoga National Historical Park. New York.
Published Report-657177.
U.S. Environmental Protection Agency. 1997. Volunteer stream monitoring: a methods manual. EPA
841-B-97-003, November 1997.
U.S. Environmental Protection Agency. 1999. Guidance Manual for Compliance with the Interim
Enhanced Surface Water Treatment Rule: Turbidity Provisions.EPA 815-R-99-010, April 1999.
U.S. Environmental Protection Agency. 2000. Nutrient Criteria Technical Guidance Manual, Rivers
and Streams. First Edition. EPA-822-B00-002, July 2000.
U.S. Environmental Protection Agency. 2002. Ecoregional nutrient criteria. U.S. Environmental
Protection Agency Fact Sheet USEPA-822-F-02-008, October 2002.
Wetzel, R. G. 1983. Limnology: New York, Saunders Publishing Company.
23Appendix A. Saratoga National Historical Park (SARA) Water
Monitoring Data, 2013.
Table A1. YSI sonde in-situ stream water quality measurements collected at SARA.
Specific
Depth Temp DO
Site Date pH Conductance
(m) (C) (mg/L)
(µS/cm)
Kroma Kill (Stream A) 5/16/2013 0.21 15.15 10.27 8.43 406
Kroma Kill (Stream A) 6/11/2013 0.43 16.26 9.69 7.90 205
Kroma Kill (Stream A) 7/11/2013 0.42 23.44 8.61 8.14 309
Kroma Kill (Stream A) 8/15/2013 0.14 17.93 9.67 8.31 425
Kroma Kill (Stream A) 9/26/2013 0.38 13.84 10.35 8.33 459
Kroma Kill (Stream A) 10/24/2013 0.43 9.05 13.73 8.60 435
American's Creek (Stream B) 5/16/2013 0.07 14.67 9.28 8.09 532
American's Creek (Stream B) 6/11/2013 0.20 16.12 9.59 7.98 122
American's Creek (Stream B) 7/11/2013 0.35 22.77 8.46 8.06 339
American's Creek (Stream B) 8/15/2013 0.16 17.52 8.91 8.28 415
American's Creek (Stream B) 9/26/2013 0.28 13.21 9.41 8.17 274
American's Creek (Stream B) 10/24/2013 0.52 7.76 10.69 8.01 475
Upper Mill Creek (Stream C) 5/16/2013 0.08 14.22 9.56 7.84 446
Upper Mill Creek (Stream C) 6/11/2013 0.34 16.86 7.85 7.39 245
Upper Mill Creek (Stream C) 7/11/2013 0.46 23.10 7.58 7.59 361
Upper Mill Creek (Stream C) 8/15/2013 0.20 16.85 7.57 7.66 510
Upper Mill Creek (Stream C) 9/26/2013 0.20 13.45 9.08 7.77 496
Upper Mill Creek (Stream C) 10/24/2013 0.48 6.70 11.25 7.90 547
Mill Creek Confluence (Stream D) 5/16/2013 0.10 15.54 10.48 8.29 385
Mill Creek Confluence (Stream D) 6/11/2013 0.04 15.76 9.62 7.87 164
Mill Creek Confluence (Stream D) 7/11/2013 0.44 21.46 8.94 8.05 285
Mill Creek Confluence (Stream D) 8/15/2013 0.11 16.58 10.09 8.06 365
Mill Creek Confluence (Stream D) 9/26/2013 0.33 13.07 10.92 8.11 373
Mill Creek Confluence (Stream D) 10/24/2013 0.44 8.74 13.76 8.40 385
23Appendix A. Saratoga National Historical Park (SARA) Water Monitoring Data, 2013 (continued).
Table A2. Laboratory nutrient chemistry data for SARA. “Appendix A. Saratoga National Historical Park (SARA) Water Monitoring Data, 2013
(continued).
Table A3. Stream stage and discharge data for SARA. Missing values indicate data are unavailable.
Distance Total Average
Datum from CS area velocity Discharge
Site Date name datum (ft) (sqft) (f/s) (cfs)
Kroma Kill (Stream A) 5/16/2013 Bolt1 -0.48 8.88 0.23 2.04
Kroma Kill (Stream A) 5/16/2013 Bolt2 -0.68 8.88 0.23 2.04
Kroma Kill (Stream A) 6/11/2013 Bolt3 -0.30
Kroma Kill (Stream A) 6/11/2013 Bolt3 -0.30
Kroma Kill (Stream A) 7/11/2013 Bolt1 -0.18 9.81 0.72 7.06
Kroma Kill (Stream A) 7/11/2013 Bolt2 -0.22 9.81 0.72 7.06
Kroma Kill (Stream A) 8/15/2013 Bolt1 -0.54 8.49 0.21 1.78
Kroma Kill (Stream A) 8/15/2013 Bolt2 -0.60 8.49 0.21 1.78
Kroma Kill (Stream A) 8/15/2013 SG1 0.30 8.49 0.21 1.78
Kroma Kill (Stream A) 9/26/2013 SG1 0.28 7.54 0.16 1.23
Kroma Kill (Stream A) 9/26/2013 Bolt1 -0.60 7.54 0.16 1.23
Kroma Kill (Stream A) 9/26/2013 Bolt2 -0.70 7.54 0.16 1.23
Kroma Kill (Stream A) 9/26/2013 SG1 0.28 7.54 0.16 1.23
Kroma Kill (Stream A) 10/24/2013 Bolt1 -0.72 1.87 1.11 2.08
Kroma Kill (Stream A) 10/24/2013 Bolt2 -2.22 1.87 1.11 2.08
Kroma Kill (Stream A) 10/24/2013 SG1 0.32 1.87 1.11 2.08
Upper Mill Creek (Stream C) 5/16/2013 Bolt1 -0.23 2.56 0.04 0.11
Upper Mill Creek (Stream C) 6/11/2013 Bolt1 0.64 4.56 2.69 12.25
Upper Mill Creek (Stream C) 7/11/2013 Bolt1 0.02 1.25 1.59 1.98
Upper Mill Creek (Stream C) 7/11/2013 SG1 1.00 1.25 1.59 1.98
Upper Mill Creek (Stream C) 8/15/2013 Bolt1 -0.36
Upper Mill Creek (Stream C) 8/15/2013 SG1 0.62
Upper Mill Creek (Stream C) 9/26/2013 SG1 0.62 1.32 0.03 0.04
Upper Mill Creek (Stream C) 10/24/2013 Bolt1 -0.32 2.02 0.05 0.10
Upper Mill Creek (Stream C) 10/24/2013 SG1 0.66 2.02 0.05 0.10
Mill Creek Confluence (Stream D) 5/16/2013 Bolt1 0.06 2.48 0.19 0.46
Mill Creek Confluence (Stream D) 6/11/2013 Bolt2 -0.18 20.71 2.62 54.20
Mill Creek Confluence (Stream D) 7/11/2013 Bolt1 0.32 7.39 0.80 5.91
Mill Creek Confluence (Stream D) 7/11/2013 Bolt1 0.30 7.39 0.80 5.91
Mill Creek Confluence (Stream D) 7/11/2013 Bolt2 -0.44 7.39 0.80 5.91
Mill Creek Confluence (Stream D) 8/15/2013 Bolt1 0.00 1.40 0.22 0.31
Mill Creek Confluence (Stream D) 9/26/2013 Bolt1 0.01 1.54 0.14 0.22
Mill Creek Confluence (Stream D) 9/26/2013 Bolt2 -0.78 1.54 0.14 0.22
Mill Creek Confluence (Stream D) 10/24/2013 Bolt2 -0.72 1.63 0.21 0.35
25Appendix B. Saratoga National Historical Park (SARA) Blank and Replicate Water Samples, 2013.
Table B1. 2013 Blank sample analysis results (Lower NETN).
A
ANC DOC Chla Cl SO4 TP NO3 NH3
Color TN (mg/L) NO2 (mg/L)
(µeq/L) (mg/L) (µg/L) (µeq/L) (µeq/L) (µg/L) (µeq/L) (mg/L)
Site Date (PCU)
MABIPA 6/4/2013 -0.1 0Appendix B. Saratoga National Historical Park (SARA) Blank and Replicate Water Samples, 2013 (continued).
Table B2. Replicate sample analysis results and measurement quality analysis (Lower NETN).
Color Color Diff DOC DOC Diff ANC ANC Diff Chla Chla Diff
Site Date Reg Rep (PCU) % Diff Reg Rep (mg/L) % Diff Reg Rep (µeq/L) % Diff Reg Rep (µg/L) % Diff
SAIRSB 5/23/2013 94 93 1 1.1% 5.88 5.16 0.72 12.24% 1,130 1,300 -170 15.0% n/a n/a
SAGAPA 6/6/2013 40 44 -4 10.0% 2.26 2.26 0.00 0.00% 715 718 -3 0.4% < MRL < MRL
SAGAPA 8/8/2013 44 47 -3 6.8% 1.82 1.89 -0.07 3.85% 1,110 1,110 0 0.0% 2.4 2.4 0.0 0.0%
ROVASD 8/21/2013 26 28 -2 7.7% 2.75 2.79 -0.04 1.45% 2,290 2,290 0 0.0% n/a n/a
TP TP Diff TN TN Diff NO3 NO3 Diff NO2 NO2 Diff
Site Date Reg Rep (µg/L) % Diff Reg Rep (mg/L) % Diff Reg Rep (µeq/L) % Diff Reg Rep (mg/L) % Diff
SAIRSB 5/23/2013 56 74 -18 32.1% 1.41 1.36 0.05 3.5% 44.0 44.0 0.0 0.0% 0.043 0.042 0.001 2.3%
SAGAPA 6/6/2013 21 22 -1 4.8% 0.31 0.31 -0.01 2.0% 9.8 9.8 0.0 0.0% < MRL < MRL
SAGAPA 8/8/2013 15 16 -1 6.7% 0.30 0.30 0.00 0.3% 11.0 11.0 0.0 0.0% < MRL < MRL
ROVASD 8/21/2013 28 29 -1 3.6% 0.75 0.76 -0.01 1.6% 41.0 41.0 0.0 0.0% < MRL < MRL
NH3 NH3 Diff SO4 SO4 Diff Cl Cl Diff
Site Date Reg Rep (mg/L) % Diff Reg Rep (µeq/L) % Diff Reg Rep (µeq/L) % Diff
SAIRSB 5/23/2013 0.17 0.24 -0.07 41.2% 408 2,421 -2,013 493.4% 6,083 27,280 -21,197 348.5%
SAGAPA 6/6/2013 < MRL < MRL 125 125 0 0.0% 294 292 2 0.7%
27
SAGAPA 8/8/2013 < MRL < MRL 117 117 0 0.0% 440 441 -1 0.2%
ROVASD 8/21/2013 < MRL < MRL 243 246 -3 1.2% 1,214 1,203 11 0.9%The Department of the Interior protects and manages the nation’s natural resources and cultural heritage; provides scientific and other information about those resources; and honors its special responsibilities to American Indians, Alaska Natives, and affiliated Island Communities. NPS 374/124616 May 2014
National Park Service
 U.S. Department of the Interior

Natural Resource Stewardship and Science
1201 Oakridge Drive, Suite 150
Fort Collins, CO 80525

www.nature.nps.gov

                                   TM
 EXPERIENCE YOUR AMERICA
You can also read