Precipitation at Dumont d'Urville, Adélie Land, East Antarctica: the APRES3 field campaigns dataset
←
→
Page content transcription
If your browser does not render page correctly, please read the page content below
Earth Syst. Sci. Data, 10, 1605–1612, 2018
https://doi.org/10.5194/essd-10-1605-2018
© Author(s) 2018. This work is distributed under
the Creative Commons Attribution 4.0 License.

             Precipitation at Dumont d’Urville, Adélie Land, East
              Antarctica: the APRES3 field campaigns dataset
       Christophe Genthon1 , Alexis Berne2 , Jacopo Grazioli3 , Claudio Durán Alarcón1 , Christophe Praz2 , and
                                                 Brice Boudevillain1
                      1 Univ.Grenoble Alpes, CNRS, IRD, Grenoble INP, IGE, 38000 Grenoble, France
          2 Environmental  Remote Sensing Laboratory, Environmental Engineering Institute, School of Architecture,
       Civil and Environmental Engineering, École Polytechnique Fédérale de Lausanne, 1015 Lausanne, Switzerland
                 3 Federal Office of Meteorology and Climatology, MeteoSwiss, Locarno-Monti, Switzerland

                             Correspondence: Christophe Genthon (christophe.genthon@cnrs.fr)

                                      Received: 12 March 2018 – Discussion started: 26 April 2018
                            Revised: 23 July 2018 – Accepted: 6 August 2018 – Published: 6 September 2018

       Abstract. Compared to the other continents and lands, Antarctica suffers from a severe shortage of in situ obser-
       vations of precipitation. APRES3 (Antarctic Precipitation, Remote Sensing from Surface and Space) is a program
       dedicated to improving the observation of Antarctic precipitation, both from the surface and from space, to assess
       climatologies and evaluate and ameliorate meteorological and climate models. A field measurement campaign
       was deployed at Dumont d’Urville station at the coast of Adélie Land in Antarctica, with an intensive observa-
       tion period from November 2015 to February 2016 using X-band and K-band radars, a snow gauge, snowflake
       cameras and a disdrometer, followed by continuous radar monitoring through 2016 and beyond. Among other
       results, the observations show that a significant fraction of precipitation sublimates in a dry surface katabatic
       layer before it reaches and accumulates at the surface, a result derived from profiling radar measurements. While
       the bulk of the data analyses and scientific results are published in specialized journals, this paper provides a
       compact description of the dataset now archived in the PANGAEA data repository (https://www.pangaea.de,
       https://doi.org/10.1594/PANGAEA.883562) and made open to the scientific community to further its exploita-
       tion for Antarctic meteorology and climate research purposes.

1   Introduction                                                     tion from in situ observations are left blank only over Antarc-
                                                                     tica. Satellites offer rising prospects to monitor remote, dif-
The Antarctic ice sheet is a huge continental storage of wa-         ficult and/or uninhabited regions, but even then Antarctica
ter which, if altered through climate change, has the potential      tends to be excluded from comprehensive and/or global stud-
to significantly affect global sea level. While climate models       ies (e.g. Funk et al., 2015). Only those studies that specif-
consistently predict an increase in precipitation in the future      ically focus on the polar regions and Antarctica have pre-
in Antarctica (e.g. Palerme et al., 2016), most of which falls       sented and discussed aspects of the Antarctic precipitation
in the form of snow that will not melt and thus will accu-           by satellite (Palerme et al., 2014, 2016, 2017; Behrangi et al.,
mulate further ice, observational data to raise confidence in        2016). However, ground-based observations are still lacking
the current precipitation in the models are still in demand.         to suitably calibrate and validate the satellite products.
Antarctica is the poor cousin of global continental precip-             The measurement of solid precipitation is notoriously dif-
itation observation and climatology building efforts: citing         ficult (Goodison et al., 1998; Nilu, 2013). Difficulties are ex-
Schneider et al. (2014) of the Global Precipitation Climatol-        acerbated in Antarctica because access and operations are lo-
ogy Center (GPCC), “The GPCC refrains from providing a               gistically difficult and environmental conditions are extreme.
(precipitation) analysis over Antarctica” because of poor data       Antarctica is the driest continent on Earth in terms of pre-
coverage. The GPCC’s global maps of continental precipita-

Published by Copernicus Publications.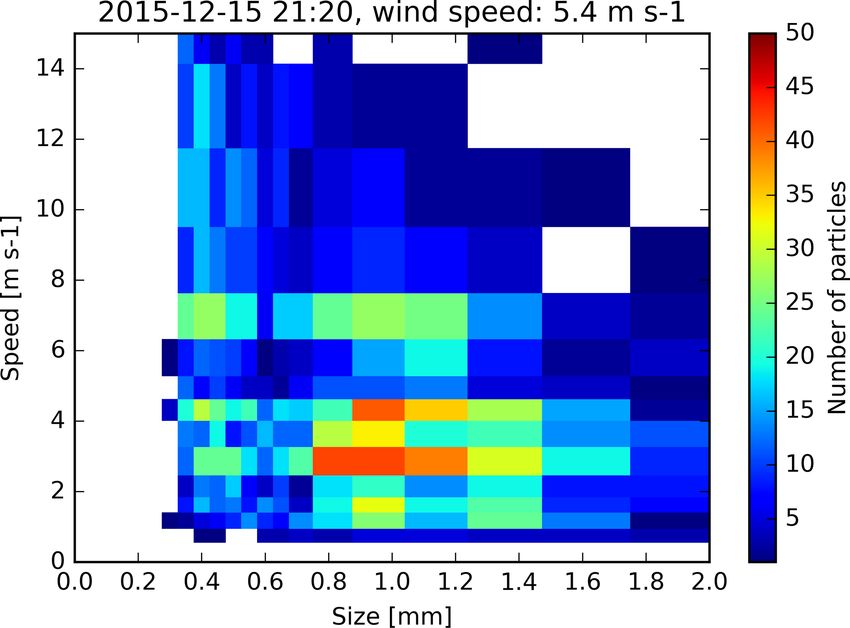
1606                                                                        C. Genthon et al.: APRES3 field campaigns dataset

cipitation: satellite data estimate the mean precipitation at       fr, last access: 1 August 2018), starting in November 2015
171 mm yr−1 of water equivalent north of 81◦ S, the latitude        until February 2016 for the intense observing period but still
reached by the polar orbiting satellites (Palerme et al., 2014).    ongoing for some observations, an unprecedentedly compre-
Low precipitation is supported by net accumulation mea-             hensive field campaign was launched at the French Dumont
surements at the surface using glaciological methods (Eisen         d’Urville Antarctic scientific station at the coast of Adélie
et al., 2007) which yield equally low numbers (Arthern et           Land. The objective was to measure and monitor precipita-
al., 2006). On the high Antarctic plateau, the accumulation         tion not only in terms of quantity, but also of falling snow par-
is only a few cm yr−1 annually (e.g. Genthon et al., 2015).         ticle characteristics and microphysics. The range of instru-
Such a low precipitation rate would be very hard to moni-           ments included a profiling K-band and a polarimetric scan-
tor even in more hospitable environments. It is not possible        ning X-band radar, a multi-angle snowflake camera (MASC),
with conventional instruments in Antarctica. Satellite data         an OTT Pluvio2 weighing gauge, and a Biral VPF-730 dis-
and glaciological reconstructions, as well as models and me-        drometer. A weather station reporting temperature, moisture
teorological analyses, support a dry interior but indicate that     and wind conditions near the instruments was also deployed.
precipitation is much larger at the peripheries of the Antarc-      Finally, a depolarization lidar was tentatively operated but
tic ice sheet, yearly reaching several tens of centimetres, or      had problems and is not further mentioned here. All instru-
even metres, locally (Palerme et al. 2014). However, strong         ments were removed at the end of January 2016 except the
katabatic winds frequently blow at the peripheries, which           K-band radar, which remained in operation throughout 2016
adversely affect the conventional precipitation measurement         and beyond. Grazioli et al. (2017a) provide a comprehen-
methods. Collecting instruments (bucket-style instruments           sive description of the data and analysis techniques and dis-
that capture and collect to measure snowfall, typically by          cuss scientific outcomes. Further work is ongoing to address
weighing or tipping bucket counts) actually undercatch or           the calibration and validation of meteorological and climate
overcatch because of air deflection and turbulence caused by        models and of satellite remote sensing techniques with the
the instruments themselves. In addition, they catch not only        data (snowfall occurrences and rates, but also vertical pro-
fresh falling snow, but also drifting/blowing snow which was        files). Meanwhile, because this is a unique dataset, dissem-
previously deposited at the surface, and then eroded and re-        ination to the wider community for similar use with other
mobilized by the strong winds. Non-catching instruments, in-        models and remote sensing processing approaches or other
cluding in situ (disdrometer) and remote (radar, lidar) sens-       research purposes is considered timely. This paper provides
ing instruments, offer interesting prospects. Radars are par-       a compact description of the dataset and dissemination.
ticularly attractive because they can profile through the air
layers. They can sense both horizontally to expand the spa-         2     Dataset description
tial significance of the measurement and vertically to scan
the origin and fate of precipitation since condensation in the      Grazioli et al. (2017a) provide ample information on the ob-
atmospheric column, from the clouds (see Witze, 2016, for           servation site, most instruments and methods. A summary
an application in Antarctica) and above to the surface, and         and complementary information are provided below.
separate blowing snow in the lower layers from precipitation
higher up.                                                          2.1    Site description
   However, while radars are customarily used in other re-
gions to monitor liquid precipitation (e.g. Krajewski and           The main APRES3 (austral) summer field campaign took
Smith, 2002; Fabry, 2015), and many campaigns have also             place at French Antarctic scientific station Dumont d’Urville
been conducted in high-latitude and high-altitude regions           (DDU) in Adélie Land (66.6628◦ S, 140.0014◦ E; 41 m a.s.l.
to study snowfall (e.g. Schneebeli et al., 2013; Grazioli et        on average). The station is on Petrel Island located only
al., 2015; Medina and Houze, 2015; Moisseev et al., 2015;           ∼ 5 km off the continent and the ice sheet proper: the ob-
Kneifel et al., 2015), experience is still limited in the Antarc-   servations are thus representative of the very coast of the
tic environment (Gorodetskaya et al., 2015). Because such           Antarctic ice sheet. Because the station was operated for
instruments do not collect and directly measure the mass of         more than 60 years uninterruptedly, the means and statistics
falling precipitation, but rather measure the fraction of an        of meteorology and climate are documented (König-Langlo
emitted radiation which is reflected back by the hydrome-           et al., 1998; Grazioli et al., 2017a). A main meteorological
teors, quantification in terms of precipitation involves both       feature is the strong katabatic winds that frequently blow
physically based (electromagnetic laws of diffusion, diffrac-       in the area. Adélie Land was coined “the home of the bliz-
tion and propagation) and hypothesis-based (particle popula-        zard” by Mawson (1915) after the first Australian Antarctic
tion size and shape, habits) post-processing. The hypothesis-       winter over in this region. However, much of the coasts of
based part requires calibration and validation using various        Antarctica are affected by the katabatic winds (Parish and
sources of in situ measurements (e.g. Souverijns et al., 2017).     Bromwich, 1987). DDU is a perfect place to sample their
   As part of the APRES3 project (Antarctic Precipitation,          consequences, including in relation to precipitation.
Remote Sensing from Surface and Space, http://apres3.osug.

Earth Syst. Sci. Data, 10, 1605–1612, 2018                                          www.earth-syst-sci-data.net/10/1605/2018/
C. Genthon et al.: APRES3 field campaigns dataset                                                                            1607

2.2     Observations and instruments                               shipped back after completion in February 2016, the K-band
                                                                   radar sheltered by a radome could remain on site after the
Standard measurements of atmospheric variables (tempera-           summer campaign. The radome significantly attenuates the
ture, wind speed, wind direction, relative and specific hu-        signal (6.14 dB, Fig. 4 and Eq. 1 of Grazioli et al., 2017a),
midity, atmospheric pressure) are collected regularly all year     but it is necessary to protect the radar against the fierce win-
long by the French meteorological service (Météo France),          ter winds in Adélie Land.
and a radiosounding is made daily at 00:00 UTC. The rou-
tine program does not involve any instrumental measure-
ment of precipitation. There are reports of visual estimation      2.2.2   Disdrometer and MASC
of the occurrence and type in the METAR (METeorologi-              The Biral VPF 730 disdrometer is also a non-capture instru-
cal Airport Report) convention, but no quantification. For the     ment, which estimates the size and speed of airborne parti-
APRES3 campaign, several instruments were deployed from            cles from the diffusion and diffraction of an infrared light
the beginning of November 2015 to the end of January 2016          beam within a 400 cm3 air volume. The volumetric sam-
to objectively characterize and quantify the occurrences and       pling of the VPF730 presents an advantage over 2-D sam-
amounts of precipitation, as described below.                      pling instruments, which is that it does not miss particles
                                                                   with a much larger horizontal (due to strong wind) than verti-
2.2.1    Surface-based remote sensing instruments                  cal (falling) speed. The downside is that the instrument does
                                                                   not straightforwardly distinguish between falling and blow-
As reported in the introduction, traditional collecting precip-    ing snow (Bellot et al., 2011). A Biral proprietary algorithm
itation gauges are unreliable in Antarctica in general, and in     directly provides precipitation rates from the size–speed ma-
particular in the coastal regions strongly affected by kata-       trix. Because this is based on various assumptions, includ-
batic winds. Radars are the core instruments of the APRES3         ing on the phase, shape and density of the particles, particu-
campaign. Radars remotely sense the hydrometeors, estimate         larly unwarranted in the atypical Antarctic environment, the
quantities and speed, and from this derive precipitation rates.    database described here presents the matrices rather than the
Radars can scan and profile through atmospheric and hy-            estimated precipitation.
drometeor layers and look beyond blowing snow near the                A MASC was deployed next to the disdrometer. This in-
surface. Two radars were deployed: a K-band frequency-             strument collects high-resolution stereoscopic photographs
modulated continuous-wave vertically staring profiler and          of snowflakes in free fall while they cross the sampling area
an X-band pulsed dual-polarization scanning Doppler radar.         (Garrett et al., 2012), thus providing information about snow-
The first instrument, a Metek micro-rain radar (MRR), is           fall microphysics and particle fall velocity. The MASC uses
designed to measure rainfall rather than snowfall using the        three identical 2448 × 2048 pixels cameras (with a common
backscattering and vertical velocity information. However,         focal point) with apertures and exposure times adjusted to
the raw Doppler spectra can be reprocessed using Maahn and         trade off between the contrast on snowflake photographs and
Kollias (2012)’s improved and innovative processing chain          motion blur effects. The resolution is about 33 µm per pixel.
for data collected in snow to retrieve Doppler radar moments       The cameras are triggered when a falling particle crosses
such as reflectivity Z and Doppler velocity. Most Z–S re-          two series of near-infrared sensors. A detailed description
lations for radars have been derived for 10, 35 or 94 GHz          of the system and its calibration can be found in Garrett et
and therefore the measured equivalent radar reflectivity at        al. (2012). Information from disdrometers (Souverijns et al.,
24 GHz is first converted to X-band. Once mapped to X-             2017) and more particularly from MASC images, after im-
band reflectivity this can be converted to snowfall rate S by      age processing, provides characterizations and classification
means of a Z–S power law fitted to the local conditions using      of snow particles (Praz et al., 2017) that can be used to better
the weighing gauge information or parameterizations from           process radar data.
the existing literature (for more details, see Grazioli et al.,
2017a). The MRR was used with a 100 m vertical resolution.         2.2.3   Precipitation gauge, meteorology, and setting of
The second instrument, a mobile X-band polarimetric radar                  the instruments
(MXPol), for which extensive experience with the measure-
ment of snow is available (Schneebeli et al., 2013; Scipión et     What fraction of snowfall a traditional precipitation gauge
al., 2013; Grazioli et al., 2015), provided more detailed infor-   captures is unwarranted. On the other hand, unlike remote
mation and served as a control and reference for the calibra-      sensing instruments, the mass quantification of any cap-
tion of the method to use the MRR data. It was used with a         tured snow is direct and straightforward. An OTT Pluvio2
75 m radial resolution, maximum radial distance 30 km, and         precipitation gauge was deployed for the duration of the
different types of scans within a repeating scanning sequence      summer campaign. Snow falling in the instrument is defi-
of 5 min (plan position indicator (PPI), range height indica-      nitely captured and weighted. The instrument used here was
tor (RHI), vertical profiles). While the X-band radar could        equipped with a manufacturer-design wind shield meant to
only be deployed during the summer campaign and had to be          limit wind impacts on capture efficiency. Further, the instru-

www.earth-syst-sci-data.net/10/1605/2018/                                         Earth Syst. Sci. Data, 10, 1605–1612, 2018
1608 C. Genthon et al.: APRES3 field campaigns dataset
Table 1. Summary of data from the APRES3 observation campaigns available by download from the PANGAEA repository (Berne et al.,
2017) or by request to the authors. MASC data are provided for each picture taken, the taking of which varies with the occurrence of particle
detection.
Instrument Variables Format/source Time period Sampling
Time Space
Weather station Temperature, moisture, wind ASCII + NetCDF/PANGAEA 21 Nov 2015–6 Feb 2016 30 s local
K-band MRR radar Precipitation profiles (28 levels) NetCDF/PANGAEA 21 Nov 2015–11 Nov 2016 1h Vertical:
100 m
Pluvio2 weighing gauge Surface precipitation ASCII + NetCDF/PANGAEA 17 Nov 2015–21 Jan 2016 1 min local
Biral VPF730 disdrometer Size/speed matrices ASCII + NetCDF/PANGAEA 2 Dec 2015–23 Feb 2016 10 min local
MASC Snow particle classification and ASCII + NetCDF/PANGAEA 11 Nov 2015–21 Jan 2016 Variable local
microphysics
X-band MXPol radar Polarimetric radar variables Request to authors 21 Nov 2015 to 1 Feb 2016 5 min 3-D,
and hydrometeor types radial: 75 m
3 Data, samples and conclusions
Table 1 summarizes the data streams from the APRES3 mea-
surement campaign. Grazioli et al. (2017a) extensively pro-
cess and discuss the data from the different instruments. Fur-
ther analyses and presentation are beyond the scope of this
data paper, and only a few snapshots are provided to illus-
trate the content of the database. Figure 2 shows the cumula-
tive precipitation during the intensive summer campaign, as
yielded by the Pluvio2 snow gauge and the processed MRR
at the lowest useful level and at 741 m above sea level. Only
28 out of 31 MRR levels are provided in the database. This
is because several simplifications necessary for a tractable
quantitative interpretation of radar signal power do not apply
in the two lowest levels. Data processing is based on assump-
tions that are not valid as it may lead to overestimation of re-
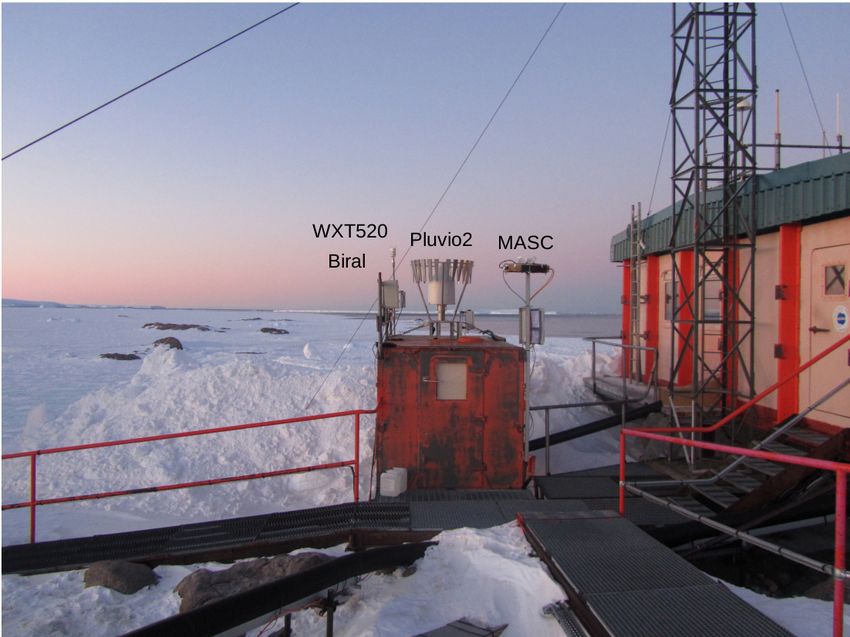
Figure 1. Setting of the in situ sensors (weather station WXT520,
disdrometer Biral, snow gauge Pluvio 2 and MASC) on the roof of flectivity (Peters et al., 2005). In the uppermost level, the data
a small shelter close to other buildings. become noisy, as according to Kneifel et al. (2011), the de-
tectability is highest close to the ground, at −2 dBz (35 GHz
equivalent) at 500 m, but decreases with height to 3 dBz at
ment was relatively shielded from the strongest wind due 3000 m. Precipitation rates were retrieved from MRR data
to its location, on the roof of a container but on the side following Grazioli et al. (2017a): the reflectivity was con-
of a building. The MASC and disdrometer were deployed verted into liquid water equivalent rate by fitting the prefactor
at the same partially sheltered site (Fig. 1), the local meteo- and exponent of a Z–S relationship using carefully filtered
rology of which was sampled locally by a Vaisala WXT520 nearby Pluvio2 data. Censoring the Pluvio2 data for wind-
weather transmitter, the principles, instrumental accuracy induced biases such as vibrations and turbulence effects by
and performance of which can be found in the manufac- cross-referencing with the MRR data removes up to 30 % of
turer’s User’s Guide (https://www.vaisala.com/sites/default/ the quantities (Grazioli et al., 2017a), as visible by the accu-
files/documents/M210906EN-C.pdf, last access: 1 August mulation of the Pluvio2 in the time periods between snowfall
2018). Note that this station integrates an acoustic rain gauge events. As the Pluvio2 is a standard instrument but there is
not appropriate for measuring snowfall; thus, the deployment no standard correction method for wind effects, others might
of the Pluvio2. The radars were closely located, within at want to test other approaches, and the primary rather than the
most 200 m of the other instruments. A composite picture of censored data are shown here and distributed in the database.
the various instruments and instrument settings is provided The MRR precipitation at the lowest useful level
by Fig. 2 of Grazioli et al. (2017a). (341 m a.s.l.) is significantly less than that at 741 m a.s.l.,
showing that a significant fraction of the precipitation formed
above sublimates in the dry katabatic air layer near the sur-
Earth Syst. Sci. Data, 10, 1605–1612, 2018 www.earth-syst-sci-data.net/10/1605/2018/C. Genthon et al.: APRES3 field campaigns dataset 1609
Figure 2. Cumulative precipitation during the APRES3 summer campaign, from the Pluvio2 and MRR instruments. Thin black vertical lines
bracket the largest precipitation event in the period, from 12 to 17 December 2015. Precipitation from the MRR is reported for two levels
above sea level, 341 and 741 m.
together, the 2015–2016 summer was relatively dry and few
strong precipitation events occurred. One such event hap-
pened from 12 to 17 December 2015 (delineated by thin ver-
tical black lines in Fig. 2), during which the largest part of
the total cumulative precipitation this summer was recorded.
Figure 3 shows an example of the Biral disdrometer size–
speed matrix during this event. The local wind was relatively
strong (5.4 m s−1 averaged on the same 10 min as the matrix
Fig. 3, with significant gusts in the period). Considering that
the anemometer is set at a relatively sheltered place and thus
underestimates the large-scale wind, a contribution of blow-
ing snow to the disdrometer report is likely. However, a sig-
nificant fraction of the density number of particles detected
is associated with moderate speed below 4 m s−1 . Large par-
ticles (0.8–1.2 mm) are detected, the fall speed of which may
indeed be over 1 m s−1 , as reported by the instrument.
Figure 3. An example of the 21 × 16 fixed-level size–speed matrix
Figure 4 shows the probability distribution function of the
of particle density distribution from the Biral disdrometer during
the large precipitation event shown in Fig. 2. The date and time degree of riming of the snowfall particles as obtained by pro-
(15 December, 21:20 local time) and local wind speed (5.4 m s−1 ) cessing the MASC photographs. No less than 426 229 pho-
are printed at the top of the graph. tographs of falling snow particles were collected during the
season. Each picture is processed as described in Praz et
al. (2017). The database offers the processed results in the
form of a classification, rather than the photographs them-
face. Further observations show that this frequently occurs in selves. Figure 4 cumulates all single estimates of the degree
all seasons of the year (see below). Meteorological and cli- of riming in the database. The degree of riming is defined in
mate models suggest that at the full scale of the Antarctic this context as a continuous index between 0 (no riming on
ice sheet up to 17 % of the precipitation evaporates in a dry the particle detected) and 1 (fully rimed, graupel-like parti-
surface layer before reaching the ground, and thus does not cle). Almost half of the particles are close to fully rimed, in-
contribute to feeding the ice sheet (Grazioli et al., 2017b). Al-
www.earth-syst-sci-data.net/10/1605/2018/ Earth Syst. Sci. Data, 10, 1605–1612, 20181610 C. Genthon et al.: APRES3 field campaigns dataset Figure 4. PDF of snow particle riming from the MASC data over the observation period. Figure 5. One year (November 2015–November 2016) of cumulative precipitation from MRR backscattering at 341 and 741 m above the surface. dicating that cloud liquid water is very frequent in summer. of the precipitation formed in the atmosphere sublimates be- Finally, Fig. 5 shows precipitation from the MRR dataset fore reaching the surface. over the full record in the database, for more than a year from 21 November 2015 to 11 December 2016. Again, re- ports from two elevations, 341 and 741 m a.s.l., are displayed. This shows that at DDU, cumulated over a full year, ∼ 25 % Earth Syst. Sci. Data, 10, 1605–1612, 2018 www.earth-syst-sci-data.net/10/1605/2018/
C. Genthon et al.: APRES3 field campaigns dataset                                                                               1611

4   Data availability                                             Competing interests. The authors declare that they have no con-
                                                                  flict of interest.
The      APRES3        field  campaign    database   is
available      in    open    access   on      PANGAEA,
https://doi.org/10.1594/PANGAEA.883562       (Berne  et           Acknowledgements. We thank the French Polar Institute, which
al., 2017). MXPol data are too big to download from               logistically supports the APRES3 measurement campaigns. We
PANGAEA and are available on request to the authors.              particularly acknowledge the support of the French National
                                                                  Research Agency (ANR) to the APRES3 project. The Expecting
                                                                  Earth-Care, Learning from the ATrain (EECLAT) project funded
5   Conclusions                                                   by the Centre National d’Etudes Spatiales (CNES) also contributed
                                                                  support to this work. The Swiss National Science foundation (SNF)
In conclusion, observations at DDU carried out as part of         is acknowledged for grant 200021_163287, financing the Swiss
the APRS3 project provide an unprecedented dataset of pre-        participation in the project. PANGAEA is gratefully acknowledged
cipitation at the coast of Antarctica, complementing exist-       for hosting and distributing the APRES3 data. Steve Colwell, of the
ing documentation efforts (Gorodetskaya et al., 2015) in          British Antarctic Survey, and two anonymous reviewers provided
a region which otherwise suffers from a severe shortage           thoughtful comments and suggestions that helped correct and
of such data. Our analysis of the data yields new insights        clarify a number of issues in the preliminary manuscript.
into the characteristics and particularities of Antarctic snow-
fall, in particular that a large fraction of the precipitation    Edited by: David Carlson
                                                                  Reviewed by: Steve Colwell and two anonymous referees
formed in the atmosphere sublimates before reaching the sur-
face. This information could only be obtained with instru-
ments that can profile through the atmospheric layers, like
radars here. However, the dataset goes beyond radar data
and provides extensive complementary characterization of          References
snow particle geometry and cumulative quantities of snow-
fall at the surface. Except for the dataset from the MXPol        Arthern, R. J., Winebrenner, D. P., and Vaughan, D. G.: Antarctic
dual-polarization scanning radar during the summer cam-              snow accumulation mapped using polarization of 4.3-cm wave-
                                                                     length microwave emission, J. Geophys. Res., 111, D06107,
paign, the size of which (about 4 TB) is too large to be
                                                                     https://doi.org/10.1029/2004JD005667, 2006.
shared online but can be obtained by direct request to the        Behrangi, A., Christensen, M., Richardson, M., Lebsock, M.,
authors, all data are now distributed (Berne et al., 2017)           Stephens, G., Huffman, G. J., Bolvin, D., Adler, R. F., Gard-
and can be freely accessed from the PANGAEA repos-                   ner, A., Lambrigtsen, B., and Fetzer, E.: Status of high-latitude
itory (https://doi.org/10.1594/PANGAEA.883562). Table 1              precipitation estimates from observations and reanalyses. J. Geo-
provides a summary of the the variables and periods cov-             phys. Res.-Atmos. 121, 4468–4486, 2016.
ered and distributed online for each instrument. At the time      Bellot, H., Trouvilliez, A., Naaim-Bouvet, F., Genthon, C., and
of writing this paper, the project carries on with continu-          Gallée, H.: Present weather sensors tests for measuring drifting
ous collection of precipitation profiles with the MRR, and a         snow, Ann. Glaciol., 52, 176–184, 2011.
planned contribution to the Year Of Polar Prediction (YOPP,       Berne, A., Grazioli, J., and Genthon, C.: Precipita-
http://www.polarprediction.net/, last access: 1 August 2018)         tion observations at the Dumont d’Urville Station,
                                                                     Adélie Land, East Antarctica, PANGAEA, 5 datasets,
international austral special coordinated observation period
                                                                     https://doi.org/10.1594/PANGAEA.883562, 2017.
from November 2018 to February 2019, the data from which          Eisen O., Frezzotti, M., Genthon, C., Isaksson, E., Magand, O.,
will also be made available to the community. Because of a           van den Broeke, M. R., Dixon, D. A., Ekaykin, A., Holm-
significant weather service’s (Météo France) involvement in-         lund, P., Kameda, T., Karlöf, L., Kaspari, S., Lipenkov, V.
cluding additional radiosoundings, in addition to the planned        Y., Oerter, H., Takahashi, S., and Vaughan, G.: Snow ac-
APRES3 contribution, DDU is identified as one of the YOPP            cumulation in East Antarctica, Rev. Geophys. 46, RG2001,
observation hotspots for the southern special observing pe-          https://doi.org/10.1029/2006RG000218., 2007.
riod.                                                             Fabry, F.: Radar meteorology: principles and practice, Cambridge
                                                                     University Press, 2015.
                                                                  Funk, C., Verdin, A., Michaelsen, J., Peterson, P., Pedreros, D., and
Author contributions. CG, AB and JG organized and ran the            Husak, G.: A global satellite-assisted precipitation climatology,
field campaigns. JG, AB, CDA and BB developed radar data pro-        Earth Syst. Sci. Data, 7, 275–287, https://doi.org/10.5194/essd-
cessing methods and produced data series. CG processed Biral         7-275-2015, 2015.
disdrometer data and CP processed MASC data. All authors con-     Garrett, T. J., Fallgatter, C., Shkurko, K., and Howlett, D.: Fall
tributed data analysis, discussion and conclusions.                  speed measurement and high-resolution multi-angle photogra-
                                                                     phy of hydrometeors in free fall, Atmos. Meas. Tech., 5, 2625–
                                                                     2633, https://doi.org/10.5194/amt-5-2625-2012, 2012.
                                                                  Genthon, C., Six, D., Scarchilli, C., Giardini, V., and Frezzotti,
                                                                     M.: Meteorological and snow accumulation gradients across

www.earth-syst-sci-data.net/10/1605/2018/                                              Earth Syst. Sci. Data, 10, 1605–1612, 2018
1612 C. Genthon et al.: APRES3 field campaigns dataset dome C, east Antarctic plateau, Int. J. Clim., 36, 455-466, Moisseev, D. N., Lautaportti, S., Tyynela, J., and Lim, S.: Dual- https://doi.org/10.1002/joc.4362, 2015. polarization radar signatures in snowstorms: Role of snowflake Goodison B. E., Louie, P. Y. T., and Yang, D.: Solid precipitation aggregation, J. Geophys. Res.-Atmos., 120, 12644–12655, 2015. measurement intercomparison, WMO/TD – No. 872, WMO, In- Nilu, R.: Cold as SPICE, Meteorol. Tech. Int., April 2013, 148–150, strument and Observing Methods report No. 67, WMO, Geneva, 2013. 1998. Palerme, C., Kay, J. E., Genthon, C., L’Ecuyer, T., Wood, N. B., and Gorodetskaya, I. V., Kneifel, S., Maahn, M., Van Tricht, K., Thiery, Claud, C.: How much snow falls on the Antarctic ice sheet?, The W., Schween, J. H., Mangold, A., Crewell, S., and Van Lipzig, Cryosphere, 8, 1577–1587, https://doi.org/10.5194/tc-8-1577- N. P. M.: Cloud and precipitation properties from ground-based 2014, 2014. remote-sensing instruments in East Antarctica, The Cryosphere, Palerme, C., Genthon, C., Claud, C., Kay, J. E., Wood, N. B., and 9, 285–304, https://doi.org/10.5194/tc-9-285-2015, 2015. L’Ecuyer, T.: Evaluation of Antarctic precipitation in CMIP5 Grazioli, J., Lloyd, G., Panziera, L., Hoyle, C. R., Connolly, P. models, current climate and projections, Clim. Dynam., 48, 225– J., Henneberger, J., and Berne, A.: Polarimetric radar and in 239, https://doi.org/10.1007/s00382-016-3071-1, 2016. situ observations of riming and snowfall microphysics dur- Palerme, C., Claud, C., Dufour, A., Genthon, C., Kay, J. E., Wood, ing CLACE 2014, Atmos. Chem. Phys., 15, 13787–13802, N. B., and L’Ecuyer, T.: Evaluation of Antarctic snowfall in https://doi.org/10.5194/acp-15-13787-2015, 2015. global meteorological reanalyses, Atmos. Res., 48, 225–239, Grazioli, J., Genthon, C., Boudevillain, B., Duran-Alarcon, C., Del https://doi.org/10.1007/s00382-016-3071-1, 2017. Guasta, M., Madeleine, J.-B., and Berne, A.: Measurements of Parish, T. R. and Bromwich, D. H.: The surface wind field over the precipitation in Dumont d’Urville, Adélie Land, East Antarctica, Antarctic ice sheets, Nature, 328, 51–54, 1987. The Cryosphere, 11, 1797–1811, https://doi.org/10.5194/tc-11- Peters, G., Fischer, B., Münster, H., Clemens, M., and Wag- 1797-2017, 2017a. ner, A.: Profiles of raindrop size distributions as retrieved Grazioli, J., Madeleine, J.-B., Gallée, H., Forbes, R. M., Gen- by Microrain Radars, J. Appl. Meteorol., 44, 1930–1949, thon, C., Krinner, G., and Berne, A.: Katabatic winds di- https://doi.org/10.1175/JAM2316.1, 2005. minish precipitation contribution to the Antarctic ice mass Praz, C., Roulet, Y.-A., and Berne, A.: Solid hydrometeor classifica- balance, P. Natl. Acad. Sci. USA, 114, 10858–10863, tion and riming degree estimation from pictures collected with a https://doi.org/10.1073/pnas.1707633114, 2017b. Multi-Angle Snowflake Camera, Atmos. Meas. Tech., 10, 1335– Kneifel, S., Maahn, M., Peters, G., and Simmer, C.: Observation of 1357, https://doi.org/10.5194/amt-10-1335-2017, 2017. snowfall with a low-power FM-CW K-band radar (Micro Rain Schneebeli, M., Dawes, N., Lehning, M., and Berne, A.: High- Radar), Meteorol. Atmos. Phys., 113, 75–87, 2011. resolution vertical profiles of X-band polarimetric radar observ- Kneifel, S., Lerber, A., Tiira, J., Moisseev, D., Kollias, P., and ables during snowfall in the Swiss Alps, J. Appl. Meteorol. Cli- Leinonen, J.: Observed relations between snowfall microphysics matol., 52, 378–394, 2013. and triple-frequency radar measurements, J. Geophys. Res.- Schneider, U., Becker, U. A., Finger, P., Meyer-Christoffer, A., Atmos., 120, 6034–6055, 2015. Ziese, M., and Rudolf, B.: GPCC’s new land surface precipi- König-Langlo, G., King, J. C., and Pettré, P.: Climatology of tation climatology based on quality-con,trolled in situ data and the three coastal Antarctic stations Dumont d’Urville, Neu- its role in quantifying the global water cycle, Theor. Appl. Cli- mayer, and Halley, J. Geophys. Res., 103, 10935–10946, matol., 115, 15–40, https://doi.org/10.1007/s00704-013-0860-x, https://doi.org/10.1029/97JD00527, 1998. 2014. Krajewski, W. F. and Smith, J. A.: Radar hydrology: rainfall esti- Scipión, D. E., Mott, R., Lehning, M., Schneebeli, M., and Berne, mation, Adv. Water Resour., 25, 1387–1394, 2002. A.: Seasonal small-scale spatial variability in alpine snowfall and Maahn, M. and Kollias, P.: Improved Micro Rain Radar snow mea- snow accumulation, Water Resour. Res., 49, 1446–1457, 2013. surements using Doppler spectra post-processing, Atmos. Meas. Souverijns, N., Gossart, A., Lhermitte, S., Gorodetskaya, I. V., Tech., 5, 2661–2673, https://doi.org/10.5194/amt-5-2661-2012, Kneifel, S., Maahn, M., and van Lipzig, N. F. L.: Esti- 2012. mating radar reflectivity – snow fall rate relationships and Mawson, D.: The home of the blizzard, William Heinemann, Lon- their uncertainties over Antarctica by combining disdrom- don, 1915. eter and radar observations, Atmos. Res., 196, 211–223, Medina, S. and Houze Jr., R. A.: Small-scale precipitation elements https://doi.org/10.1016/J.atmosres.2017.06.001, 2017. in midlatitude cyclones crossing the California Sierra Nevada, Witze, A.: Climate science Antarctic cloud study takes off, Nature, Mon. Weather Rev., 143, 2842–2870, 2015. News in Focus, 529, 12 pp., 2016. Earth Syst. Sci. Data, 10, 1605–1612, 2018 www.earth-syst-sci-data.net/10/1605/2018/
You can also read