Statistical Characterization of Airplane Delays - Research ...
←
→
Page content transcription
If your browser does not render page correctly, please read the page content below
Statistical Characterization of Airplane Delays Evangelos Mitsokapas Queen Mary University of London Benjamin Schäfer ( b.schaefer@qmul.ac.uk ) Queen Mary University of London Rosemary Harris Queen Mary University of London Christian Beck Queen Mary University of London Research Article Keywords: aviation industry, globally connected economy, COVID-19 pandemic Posted Date: December 29th, 2020 DOI: https://doi.org/10.21203/rs.3.rs-133115/v1 License: This work is licensed under a Creative Commons Attribution 4.0 International License. Read Full License Version of Record: A version of this preprint was published at Scienti c Reports on April 12th, 2021. See the published version at https://doi.org/10.1038/s41598-021-87279-8.
1                       Statistical Characterization of Airplane Delays
 2           Evangelos Mitsokapas,1 Benjamin Schäfer,1, ∗ Rosemary Harris,1 and Christian Beck1
     1
 3       School of Mathematical Sciences, Queen Mary University of London, London E1 4NS, United Kingdom
 4           The aviation industry is of great importance for a globally connected economy. Customer sat-
 5        isfaction with airlines and airport performance is considerably influenced by how much flights are
 6        delayed. But how should the delay be quantified with thousands of flights for each airport and
 7        airline? Here, we present a statistical analysis of arrival delays at several UK airports between 2018
 8        and 2020. We establish a procedure to compare both mean delay and extreme events among airlines
 9        and airports, identifying a power-law decay of large delays. Furthermore, we note drastic changes
10        in plane delay statistics during the COVID-19 pandemic. Finally, we find that delays are described
11        by a superposition of simple distributions, leading to a superstatistics.

12                                             I.   INTRODUCTION

13      The aviation industry was a rapidly growing sector until recently, prior to the current COVID-19
14   pandemic. Economic growth led to higher average yearly distances travelled, as well as higher air
15   traffic volumes, robustly observed among several regions worldwide until 2019 [1, 2]. But both the
16   ongoing pandemic [3] and also the push towards more renewable options in aviation [4] may induce
17   a considerable change in the industry in the future. This makes the industry a very interesting
18   object to study as it transforms.
19      As a passenger, an important benchmark for evaluating travel options, e.g. in terms of airports,
20   airlines or even modes of transportation (train vs plane) is the punctuality of each option. In par-
21   ticular, flight delays severely decrease customer satisfaction and might lead to customers choosing
22   a different airport or airline, especially if a timely arrival is urgently required [5]. Generally, it
23   is important to quantitatively understand delay-risks both in terms of the expectation values but
24   also in terms of the extreme events, i.e. quantifying how likely a very early or very late arrival is.
25      The study of delays in aviation is already an active field of research. Previous, simple, investiga-
26   tion frameworks to classify and categorize delays have been proposed [6] but mostly relied on mean
27   values. In other cases, stochastic models of plane delays [7] were developed without considering
28   the corresponding probability distributions or assuming simple Normal or Poisson distributions [8].
29   More recent work also includes the application of machine learning techniques to aviation data, e.g.
30   via recurrent neural networks [9]. One problem of any data-driven approach is that many articles
31   on aviation research solely rely on proprietary data: In a recent review investigating 200 research
32   articles, 68% were based on proprietary data [10]. Hence, to enable the broader applicability of
33   machine learning applications, more publicly available data are still required.
34      To quantify delay statistics, we will go beyond the oft-used averages of delays [6] and instead
35   investigate the entire probability density function, as it encodes the full range of delay information,
36   from highly negative delays (i.e. flights arriving significantly earlier than their scheduled arrival
37   time) to severely positively delayed flights. To explain the emergence of heavy tails, i.e. extreme
38   deviations from the mean, we will utilize superstatistical modelling [11]. Such an approach has been
39   successfully applied in transport before, for modelling train delays [12]; it has also attracted recent
40   interest when describing fluctuations in the energy system [13] and air pollutant concentrations
41   [14] and it has been extended to the general framework of diffusing diffusivities in nonequilibrium
42   statistical physics and biologically inspired physics [15].
43      In this article, we present new data collected from 2018 to 2020 at several UK airports, with a
44   particular focus on Heathrow, being the most important international hub in the UK. The data

     ∗   Correspondence to b.schaefer@qmul.ac.uk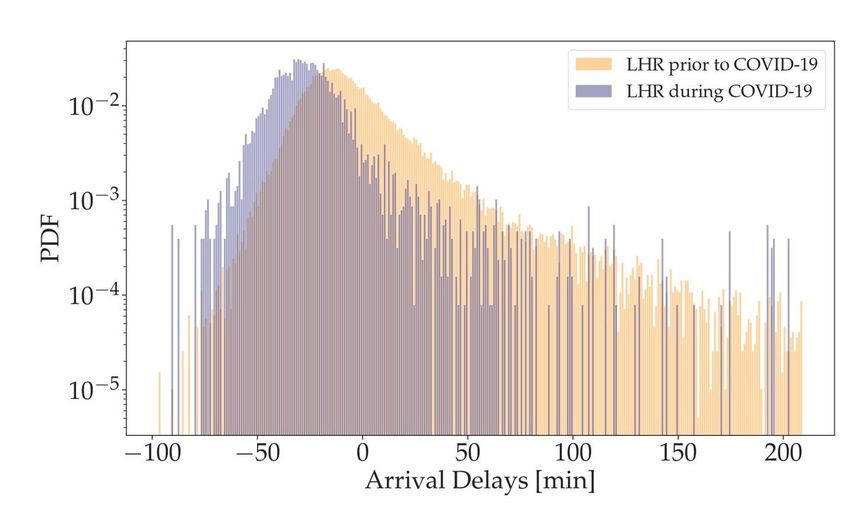
2

45   were publicly available from the arrival information of each airport, given out on their websites each
46   day but had to be collected and processed for further usage. We analyse the full probability density
47   of delay distributions and introduce certain performance indices to describe these distributions,
48   such as the mean delay, the exponential decay rate of negative delays, and the power-law exponent
49   of large delays. These indices are then compared for the different UK airports and the different
50   airlines operating at these airports, to understand the main features of the delay statistics in a
51   more systematic way. Finally, we deal with a theoretical model to explain features of the delay
52   statistics. We show that the power law of large positive delays can be linked to a superposition
53   of exponential delays with a varying decay parameter, in a superstatistical approach. On the
54   contrary, negative delays (early arrivals) do not exhibit any power laws but simply behave in an
55   exponential way, with extremely early arrivals exponentially unlikely. Throughout this article, we
56   assume that passengers prefer to arrive as early as possible, i.e. with as little positive and as much
57   negative delay as possible.

58                                              II.   NEW DATA

59      We collected flight details from a number of different airports. For the purposes of this article,
60   we have taken into consideration the top five UK airports, in order of passenger traffic [16], namely:
61   London Heathrow Airport (LHR), London Gatwick Airport (LGW), London Luton Airport (LTN),
62   London Stansted Airport (STN) and Manchester Airport (MAN). For a period of time lasting
63   between Autumn 2018 and Spring 2019, we collected a combined total of approximately two-
64   hundred and twenty thousand (2.2 × 10⁵ ) flight-arrivals from all five airports mentioned above.
65   Furthermore, we continued collecting flight-information from London Heathrow during the 2020
66   COVID-19 pandemic, to illustrate the effect the lockdown had on the delay distribution. For each
67   flight, we recorded the airline company operating the flight along with the corresponding flight
68   number, departure and arrival airports, as well as scheduled and actual landing times. The delay
69   is then computed simply as the difference between an aircraft’s scheduled arrival time and its actual
70   arrival time. We made all collected data publicly available. For details of the data processing and
71   availability, see Methods.
72      The main body of our data (about 85%) is sourced from London Heathrow, making it the chief
73   focus of our analysis simply due to its size. London Heathrow is an international airport operating
74   flights of 80 different airlines in total, which fly to 84 different countries around the world, as of 2019
75   [16]. Of course, in addition there are domestic flights within the UK. The passenger nationalities
76   are 48% European and UK and 52% from the rest of the world. It is the busiest airport in Europe
77   by passenger traffic [16].
78      The empirical probability density function (PDF) of all delays is a key characteristic to monitor,
79   see Fig. 1 for all Heathrow delays. There, we compare the data collected from 2018 to 2019 with
80   more recent data collected during the 2020 COVID-19 pandemic (during the first lockdown in
81   Spring to Summer 2020), which led to a drastic reduction in air transport [17, 18]. There are
82   two interesting observations: Firstly, the delay statistics under COVID-19 are shifted to the left,
83   indicating overall smaller delays (including more negative delays); secondly, the general shape of
84   the distribution does not change drastically. In particular, we observe a fast decay of the PDF of
85   negative delays on the left side and a much slower decay of the PDF on the right side for positive
86   delays. In the following sections, we will analyse this behaviour in much more detail.

87                             III.   QUANTIFYING DELAY STATISTICS

88      Starting from a histogram of the flight delays, we derive three indices/measures to quantify flight
89   delay distributions: Mean delay, exponent of left exponential and power-law exponent of right q-
90   exponential, as explained below in detail. We will use the LHR data previous to any COVID-19
91   influence as our main example.
3

                                                                                      LHR prior to COVID-19
                                                                                      LHR during COVID-19
                 10−2

                 10−3
           PDF

                 10−4

                 10−5

                        −100      −50            0        50      100                    150         200
                                                  Arrival Delays [min]

      FIG. 1. Flight delays follow a broad distribution with large negative and positive delays. We display LHR
      delay histograms prior to and during the COVID-19 pandemic, both normalized. As the COVID-19 LHR
      data set is significantly smaller in size, compared to the regular LHR data set, it contains many gaps,
      where no data were recorded. The COVID-19 data set is significantly shifted towards the left (smaller
      delays) as compared to the pre-pandemic time.

 92     As a first step, we split the full histogram at its peak value into two histograms, a left flank of
 93   dominantly negative delays and a right flank of dominantly positive delays, see Fig. 2. Based on the
 94   shape of the empirical distributions, we use exponentials and q-exponentials as fitting functions,
 95   see also Methods for details.
        The left flank is observed to be well approximated by an exponential function of the form

                                             p(tL ; λ) = λe−λtL , λ > 0,                                      (1)

 96   where tL are the normalized arrival delays on the left flank, see Methods for details. The exponent
 97   λ here quantifies the exponential decay of the probability of early arrivals. Therefore, a large λ
 98   implies that few flights arrive very early while a small λ indicates that very large negative delays
 99   are observed. Hence, typically, we assume a small λ to be desirable.
        The right flank of the delay distribution obeys a power law, i.e. a slow decay of p ∼ tν , with
      ν negative. To quantitatively describe the right flank, we use a q-exponential function [19] of the
      form
                                                                                  1
                                  p(tR ; q, λq ) = (2 − q)λq [1 + (q − 1)λq tR ] 1−q ,                        (2)

100   where tR are the normalized arrival delays on the right flank, see Methods for details. The power-
101   law exponent, i.e., the rate at which the probability density decays for high (positive) delay values,
102   is given by ν := 1/(1 − q), 1 < q < 2. Note that the scale parameter λq > 0 is relevant for
103   the precise fit but will not be used as a delay index as its influence on the delay distribution is
104   limited. Contrary to the left-flank exponential decay, the absolute values of the right-flank power
105   law exponent ν should be as large as possible. Large (absolute) values of ν imply a rapid decay of
106   positive delays, i.e. fewer extreme events of very delayed arrivals.
107      Finally, we note that the two flanks describe the tails of the distribution well but overestimate
108   the peak, i.e. the most likely value, see Fig. 3. Hence, we complement the two previous fits by
109   using the mean delay µ as a third index. Since we assume that passengers wish to arrive as early as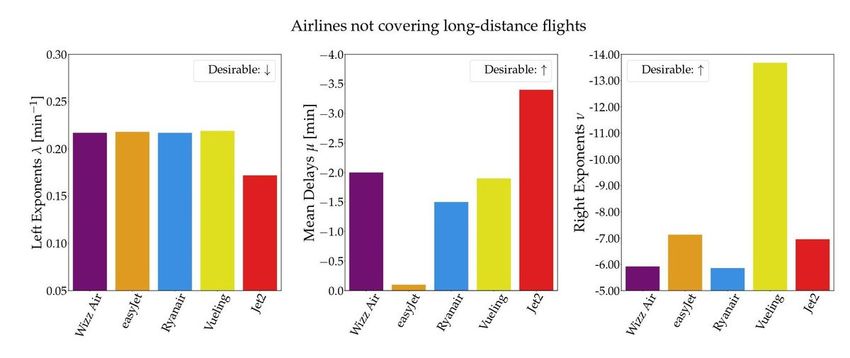
4
10−2 10−2
PDF
10−3 10−3
10−4
10−4
−100 −80 −60 −40 −20 0 50 100 150 200
Left flank Arrival Delays [min] Right flank Arrival Delays [min]
FIG. 2. Splitting the full distribution at the peak leads to two easier-to-fit flanks. Left: Negative delays
decay approximately linearly in the log-scale and thereby suggest an exponential fit (1) Right: Positive
delays display substantial heavy tails and thereby suggest the usage of a q-exponential function (2).
10−1
λ = 0.131
ν = −5.371
10−2 Data
10−3
PDF
10−4
10−5
10−6
−100 −50 0 50 100 150 200
Arrival Delays [min]
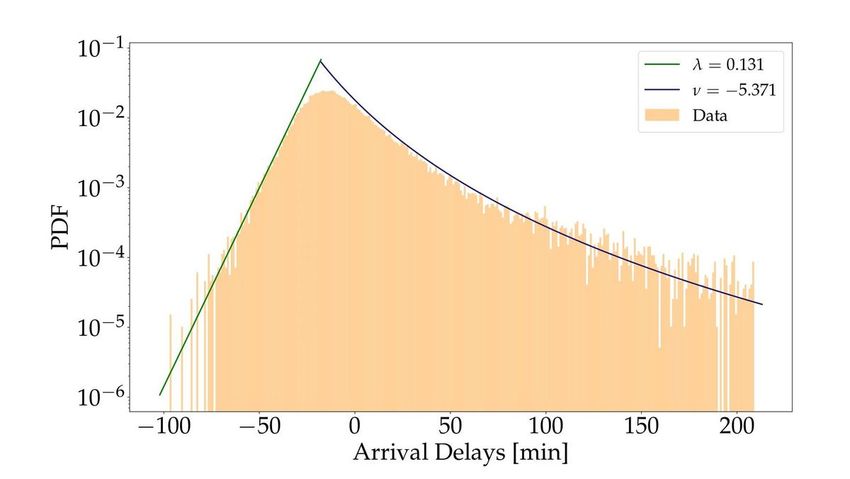
FIG. 3. Exponential (green) and q-exponential (blue) theoretical distributions capture the empirical dis-
tribution. The fits are obtained via the MLE method, see Methods for fitting details. To complement the
over-estimated “peak” (tent-like shape) we introduce the mean delay µ index.
110 possible, the mean µ should be as small (or as negative) as possible. In the case of LHR, the three
111 delay indices that we introduced are λ = 0.131, µ = −5.06 and ν = −5.371. We also introduce a
112 continuous smooth fitting function for the full range in Section VI.
113 Note that the mean value µ can be easily manipulated by airline companies by scheduling flight
114 arrival times later then actually needed, hence always causing a negative mean delay, which may
115 artificially improve their performance. On the contrary, the tail behavior truthfully represents the
116 extreme event statistics for both positive and negative delays and cannot be easily manipulated
117 by the operators.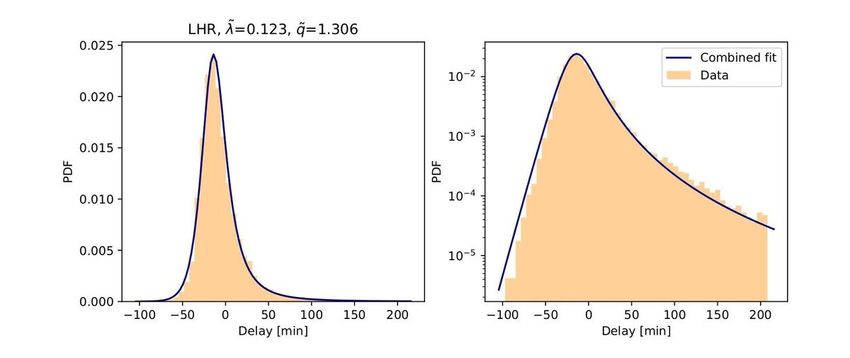
5
Airlines covering long-distance flights
0.30 −9 −10
Desirable: ↓ Desirable: ↑ Desirable: ↑
−8 −9
Left Exponents λ [min−1]
0.25
Mean Delays µ [min]
Right Exponents ν
−7 −8
0.20
−6 −7
0.15
−5 −6
0.10 −5
−4
−4
0.05 −3
Iberia
Finnair
Air Canada
Iberia
Finnair
Air Canada
Iberia
Finnair
Air Canada
Aer Lingus
Qatar Airways
Aer Lingus
Qatar Airways
Aer Lingus
Qatar Airways
Japan Airlines
Japan Airlines
Japan Airlines
British Airways
United Airlines
British Airways
British Airways
American Airlines
American Airlines
United Airlines
American Airlines
United Airlines
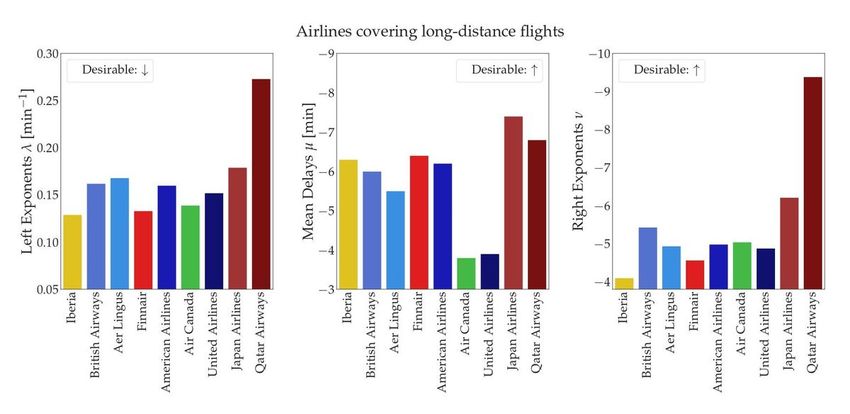
FIG. 4. International airlines appear to differ substantially in their three delay indices. We plot the left-
side (negative) delay exponential decay, right-side (positive) power-law delay decay and the mean delay.
Arrows indicate whether a small or large value is desirable.
118 IV. COMPARISON OF AIRPORTS AND AIRLINES
119 We here use the previously developed framework to quantify and compare delay statistics for
120 different airlines and airports. Intuitively, we expect that long-distance flights would, on average,
121 yield more extreme early or late arrivals, compared to the corresponding short-distance ones. Thus,
122 we distinguish between short-distance airlines, covering mostly domestic and European destina-
123 tions, and airlines that include long-distance, international destinations, as well as destinations
124 within Europe. We first compute the three indices λ, µ, ν for each of those airline groups and then
125 compare full airport statistics, aggregating all airlines.
126 There are several factors impacting the delay distribution for each airport or airline: Airline
127 policies, flight routes, technical defects or issues with documentation contribute to 27% of all delays
128 [20]. Specifically, overseas flights are more sensitive to wind (head wind or tail wind), as well as
129 unstable weather conditions (storms, fog) and military exercises. Airlines operating international
130 flights, as illustrated in Fig. 4, exhibit considerable variations in their flight delay indices. Note
131 that while a low left exponent λ may be regarded as a desirable property (flights often arrive
132 very early), the mean µ and the right exponent ν should definitely be as small as possible (low
133 mean delay and few very late arrivals). Since both quantities tend to be negative, their absolute
134 values should be large. Comparing the airlines, we observe a “grouping” behaviour for some of the
135 carriers. On the one hand, airlines having a blend between short-distance (e.g. domestic or EU)
136 and overseas destinations, such as Iberia, British Airways (BA), Aer Lingus and Finnair, appear
137 to follow a similar trend for each index. On the other hand, airlines that do not possess such a
138 spread of destinations tend to perform well only in some of the indices. As an illustrative example
139 we choose Air Canada and United Airlines: Although both their left and right exponents are in a
140 similar range to the other airlines, their mean delays are substantially less negative than those of
142
141 their competitors.
143 Characterization of short-distance flights shows a strong grouping of the delay behavior for
144 some airlines. As seen in Fig. 5, comparison of five of the largest low-cost domestic and European
145 providers, reveals a systematic similarity between Wizz Air, easyJet and Ryanair. All three airlines
146 manage to perform well in the left exponent metric, minimizing early arrivals, while they maintain
147 an acceptable negative average delay (with easyJet performing worst here). Again, they follow a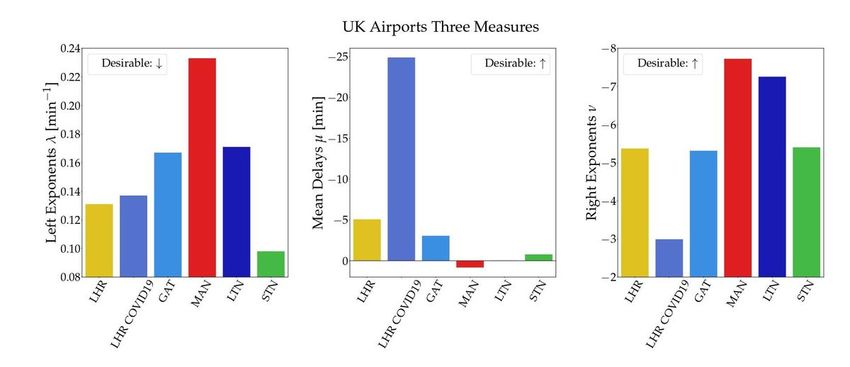
6
Airlines not covering long-distance flights
0.30 −4.0 -14.00
Desirable: ↓ Desirable: ↑ Desirable: ↑
−3.5 -13.00
Left Exponents λ [min−1]
0.25 -12.00
Mean Delays µ [min]
−3.0
Right Exponents ν
-11.00
0.20 −2.5
-10.00
−2.0
-9.00
0.15 −1.5
-8.00
−1.0
0.10 -7.00
−0.5 -6.00
0.05 0.0 -5.00
Air
t
ir
Jet2
g
r
2
t
air
r
air
2
ng
t
ng
yJe
yJe
yJe
Ai
Ai
Jet
Jet
elin
ana
eli
eli
an
an
eas
eas
eas
zz
zz
zz
Vu
Vu
Vu
Ry
Ry
Ry
Wi
Wi
Wi
FIG. 5. Delay indices for low-cost airlines not covering long-distance flights. Wizz Air, easyjet, Ryanair
and Vueling share the largest λ index (early arrivals). Jet2 has the smallest mean delay µ and Vueling is
characterized by the smallest ν index (late arrivals).
148 similar right-exponent trend, translated to a certain number of overall late arrivals. Furthermore,
149 Jet2 outperforms all other short-distance airlines in λ left-exponents and mean delays. Finally,
150 Vueling resembles Wizz Air and Ryanair values in the λ and µ metrics but seems to have less late
151 arrivals as per its high right exponent ν.
152 Comparing the long distance airlines with the short-distance ones, we notice some differences:
153 Airlines covering long distances tend to display lower (more desirable) left exponents as well as
154 higher negative mean delays. Meanwhile, the right exponent behavior is similar between the two
155 groups with Vueling and Qatar Airlines as the ”outliers” in their respective category. Whether
156 this behavior is due to company policies or flight distance remains a question for future research.
157 Studying the indices for individual airports yields interesting insights as well. Airports populated
158 by airlines flying mainly to domestic and EU destinations, such as LTN and STN, score fairly well
159 in both early and late arrivals, with an approximately net zero mean delay, see Fig. 6. On the one
160 hand, STN is characterized by the minimum λ value, showing the best performance in early arrivals
161 in the group of airports, while LTN attains an acceptable value. On the other hand, it can be
162 seen that LTN scores the second best ν value while STN lies very slightly above the median group
163 ν. Interestingly, mean delays at MAN airport are net positive, contrary to LHR and GAT where
164 arrivals are scheduled in such a way that the mean delay is negative. Furthermore, MAN seems to
165 not perform that well in the early arrivals index, having the worst score, but does outperform all
166 the rest of the airports when compared under the extreme positive delays. International airports
167 such as LHR and GAT (with the exception of LHR COVID-19) tend to cluster around similar
168 values for all delay indices.
169 LHR during the COVID-19 pandemic outperforms all airports on the mean delay index by a large
170 margin. The reason behind this is that the dramatic reduction of flight traffic worldwide saw many
171 flights arriving too early. Interestingly, the left exponent, i.e. the decay of early arrivals, did not
172 change substantially, compared to business-as-usual since the shape of the delay distribution on the
173 left did not change much but was only shifted to more negative values. The right flank behaves quite
174 differently: Both business-as-usual and LHR during the COVID-19 pandemic, recorded heavily
175 delayed flights, which arrived more than 3 hours late (see also Fig. 1). The right index reveals
176 the likelihood of these extreme events. In the case of LHR under COVID-19, the low mean delay
177 suggests early arrival but the extreme events are still present and hence the right exponent reveals
178 this poor performance.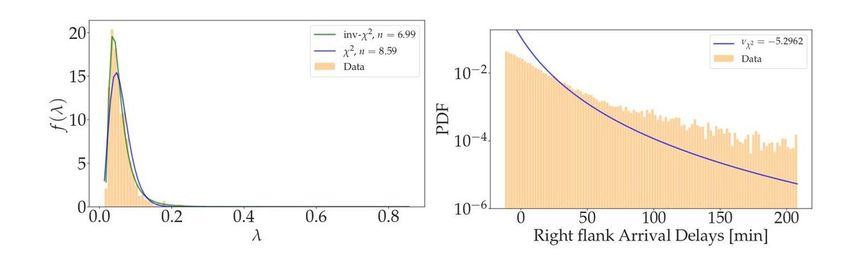
7
UK Airports Three Measures
0.24 −8
−25
Desirable: ↓ Desirable: ↑ Desirable: ↑
0.22
Left Exponents λ [min−1]
−7
−20
Mean Delays µ [min]
0.20
Right Exponents ν
−6
0.18 −15
0.16 −5
−10
0.14
−4
0.12 −5
−3
0.10
0
0.08 −2
R
T
N
N
N
R
T
N
N
N
R
T
N
N
N
19
19
19
GA
GA
GA
LH
LH
LH
MA
LT
ST
MA
LT
ST
MA
LT
ST
ID
ID
ID
OV
OV
OV
RC
RC
RC
LH
LH
LH
FIG. 6. Airports appear to differ substantially in the three delay metrics. Airports that serve mostly
domestic and European destinations, such as LTN and STN, behave differently from international airports
such as LHR, GAT and MAN.
179 V. SUPERSTATISTICAL MODELLING OF DELAYS
180 As we have seen previously, the right flank of the delay statistics exhibits heavy tails and is
181 well-described by a q-exponential. Let us now explore a potential explanation for this particular
182 distribution by employing the framework of superstatistics [11, 21, 22]. Superstatistics is relevant
183 when an aggregated system (e.g. a long time series) displays heavy tails, but the system may then
184 be disentangled into many smaller sub-parts (e.g. short time periods of the trajectory). These
185 sub-parts then are no longer heavy-tailed but follow a simple local distribution, for example an
186 exponential or a Gaussian. This idea has been successfully applied, for example, to train delays
187 [12], electric power systems [13] and intermittent wind statistics [23].
Assuming for now that the right-flank delays are indeed q-exponentially distributed and follow a
superstatistics, we should be able to observe “local” exponential densities, with a decay parameter
λ. Superimposing all these λ, we get a q-exponential if the λ themselves follow a χ2 -distribution:
n
1 n 2 n −1 − 2λ nλ
f (λ) = n
λ2 e 0 . (3)
Γ 2 2λ0
188 Here n denotes the number of degrees of freedom characterizing the fluctuations in λ and λ0 is
189 the sample mean of λ. Indeed, choosing an adequate time scale to separate the trajectory (see
190 next paragraph), the heavy tails of delay distributions vanish and instead the distributions are well
191 described by simple exponential functions, see Fig. 7.
Let us explain how to extract the relevant time scale T on which we locally observe exponential
distributions. Since we know that an exponential distribution has a kurtosis of κexponential = 9, we
test time windows of different size ∆τ and compute the local average kurtosis [11] as
Z τmax −∆τ 4
1 h(u − ū) iτ0 ,∆τ
κ̄ (∆τ ) = dτ0 2 , (4)
τmax − ∆τ 0 h(u − ū) i2τ0 ,∆τ
192 where τmax is the length of the time series u and ū is the mean of the time series. We denote by
193 h. . . iτ0 ,∆τ the expectation formed for a time slice of length ∆τ starting at τ0 . For the LHR data,
194 we show how to determine the long time scale T in Fig. 8.
195 Next, let us carry out an important consistency check: As explained above, the mixing of
196 numerous local exponential distributions with exponents following a χ2 -distribution leads to a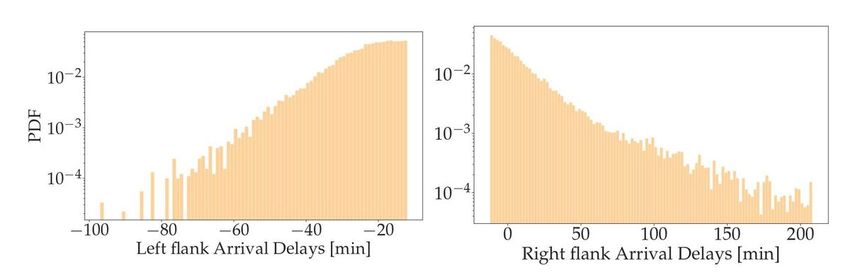
8
Low exponent, e =-0.04 High exponent, e =-0.24
Exp fit Exp fit
Data Data
1
2 10
10
PDF
PDF
3
10
2
10
25 0 25 50 75 10 5 0
Delay [min] Delay [min]
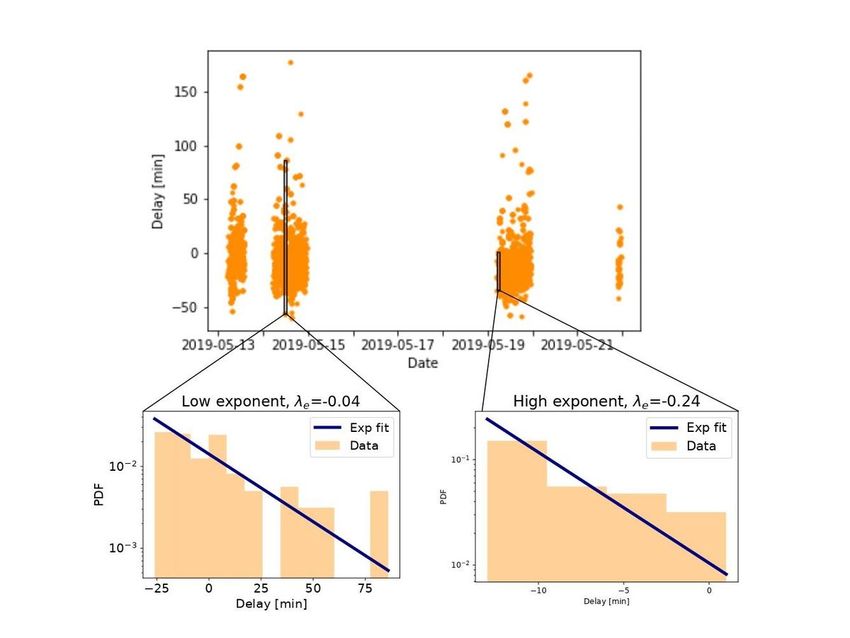
FIG. 7. We analyse the full time series of plane delays and extract a time window during which we observe
locally exponential distributions. These local distributions can decay slowly or fast, i.e. the rate λ is
fluctuating.
197 q-exponential. Now, we can make a histogram of the λ-distribution and fit it with a χ2 - and
198 an inverse χ2 -distribution. Next, we derive the q-exponential from the fitted χ2 -distribution and
199 compare it with the direct fit of the q-exponential and the original data. This is illustrated in
200 Fig. 9.
201 We note that the empirical λ-distribution is slightly better fitted by an inverse χ2 - than a
2
202 χ -distribution, as also observed in other application areas [14, 24]. Overall, the superstatistical
203 description seems consistent, given the short time series of flight delays under consideration. The q-
204 exponential derived from the χ2 tends overestimate the PDF at low values, which is understandable
205 as we also exclude them for the fitting of the q-exponential via MLE (see methods). Still, the tail
206 behavior of the q-exponential based on the χ2 matches the real data and the MLE fit nicely.
207 This means the observed power laws of the right flank are essentially explained by a suitable
208 superstatistics which describes changes in the microvariables on a time scale of T ≈ 1.5 hours.
209 VI. CONNECTING THE FLANKS
210 So far, we focused our attention on describing and fitting the tail aspects of the distribution,
211 namely the left, approximately exponential, flank and the right, approximately q-exponential,
212 flank. Both these functions combined overestimate the peak of the distribution and hence, we also
213 included the mean delay as the final metric in our framework. Now, let us consider how the two
214 tail distributions could be merged in one smooth-fitting function.
First, we note that the so far mostly ignored central part of the delay distribution might be
approximated by a Gaussian distribution, based on the parabola shape in the log-scale plots. We
use this insight to propose the following continuous fitting function
p
Ae exp −λ C + (t − tpeak )2 , t < tpeak
p(t) = p (5)
Aq expq −λq C + (t − tpeak )2 , t ≥ tpeak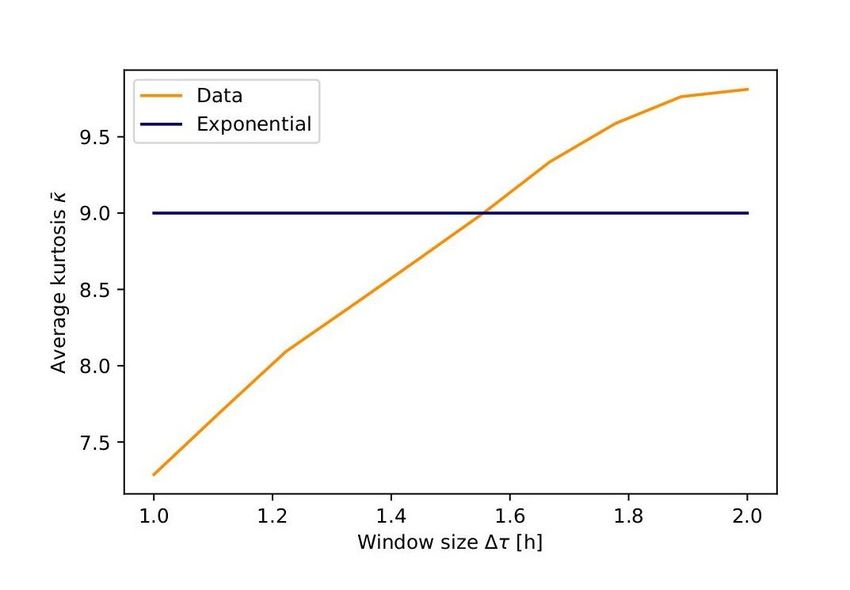
9

                                                                   Data
                                                      9.5          Exponential

                                                      9.0
                                   Average kurtosis

                                                      8.5

                                                      8.0

                                                      7.5

                                                            1.0         1.2           1.4       1.6                1.8        2.0
                                                                                     Window size [h]

      FIG. 8. The average kurtosis κ̄ of the data set is plotted as a function of the time window ∆τ in hours
      (blue). The intersection between the horizontal line at κ̄ = 9 (the kurtosis of an exponential distribution)
      and the κ̄ vs ∆t curve gives the optimal value for ∆t; we find T ≈ 1.55 hours.

                        20                                                    inv-χ2, n = 6.99
                                                                                                                                              νχ2 = −5.2962
                                                                              χ2, n = 8.59
                                                                                                                                              Data
                                                                              Data
                        15                                                                             10−2
                f (λ)

                                                                                                 PDF

                        10
                                                                                                       10−4
                         5

                         0
                             0.0   0.2                      0.4         0.6          0.8               10−6
                                                                                                              0         50       100      150      200
                                                               λ                                                  Right flank Arrival Delays [min]

      FIG. 9. Applying superstatistics leads to consistent results. Left: We extract the distribution of local
      exponents and compare them to a χ2 and inverse χ2 fit (based on the method of least squares). Right: Using
      the previously derived χ2 distribution, we again derive a q-exponential with right exponent νχ2 ≈ −5.296,
      compared to the fitted one of νMLE ≈ −5.371. Hence, while the low delays are not perfectly matched by
      the χ2 -based q-exponential, the tail behavior is decently captured.

                                                                                 1
215   with expq (t) = (2 − q)λq [1 + (q − 1)λq t] 1−q being the q-exponential function. Here, Ae and Aq are
216   amplitudes, C is a curvature parameter, describing the approximately Gaussian part in the center,
217   tpeak is the delay at the peak of the delay distribution, where we split into left and right flank and
218   t are the delay values, see Methods for fitting details.
219      The resulting fit is a smooth function, covering the full delay range, see Fig. 10. Since the new
220   curvature parameter C also influences the general shape, the new values for q and λ, now named
221   q̃ and λ̃, are slightly different from the ones solely focusing on the tails (empirically we tend to
222   observe a slight reduction in λ and increase in q). Still, the general observations using the delay
223   indices and comparing airlines, such as in Figs. 4-6, remain mostly unchanged. Equation (5)
224   provides an alternative approach to the three delay indices introduced so far. If one is interested
225   in describing the full distribution as accurately as possible, we recommend using equation(5).
226   Meanwhile, to compare performance of individual airlines or to obtain a general impression of the
227   delay distribution, the three delay indices are a simplified framework, allowing easy and robust
228   estimation and comparison. Finally, note that the full curve is not strictly a probability density
229   function as we did not enforce that its integral equals one. While theoretically making it easier by
230   reducing the number of parameters, that would make the fitting more difficult in practice as the
231   integrals cannot be evaluated analytically by hand but only impose additional constraints during
10
232 the fitting. Also note that our observed flight delays live on the finite interval [-100,210], whereas
233 the fitting function is defined on [−∞, ∞], which makes the normalization outside the interval
234 ambiguous.
LHR, =0.123, q=1.306
0.025
Combined fit
10 2 Data
0.020
10 3
0.015
PDF
PDF
0.010 10 4
0.005 10 5
0.000
100 50 0 50 100 150 200 100 50 0 50 100 150 200
Delay [min] Delay [min]
FIG. 10. Using the approximately Gaussian shape in the center, we smoothly combine left and right flank
fits into one coherent fit of the full delay data set. To emphasize the quality of the fit, we display both a
linear (left) and logarithmic (right) scale of the PDF for LHR.
235 VII. DISCUSSION AND CONCLUSIONS
236 In summary, we have analysed a newly obtained data set of plane delays for various British
237 airports, which contains tens of thousands of flights, aggregated over multiple months. This is a
238 substantial improvement to some earlier studies which only investigated a few days of measure-
239 ments and a couple of thousand flights, thereby greatly underestimating the contribution of the
240 tails to the probability distribution [25]. Interestingly, we find that all investigated airports and
241 even individual airlines at each airport follow a qualitatively similar distribution, namely an ap-
242 proximately exponential decay on the left flank (of negative delays) and a slowly decaying power
243 law on the right flank (of positive delays). To characterize these distributions and systematically
244 compare airlines and airports, we have developed a framework to quantify delay performance.
245 Critically, we do not only use the mean delay but also consider extreme events of both positive
246 and negative delays via their respective flanks in the empirical probability distribution. Applying
247 this newly developed framework, we find substantial differences between airlines serving short and
248 long-distance routes.
249 We offer an explanation for the emerging power law on the right flank via superstatistics: The
250 local q-exponential distribution with its heavy tails seems to arise from many superimposed expo-
251 nential distributions. In particular, we identify the long time scale T as approximately 1.5 hours,
252 during which delays fall off exponentially. Comparing to other superstatistical results [21, 22], we
253 note the relevance of both χ2 -distributions and inverse-χ2 -distributions for the scale parameter,
254 similar to the ones observed in air pollution or cancer [14, 24], stressing again the universality
255 of superstatistics. Finally, we propose a continuous function to capture the full delay statistics.
256 While this introduces additional parameters and the superstatistical theory mentioned previously
257 is no longer applicable, this fit does describe the full distribution with high accuracy.
258 Our framework of three delay indices to characterize flight delay distributions can be applied
259 quite generally to measure the punctuality of flights, going beyond an analysis based on just the
260 mean. Crucially, while airlines or airports might be able to “game” the system of mean delays,
261 this is not possible with the left and right exponents. Companies could shift their flight schedule,
262 i.e. announcing intentionally that flights will take longer than they do in practice, and thereby11 263 systematically record early arrivals so pushing their mean delay to negative values. However, such 264 a procedure would still leave the remaining two indices (left and right exponent) untouched so that 265 they provide a stable way of measuring performance. 266 One remarkable result is the impact of the global pandemic of COVID-19 on the delay statis- 267 tics. Heathrow (LHR) under COVID-19 conditions (travel restrictions, quarantine upon arrival 268 etc) displays an impressively low mean delay, while the left flank decay was mostly unchanged. 269 Interestingly, LHR still experienced some heavily delayed flights during the COVID-19 pandemic, 270 which leads to pronounced heavy tails towards the right and thereby a poor performance in the 271 right exponent. These observations demonstrate that given fewer flights, the existing infrastructure 272 is able to perform much better in some aspects (mean) than under “business-as-usual” conditions, 273 while others (extreme delays) still can be improved. Aside from the upsides of COVID-19-related 274 lockdown measures on air quality [26, 27] or CO2 emissions [28], we find that having fewer flights 275 also improves delay statistics. 276 We have assumed throughout this article that negative delays are preferred by all passengers. 277 However, some passengers might value arrival at exactly the predicted time more highly than 278 arriving early. This would change the interpretation of the left index slightly: Instead of desiring 279 low exponents, airlines and airports should aim for high exponents. Similarly, the absolute value 280 of the delay should be zero, i.e. the arrival on time should be the default. Regardless of preference, 281 the indices, as introduced, provide a sufficient framework to measure the delay performance. 282 In the future, we would like to apply our framework to delay statistics at other airports in 283 different countries, and investigate how delays are related to geographical distance of the flights. 284 In particular it would be interesting to see how our three indices differ between years, countries 285 and so on. From a more fundamental perspective, we aim to further understand correlations 286 in the flight delays. Preliminary indications from the British data are that on “typical” days 287 correlations decay quickly but on some “exceptional” days (perhaps those where external factors 288 affect many flights) the autocorrelation function can settle on a non-zero value for some time and 289 many flights have long delays which contribute to the tail of the probability density function. 290 Long-range temporal correlations and memory effects have been studied in many other physical 291 and non-physical systems [29, 30]; modelling such effects here is challenging, since the build-up of 292 delays at one airport may be influenced by earlier flights to and from completely different airports, 293 but practically important since controlling the “cascading” of delays would lead to a significantly 294 improved passenger experience. 295 Acknowledgments 296 This project has received funding from the European Union’s Horizon 2020 research and inno- 297 vation programme under the Marie Sklodowska-Curie grant agreement No 840825. 298 Author contributions 299 E.M., B.S., contributed equally. E.M., B.S., and C.B. conceived and designed the research. E.M. 300 collected the data, E.M. and B.S. analysed the data and produced the figures. R.H. and all other 301 authors contributed to discussing and interpreting the results and writing the manuscript. 302 Competing interests 303 The authors declare no competing interests.
12

304                                                  METHODS

305                                                Data processing

306      As we mentioned in the main text, for each flight, we recorded the airline company operating
307   the flight, the flight number, the departure and arrival airports as well as the scheduled and actual
308   landing times. The data was cleaned and organized according to the delay, computed as the
309   difference between scheduled arrival time and actual arrival time for each flight. We kept data
310   for each arrival airport as well as a summary of the overall delays, independent of the arrival
311   airport. A “negative” delay occurs when the actual aircraft arrival is earlier than the expected
312   one, according to the scheduled timetable. After examining the data it became evident that a
313   reasonable cut-off point as to how early or late an aircraft can arrive at the designated airport
314   should be implemented. This prevents over-representation of individual extreme events in the
315   resulting probability distributions. We decided that the delays (in minutes) would have to be
316   contained in the interval [−100, 210].

317                                       Theoretical distribution fitting

         Here we explain the fitting procedure in more detail. We approximate the empirical distribution
      of the left flank, where negative delays are dominant, with an exponential distribution of the form

                                              p(tL ; λ) = λe−λtL , λ > 0.                                     (6)
      As we have seen earlier, the observed distribution curves towards a Gaussian distribution around
      the peak value and thereby deviates from an exponential distribution. Hence, we restrict our
      fitting to values deviating from the central area as follows. Let tpeak be the delay at which the
      distribution reaches its highest PDF value and tmin the smallest delay we observe. Then, we
      restrict our exponential fit to any delay falling in the interval [tmin , tpeak − 0.3|tmin − tpeak |], where
      |...| indicates the absolute value. Following this restriction, we define the left flank delay values as
                      tL = −t + tpeak − 0.3|tmin − tpeak |, t ∈ [tmin , tpeak − 0.3|tmin − tpeak |].          (7)
         We now turn to the right flank of the empirical distribution, i.e. the data set that constitutes
      the majority of the positive delays. The q-exponential is much better at incorporating parts of the
      Gaussian central distribution on the right-hand side than the exponential distribution is on the
      left flank. Hence, we only exclude the smallest 10% of the data, i.e. we consider delays t in the
      interval interval [tpeak + 0.1|tmax − tpeak |, tmax ], where tmax is the highest delay observed. Hence
      the right-flank delays to be fitted are defined as
                      tR = t − tpeak − 0.1|tmax − tpeak |, t ∈ [[tpeak + 0.1|tmax − tpeak |, tmax ].          (8)
      Our theoretical distribution choice is now a q-exponential
                                                                                   1
                                   p(tR ; q, λq ) = (2 − q)λq [1 + (q − 1)λq tR ] 1−q ,                       (9)
318   with parameters λq and q.
319      Note that both tL and tR are defined such that they start at 0 and continue towards positive
320   values to keep the fitting functions easier.
         These two functions (exponential and q-exponential) are fitted to the data using a maximum
      likelihood estimate (MLE), i.e. maximizing the Likelihood L(θ, x). Here, x indicates the data we
      wish to fit and θ the set of parameters that are being optimized. The likelihood of a parameter
      setting θ on a given one-dimensional data set x = x1 , x2 , ..., xN is computed as
                                                             N
                                                             Y
                                                 L(θ, x) =         p(xi , θ),                                (10)
                                                             i=1
13 321 with probability density function p(xi , θ), dependent on the parameters θ. Technically, we carry 322 out the MLE using the scipy.stats module in python with custom PDFs, see also Code availability 323 (below) for a link to the code. 324 Fitting the smooth combined function 325 To obtain a smooth fit, combining both flanks, we employ the following procedure. We first 326 estimate the exponential decay rate λ based on the lowest 70% of negative delays, then estimate 327 q and the q-exponential decay rate λq based on almost the full right-hand side of the histogram. 328 This is identical to the procedure for the individual flanking fits. Next, we estimate the central 329 curvature C, which we assume to be identical for both intervals, and the amplitudes Ae and Aq , 330 as well as λq using least squares fitting. While carrying out this least-square fit, we also allow 331 the parameters q and λ to vary up to 10% from the MLE-optimal value determined earlier. The 332 reason to allow any variance is to ensure a continuous fit and we want to keep the change from the 333 optimal MLE parameters small, hence, we restrict it to 10%. Technically, we use the scipy.stats 334 module to perform the MLE fits and the least square fit; continuity is ensured using constraints in 335 the symfit package. 336 Airline data 337 In Figs. 4 and 5 we compared several airlines. Let us briefly list how many flights we analysed 338 to derive our delay indices: For the short-distance airlines ’Wizz Air’: 2428, ’easyJet’: 15449, 339 ’Ryanair’: 13488, ’Vueling’: 1034, ’Jet2’: 1215 and for the other airlines we have ’Iberia’: 12892, 340 ’British Airways’: 38257, ’Aer Lingus’: 7331, ’Finnair’: 8560, ’American Airlines’: 23119, ’Air 341 Canada’: 7247, ’United Airlines’: 6797, ’Japan Airlines’: 5966, ’Qatar Airways’: 5935. For all 342 airlines we have at least 1000 flights and often several thousand flights. 343 Data availability 344 The original data of airport arrivals has been uploaded to an open repository: https://osf. 345 io/snav9/?view_only=74c3a41eab9345aa9bae2b8bc322775c. All data that support the results 346 presented in the figures of this study are available from the authors upon reasonable request. 347 Code availability 348 Python code to reproduce figures, perform the fits and extract the delay indices, is also uploaded 349 here: https://osf.io/snav9/?view_only=74c3a41eab9345aa9bae2b8bc322775c. 350 [1] M. M. Hakim and R. Merkert, Journal of Transport Geography 56, 120 (2016). 351 [2] J. G. Brida, P. D. Monterubbianesi, and S. Zapata-Aguirre, World Review of Intermodal Transporta- 352 tion Research 7, 310 (2018). 353 [3] P. Suau-Sanchez, A. Voltes-Dorta, and N. Cugueró-Escofet, Journal of Transport Geography (2020). 354 [4] H. Kuhn, C. Falter, and A. Sizmann, in Proceedings of the 3rd CEAS Air&Space Conference and 21st 355 AIDAA Congress, Venice, Italy (2011) pp. 1249–1259. 356 [5] M. Efthymiou, E. T. Njoya, P. L. Lo, A. Papatheodorou, and D. Randall, Journal of Aerospace 357 Technology and Management 11 (2019).
14

358    [6] J. J. Rebollo and H. Balakrishnan, Transportation Research Part C: Emerging Technologies 44, 231
359        (2014).
360    [7] J. M. Rosenberger, A. J. Schaefer, D. Goldsman, E. L. Johnson, A. J. Kleywegt, and G. L. Nemhauser,
361        Transportation Science 36, 357 (2002).
362    [8] E. Mueller and G. Chatterji, in AIAA’s Aircraft Technology, Integration, and Operations (ATIO) 2002
363        Technical Forum (2002) p. 5866.
364    [9] G. Gui, F. Liu, J. Sun, J. Yang, Z. Zhou, and D. Zhao, IEEE Transactions on Vehicular Technology
365        69, 140 (2019).
366   [10] M. Z. Li and M. S. Ryerson, Journal of Air Transport Management 75, 111 (2019).
367   [11] C. Beck, E. G. D. Cohen, and H. L. Swinney, Physical Review E 72, 056133 (2005).
368   [12] K. Briggs and C. Beck, Physica A: Statistical Mechanics and its Applications 378, 498 (2007).
369   [13] B. Schäfer, C. Beck, K. Aihara, D. Witthaut, and M. Timme, Nature Energy 3, 119 (2018).
370   [14] G. Williams, B. Schäfer, and C. Beck, Physical Review Research 2, 013019 (2020).
371   [15] R. Metzler, The European Physical Journal Special Topics 229, 711 (2020).
372   [16] UK Civil Aviation Authority, “UK Airports - Annual Statements of Movements, Passengers and Cargo
373        -Table 09,” (2019), [Online; accessed 10-September-2020].
374   [17] Kalyeena Makortoff , “Heathrow cargo flights rise 500% as airport restyles itself as ‘vital airbridge’,”
375         (2020), [Online; accessed 19-August-2020].
376   [18] S. Nižetić, International Journal of Energy Research 44, 10953 (2020).
377   [19] C. Tsallis, Journal of Statistical Physics 52, 479 (1988).
378   [20] EUROCONTROL, “Delays – three questions and many answers,” (2018), [Online; accessed 10-
379        September-2020].
380   [21] C. Beck, Physical Review Letters 87, 180601 (2001).
381   [22] C. Beck and E. G. D. Cohen, Physica A: Statistical Mechanics and its Applications 322, 267 (2003).
382   [23] J. Weber, M. Reyers, C. Beck, M. Timme, J. G. Pinto, D. Witthaut, and B. Schäfer, Scientific Reports
383        9, 1 (2019).
384   [24] L. L. Chen and C. Beck, Physica A: Statistical Mechanics and its Applications 387, 3162 (2008).
385   [25] M. V. Caccavale, A. Iovanella, C. Lancia, G. Lulli, and B. Scoppola, Journal of Air Transport
386        Management 34, 116 (2014).
387   [26] A. M. Shrestha, U. B. Shrestha, R. Sharma, S. Bhattarai, H. N. T. Tran, and M. Rupakheti, Earth-
388        Arxiv (2020).
389   [27] B. Schäfer, R. Verma, A. Giri, H. He, S. Nagendra, M. Khare, and C. Beck, arXiv preprint
390        arXiv:2007.00755 (2020).
391   [28] C. Le Quéré, R. B. Jackson, M. W. Jones, A. J. Smith, S. Abernethy, R. M. Andrew, A. J. De-Gol,
392        D. R. Willis, Y. Shan, J. G. Canadell, et al., Nature Climate Change , 1 (2020).
393   [29] G. Rangarajan and M. Ding, eds., Processes with Long-Range Correlations: Theory and Applications,
394        Lecture Notes in Physics, Vol. 621 (Springer-Verlag, Berlin Heidelberg, 2003).
395   [30] J. Beran, Y. Feng, S. Ghosh, and R. Kulik, Long-Memory Processes: Probabilistic Properties and
396        Statistical Methods, berlin heidelberg ed. (Springer-Verlag, 2013).
Figures

Figure 1

Flight delays follow a broad distribution with large negative and positive delays. We display LHR delay
histograms prior to and during the COVID-19 pandemic, both normalized. As the COVID-19 LHR data set
is significantly smaller in size, compared to the regular LHR data set, it contains many gaps, where no
data were recorded. The COVID-19 data set is significantly shifted towards the left (smaller delays) as
compared to the pre-pandemic time.
Figure 2

Splitting the full distribution at the peak leads to two easier-to-fit flanks. Left: Negative delays decay
approximately linearly in the log-scale and thereby suggest an exponential fit (1) Right: Positive delays
display substantial heavy tails and thereby suggest the usage of a q-exponential function (2).

Figure 3

Exponential (green) and q-exponential (blue) theoretical distributions capture the empirical distribution.
The fits are obtained via the MLE method, see Methods for fitting details. To complement the over-
estimated “peak” (tent-like shape) we introduce the mean delay µ index.
Figure 4

International airlines appear to differ substantially in their three delay indices. We plot the leftside
(negative) delay exponential decay, right-side (positive) power-law delay decay and the mean delay.
Arrows indicate whether a small or large value is desirable.

Figure 5

Delay indices for low-cost airlines not covering long-distance flights. Wizz Air, easyjet, Ryanair and
Vueling share the largest λ index (early arrivals). Jet2 has the smallest mean delay µ and Vueling is
characterized by the smallest ν index (late arrivals).
Figure 6

Airports appear to differ substantially in the three delay metrics. Airports that serve mostly domestic and
European destinations, such as LTN and STN, behave differently from international airports such as LHR,
GAT and MAN.
Figure 7

We analyse the full time series of plane delays and extract a time window during which we observe
locally exponential distributions. These local distributions can decay slowly or fast, i.e. the rate λ is
fluctuating.
Figure 8

The average kurtosis ¯ κ of the data set is plotted as a function of the time window ∆τ in hours (blue).
The intersection between the horizontal line at ¯ κ = 9 (the kurtosis of an exponential distribution) and the
¯ κ vs ∆t curve gives the optimal value for ∆t; we find T ≈ 1.55 hours.

Figure 9
Applying superstatistics leads to consistent results. Left: We extract the distribution of local exponents
and compare them to a χ2 and inverse χ2 fit (based on the method of least squares). Right: Using the
previously derived χ2 distribution, we again derive a q-exponential with right exponent νχ2 ≈−5.296,
compared to the fitted one of νMLE ≈−5.371. Hence, while the low delays are not perfectly matched by the
χ2-based q-exponential, the tail behavior is decently captured.

Figure 10

Using the approximately Gaussian shape in the center, we smoothly combine left and right flank fits into
one coherent fit of the full delay data set. To emphasize the quality of the fit, we display both a linear
(left) and logarithmic (right) scale of the PDF for LHR.
You can also read