Prediction of dengue outbreak in Selangor Malaysia using machine learning techniques
←
→
Page content transcription
If your browser does not render page correctly, please read the page content below
www.nature.com/scientificreports
OPEN Prediction of dengue outbreak
in Selangor Malaysia using machine
learning techniques
Nurul Azam Mohd Salim1, Yap Bee Wah2, Caitlynn Reeves3, Madison Smith3,
Wan Fairos Wan Yaacob2, Rose Nani Mudin4, Rahmat Dapari4, Nik Nur Fatin Fatihah Sapri1 &
Ubydul Haque3*
Dengue fever is a mosquito-borne disease that affects nearly 3.9 billion people globally. Dengue
remains endemic in Malaysia since its outbreak in the 1980’s, with its highest concentration of cases
in the state of Selangor. Predictors of dengue fever outbreaks could provide timely information for
health officials to implement preventative actions. In this study, five districts in Selangor, Malaysia,
that demonstrated the highest incidence of dengue fever from 2013 to 2017 were evaluated for the
best machine learning model to predict Dengue outbreaks. Climate variables such as temperature,
wind speed, humidity and rainfall were used in each model. Based on results, the SVM (linear kernel)
exhibited the best prediction performance (Accuracy = 70%, Sensitivity = 14%, Specificity = 95%,
Precision = 56%). However, the sensitivity for SVM (linear) for the testing sample increased up to
63.54% compared to 14.4% for imbalanced data (original data). The week-of-the-year was the most
important predictor in the SVM model. This study exemplifies that machine learning has respectable
potential for the prediction of dengue outbreaks. Future research should consider boosting, or using,
nature inspired algorithms to develop a dengue prediction model.
Dengue fever is a re-emerging, mosquito-borne, viral disease with over 3.9 billion individuals at risk of infec-
tion worldwide1. The disease is endemic in 128 countries throughout South Asia, South-East Asia, Africa, the
Americas, the Western Pacific and Eastern Mediterranean r egions2–4.
Malaysia, a Southeast Asian country, has experienced cases of dengue since 1902. The disease became a public
health risk in the 1970’s, with its first major outbreak in 19735,6. The incidence of dengue fever has increased from
32 cases per 100,000 individuals in the year 2000 to 361 cases per 100,000 population in 2 0147. Most individuals
afflicted with dengue are between the ages of 15 and 49, and 80% of cases are within urban c ommunities7. Sel-
angor is a densely populated and urban state in Malaysia, containing 5.79 million of the country’s 31.53 million
inhabitants, and contributing to 90% of national dengue c ases7.
Based on the systematic review by Louis et al., risk mapping studies have mostly been descriptive, lacking
validation and predictive value. Hence, there is a need for additional tools, such as studying climate and mobility
data in dengue prediction. Climatic data and weather data were often used in the generation of predictive risk
maps and modeling dengue incidence8.
Researchers have found that the transmission of dengue fever is largely affected by inter-annual and seasonal
climate variability9–12. For example, the temperature factor has been found to be a significant climate variable in
contributing to the incidence of dengue fever. An environmental-controlled experiment discovered temperature
provides the optimal environment for survival of adult mosquitoes as well as for larva, pupal and egg (in aquatic
phase)13.
Malaysia continues to lack thorough comparisons of different predictive models and an identification of
an optimal model. Furthermore, this study seeks to identify spatiotemporal dengue hotspot areas in Selangor,
Malaysia, determine the association of climate variables with dengue fever outbreak, and evaluate machine
learning models for predicting dengue fever outbreaks.
1
Advanced Analytics Engineering Centre, Faculty of Computer and Mathematical Sciences, Universiti Teknologi
MARA, 40450 Shah Alam, Selangor, Malaysia. 2Faculty of Computer and Mathematical Sciences, Universiti
Teknologi MARA Cawangan Kelantan, Kampus Kota Bharu, Lembah Sirrh, 15050 Kota Bharu, Kelantan,
Malaysia. 3Department of Biostatistics and Epidemiology, University of North Texas Health Science Center, Fort
Worth, TX 76107, USA. 4Vector Borne Disease Sector, Disease Control Division, Ministry of Health Malaysia,
Level 4, Block E10, Complex E, Federal Government Administration Complex, 62590 Putrajaya, Malaysia. *email:
mdubydul.haque@unthsc.edu
Scientific Reports | (2021) 11:939 | https://doi.org/10.1038/s41598-020-79193-2 1
Vol.:(0123456789)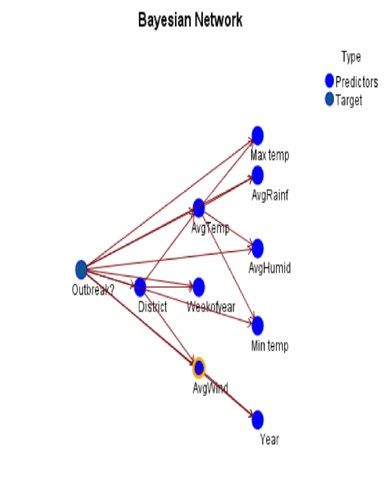
www.nature.com/scientificreports/
Material and methods
Source of data. The data contains 5 years (2013 to 2017) of weekly case numbers for five districts in Selan-
gor, Malaysia: Gombak, Hulu Selangor, Hulu Langat, Klang, and Petaling. After verification and validation by
the district health staff, all notified cases with clinical symptoms of dengue, and confirmed dengue laboratory
results (either NS1 positive, IgM positive and IgG positive results through rapid test kit, PCR confirmed, ELISA
serology confirmed, or virus isolation), are registered in eNotifikasi, a real-time surveillance system. Cases from
private clinics, public clinics, and hospitals are also reported to the Ministry of Health through eNotifikasi. Once
the case registered is in the eNotifikasi system, the dengue case information (e.g., name, identification card num-
ber, date of birth, address, age, date of onset, and date of notification) is transferred into the eDengueV2 system
(supplement text, Supplement Fig. 1). The information used in this study is extracted from the eDengueV2
system (More details are in supplement texts and Supplement Tables 1–7).
In Malaysia, annually less than 1% of cases were dengue hemorrhagic syndrome or dengue shock syndrome
(Source: Ministry of Health, Malaysia, unpublished report, personal communication Dr. Rose Nani). Based on
the new WHO classification of dengue, dengue hemorrhagic syndrome and dengue shock syndrome are classi-
fied as “severe” cases of dengue.
Climate data, such as humidity, rainfall, temperature and wind speed, was obtained from the Malaysian Mete-
orology Department. The description of the variables is shown in Tables 1 and 2 (Supplement). The ‘AvgRain’,
‘AvgTemp’, ‘Max Temp’, ‘Min Temp’, ‘AvgHumid’, and ‘AvgWind’ are continuous variables, whereas the ‘District’,
‘Year’ and ‘Weekofyear’ are categorical variables. The target variable is a binary variable termed ‘Outbreak’.
An outbreak is defined as the occurrence of a disease in higher frequency than expected in an area during a
specified period. According to the World Health Organization (WHO), the operational definition for an outbreak
of dengue fever in Malaysia is the reporting of more than two standard deviations of the 4-week-case-average
above the moving three 4-week-case-average of dengue c ases14.
Data cleaning. Data cleaning was carried out in Microsoft Excel. Missing values were detected in the data
during data cleaning, with 6% missing in Temperature, 7% missing in Humidity, 2% missing in Rainfall, and 4%
missing in Wind Speed. Missing values within the raw climate dataset were recorded differently by each station
and were corrected using data imputation. The Climatological Mean of the Day (CMD) method, viewing the
available data at hand, uses an average of the previous daily value on the same day. Calculation of the estimated
value (Vest) is as follow:
T
j=1 Vij
Vest =
T
where, Vi is the value of the variable for the ith day of year j and T is the number of available data for that year15.
For example, if rainfall data for Day 5 is missing, the average of all available rainfall data for day 5 of that specific
year is taken.
Creating the dengue outbreak variable. The target variable (dengue outbreak) indicates whether there
was a dengue outbreak in a particular week-of-the-year in each district. In establishing this target variable, the
WHO operational definition was adopted for dengue fever outbreak in Malaysia. The WHO defines a dengue
outbreak as a period of time in which a reported case of a week is more than the sum of the moving average of
three 4-week dengue cases plus the value of two standard deviations above the number of dengue cases for the
cases four weeks prior16. The dengue outbreak variable (1 = Dengue Outbreak, 0 = No dengue outbreak) was cre-
ated based on the original variable of reported number of dengue cases. Table 3 illustrates (supplement) the steps
used to calculate the target variable for the seventh week (Supplement). First, the average number of dengue
cases for four weeks prior is calculated. Second, the value for the two-standard deviations above the dengue case
number for the four weeks prior is calculated. Third, the moving average of three, 4-week dengue cases is cal-
culated. Fourth, the sum of moving average of the three, 4-week dengue cases plus the two standard deviations
of dengue cases for the cases four weeks prior is calculated (Step 3–Step 2). Finally, if the weekly cases are more
than the generated value in step 4, then an outbreak has likely occurred. In the seventh week, there are 69 cases
of dengue fever and the value generated in step 4 is 80.1. Because the number of cases is less than the calculated
number necessary for an outbreak, there appears to be no outbreak of dengue fever in the seventh week. Data
cleaning generated 1300 records for the binary “dengue outbreak” variable, and the climate variables for five
districts. There are 372 cases for Dengue Outbreak = Yes and 928 cases for Dengue Outbreak = No.
Model building. Predictive modeling was conducted using IBM SPSS Modeler 18. The cleaned dataset,
with 1300 records, was imported into the source node, which was subsequently connected to the data partition
node. The data (n = 1300) was partitioned into samples of 70% training and 30% testing. In developing predic-
tive model, this is the standard procedure. The predictive modelling was performed using several data mining
models, namely Decision Trees (CART), Artificial Neural Network (MLP), SVM (LINEAR, POLYNOMIAL,
RBF), and Bayes Network (TAN). The models were evaluated in the analysis node.
Effectiveness refers to the ability of the classifier to predict the dengue outbreak. A classifier is effective if it
has good classification performance, which is measured by accuracy, sensitivity, and precision. Sensitivity is the
percentage (or proportion) of dengue outbreaks (Yes) correctly classified by the model. Precision is the percentage
(or proportion) of dengue outbreak cases classified correctly as a dengue outbreak (Yes). Overfitting problems
occur when the testing values are much lower than the training values. This procedure also helps detect if there
is an overfitting problem where the model performs well in the training sample but not in the testing sample.
Scientific Reports | (2021) 11:939 | https://doi.org/10.1038/s41598-020-79193-2 2
Vol:.(1234567890)www.nature.com/scientificreports/
Figure 1. (A) Dengue fever outbreak in Selangor (study areas). ArcGIS 10.7 was used to create the map (https
://desktop.arcgis.com/en/), (B) Dengue fever outbreaks by district and year (blue is representing no and green is
representing yes).
CART, known as Classification and Regression Tree, is a decision tree model that uses Gini as a splitting
criterion for a categorical target variable. The Artificial Neural network (ANN) model is an Artificial Intelli-
gence model that consists of input layers, hidden layers, and output layers. The input layer data is connected to
the hidden layers which have hidden neurons. Activation functions, such as the sigmoid function, are used to
produce output values in the output layer. The ANN model allows modeling of a complex relationship between
the input and output variables. The SVM is a machine learning classification model based on decision bound-
ary and convex optimization problem, which can be solved using the Lagrange multiplier method. The linear
kernel is used if the decision boundary (separated between the two classes of the target variable) is linear. The
polynomial, sigmoid, and Gaussian Radial Basis kernel functions can be used when the decision boundary is
nonlinear. The Naïve Bayes model is based on the Bayes Theorem of calculating the posterior probability of the
event based on several attributes or independent v ariables17,18.
The models are similar in that they can obtain the probability for the binary target variable and identify the
important predictors. They differ, however, in their methods of obtaining the model. Logistic regression and
Naïve Bayes are both statistical methods, however the logistic regression model uses the Maximum Likelihood
method for parameter estimation and logistic function while the Naïve Bayes method uses Bayes’ Theorem to
calculate posterior probabilities. CART is a decision tree model that uses Gini as splitting criteria and provides
decision rules, such as information on the relationship between input and target variable. The Support Vector
Machine uses decision boundary and optimization theory to obtain the maximal linear and non-linear bounda-
ries for binary classification problems.
The dengue fever outbreak graph was created using Tableau, a data visualization software. ArcGIS 10.7 was
used for mapping.
Ethical approval. Ethical approval was obtained from the Medical Research and Ethics Committee (MREC),
Ministry of Health Malaysia (NMRR ID: NMRR-17-218-34011). The authors used de-identified delinked aggre-
gated data and the requirement for consent has been waived off by approval of the Ethics committee. All meth-
ods were performed in accordance with the relevant guidelines and regulations.
Results
Through analysis there were determined to be an increase in outbreaks in Gombak and Klang in 2017 (Table 4,
supplement). Klang recorded the highest number of outbreaks from 2013 to 2017 (Fig. 1A). Results show that
the Klang district had the highest number of dengue fever outbreaks, while Hulu Selangor had the least (Fig. 1B).
The visualization dashboard (Fig. 2, supplement) exhibits the district, as well as the week-of-year, in which the
outbreaks occurred. By selecting the filters on the right-side panel, viewers can compare dengue fever outbreaks
Scientific Reports | (2021) 11:939 | https://doi.org/10.1038/s41598-020-79193-2 3
Vol.:(0123456789)www.nature.com/scientificreports/
Figure 2. CART model.
by district, year and outbreak status. In 2016, dengue fever incidence was highest in weeks 8 and 9, while maxi-
mum temperature peaked around week 16 in the Petaling district (Fig. 2, supplement). The early period of heavy
rainfall in weeks 12 to 17 in Gombak is accompanied by more frequent outbreaks of dengue fever (indicated by
the red bars), however that pattern does not continue throughout the year (Fig. 3, supplement). Outbreaks of
dengue fever initially occurred in weeks 2, 6 and 7, with an increasing trend in wind speed in Hulu Langat fol-
lowed by a sudden drop in week 43. This subsequently occurred within several weeks in the middle of the year
and in the final quarter of 2015 (Fig. 4, supplement).
Data mining techniques analysis. Based on the CART decision rules, no outbreaks occurred in 2013
(Fig. 2) when weekly humidity was more than 83.8 g/kg. However, when humidity was less than 83.8 g/kg, and
rainfall was between 2.3 and 3.2 mm, outbreaks did occur. From 2014 to 2017, outbreaks occurred when humid-
ity was less than 68.7 g/kg and maximum temperature was more than 28.95 °C.
Predictor importance for the decision tree (CART) model shows that maximum temperature is the most
important variable for CART and ANN models, while Week of Year is the most important variable for SVM
models (Table 1).
The machine learning algorithms used the variance based method to calculate the predictor importance. First
the predictors are ranked according to the sensitivity measure using the following formula (IBM SPSS Modeler
Algorithms Guide, 2016):
Vi V (E(Y |XI ))
Si = =
V (Y ) V (Y )
where V(Y) is the unconditional output variance. Predictor importance is then computed as the normalized
sensitivity using the following formula:
Si
VI i = k
j=1 Sj
Scientific Reports | (2021) 11:939 | https://doi.org/10.1038/s41598-020-79193-2 4
Vol:.(1234567890)www.nature.com/scientificreports/
Artificial neural
Decision tree network SVM (linear) SVM (polynomial) SVM (RBF) Naive Bayes
Week of year 0.13 0.22 0.50 0.20 0.73 0.10
Average temperature 0.70 0.19 0.06 0.04 0.03 0.13
Average humidity 0.22 0.07 0.06 0.03 0.01 0.11
Average wind 0.70 0.05 0.06 0.02 0.01 0.11
Maximum temperature 0.14 0.22 0.06 0.04 0.02 0.10
Minimum temperature 0.70 0.05 0.06 0.01 0.01 0.11
Average rainfall 0.10 0.07 0.06 0.03 0.01 0.11
Year 0.11 0.08 0.06 0.15 0.11 0.11
District 0.70 0.06 0.06 0.60 0.07 0.13
Table 1. Predictor importance of the models.
Accuracy (%) Specificity (%) Sensitivity (%) Precision (%)
Sample Original Balanced Original Balanced Original Balanced Original Balanced
Training 78.77 64.95 96.14 51.81 33.20 76.81 76.64 63.86
CART
Testing 63.21 50.23 86.07 37.19 12.00 66.67 27.78 45.71
Training 75.31 68.38 96.76 63.45 19.03 72.83 69.12 68.84
SVM (LINEAR)
Testing 70.12 57.14 95.00 52.07 14.40 63.54 56.25 51.26
Training 100 100 100 100 100 100 100 100
SVM (POLYNOMIAL)
Testing 65.43 53.76 77.86 48.76 37.60 64.58 43.12 50.00
Training 86.82 86.10 94.44 84.34 66.80 87.68 82.09 86.12
SVM (RBF)
Testing 65.93 59.45 80.00 57.85 34.40 61.46 43.43 53.64
Training 82.94 82.10 92.74 78.31 57.33 85.51 75.14 81.38
Naïve Bayes (TAN)
Testing 61.50 54.19 76.26 51.00 27.43 58.23 33.33 48.42
Training 73.87 97.90 78.63 97.99 18.10 97.83 59. 15 98.18
ANN (MLP)
Testing 66.14 55.30 95.21 54.55 13.68 56.25 37.21 49.54
Table 2. Model evaluation (performance comparison) results-original and balanced data. a = Original data
(Yes: 372(28.62%), No = 928(71.38%), b = Balanced Data (Yes = 372(50.1%), No = 370 (49.9%)).
Support vector machine (SVM). All three SVM models (linear, polynomial and RBF) selected “week-of-
year” as the most important predictor (Table 1). The results in Table 2 demonstrate that the Linear SVM model
performed better than both the polynomial (degree = 2) and RBF kernels (Table 2). The SVM Polynomial and
RBF models exhibit overfitting, as the accuracy, specificity and sensitivity results are very high for the training
sample and low for testing sample. Overfitting occurs when a model classification performance is good for
the training sample, but performs badly in the testing sample. The SVM Linear is chosen to be compared with
CART, ANN and Naïve Bayes model.
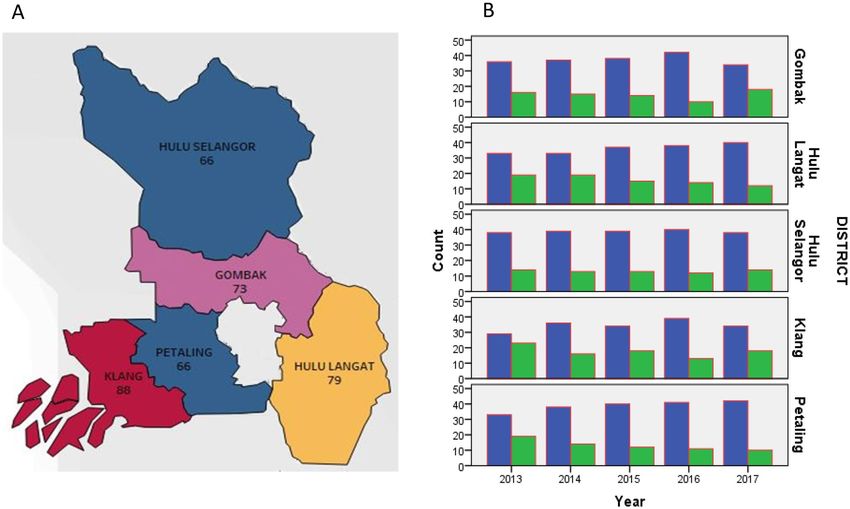
Naïve Bayes. A Naïve Bayes prediction model was developed using Tree Augmented Naïve Bayes (TAN)
structure. The model structure is depicted in Fig. 3. Using the model, suppose the necessity to classify case X
(Gombak, 2014, wind speed = 2 m/s). Based on the conditional probability given in Fig. 3, the probability of an
outbreak versus no outbreak occurring in Gombak in 2014, with a wind speed of 2 m/s, can be obtained as fol-
lows:
P (outbreak = Yes |Gombak, wind speed = 2, year = 2014) = 0.20 × 0.68 × 0.21 = 0.029.
P (outbreak = No |Gombak, wind speed = 2, year = 2014) = 0.21 × 0.64 × 0.20 = 0.027.
The probability of an outbreak to occur in Gombak in 2014, with a wind speed of 2 m/s, is higher (probabil-
ity = 0.029) than the probability of an outbreak not occurring (probability = 0.027). Furthermore, case X would
be classified (Gombak, 2014, wind speed = 2 m/s) as an Outbreak = Yes.
Model evaluation. The models were evaluated based on classification accuracy, sensitivity, specificity, and
precision. Based on the results presented (Tables 1 and 2), and the ROC curve (Fig. 5, supplement), overfitting
occurs. Results in Table 2 shows that overfitting problems exists for the CART, SVM (Polynomial), SVM (RBF),
Naïve Bayes and ANN models, as the models performed well in the training sample but not for the testing sample.
Only the SVM Linear model performance was consistent for both training and testing samples. Based on testing
sample results, the SVM Linear model (Accuracy = 70%, Sensitivity = 14%, Specificity = 95%, Precision = 56%)
performed better than CART (Accuracy = 63%, Sensitivity = 12%, Specificity = 86%, Precision = 28%), Tree Aug-
Scientific Reports | (2021) 11:939 | https://doi.org/10.1038/s41598-020-79193-2 5
Vol.:(0123456789)www.nature.com/scientificreports/
Conditional Probabilities of District
Parents Probability
Outbreak Gom Hula Huse Kla Pet
Yes 0.20 0.20 0.19 0.23 0.17
No 0.21 0.21 0.20 0.18 0.21
Conditional Probabilities of AvgWind
Parents Probability
District Outbreak? 10.51
Gom Yes 0.68 0.32 0.00 0.00
Conditional Probabilities of Year
Gom No 0.64 0.36 0.01 0.00
Parents Probability
Hula Yes 0.57 0.33 0.10 0.00
AvgWind Outbreak? 2013 2014 2015 2016 2017
Hula No 0.64 0.22 0.12 0.02www.nature.com/scientificreports/
dashboard. This is likely due to a lag effect, in which climate factors that impact both the mosquito lifecycle
and viral replication take some time to ultimately impact vector-host interactions and infection r ates40. Other
works have found that increased temperature is positively correlated with dengue fever outbreaks with a lag of
0 to 3 weeks40. Population density and urbanization are also influential risk factor for the resurgence of dengue
as reported by Struchiner et al.41.
Given the complexities of climate impact on host–vector–virus interactions, it is not surprising that the SVM
model selected week-of-the-year as the most important predictor of dengue fever outbreaks. It could be that
the humidity, wind speed, rainfall and temperature conditions that most favor viral replication in the vector as
well as host–vector interactions occur around the same week each year. Week-of-the-year is also the most useful
predictor of dengue outbreaks, as it contains interactions between the climate variables. For instance, the impact
of humidity on dengue outbreaks may be dependent on temperature and/ or rainfall. This relationship could be
captured more succinctly with the week-of-the-year variable rather than with complex ranges and combinations
of climate variables. In this way, using week-of-the-year may help to simplify dengue early warning models at
local scales and in locations with consistent seasonal climate conditions. Based on the CART model, patterns of
dengue outbreak in 2013 were different from 2014 to 2017. In 2013, the dengue outbreak occurred in week 20,
28, 32, 22, 39, 40, and 51. Meanwhile, for 2014–2017, dengue outbreaks occurred in week 9, 26, 29, 30 and 39.
This study has several limitations, one of them being missing data. However, because no more than 15% of
ndings42. Additionally, the low sensitivity is due to
data was imputed, it is unlikely that missing data impacted fi
the imbalanced data in the target variable (Outbreak: Yes = 29%, No = 71%). Predictive modeling using a balanced
sample improves the sensitivity of the models. All models still shows overfitting except for SVM (linear). Future
studies can experiment with boosting algorithms or natured inspired algorithms (Particle Swarm Optimization or
Grey Wolf) to increase the sensitivity of the model. The WHO outbreak definition specific to Malaysia was used,
as Malaysia is a country in which dengue is an endemic disease. The study findings may not be generalizable to
other countries due to meteorological elements. SVM cannot control the interactions between variables. Future
work should include further investigation of SVM as an outbreak prediction tool as well as week-of-the-year as
an important predictor of dengue outbreaks at different spatial scales as well as in different types of models. This
method can be applied to predict other outbreaks of vector-borne diseases such as Chikungunya and Zika43,44.
Conclusion
Machine Learning models are useful for classification and prediction of dengue fever outbreaks. This study
created a new binary variable, dengue fever outbreak based on weekly dengue incidence data for Selangor and
evaluated the performance of CART, ANN, SVM and Naïve Bayes model in the prediction of dengue outbreaks
based on climate variables. The application of the machine learning models for prediction of dengue outbreak
can provide vital information to healthcare authorities so that they can better prepare for dengue fever out-
breaks. Examination of the week-of-the-year as the most important predictor of dengue outbreaks may simplify
modelling and prevention efforts at local levels. Machine learning model has great potential for applications in
epidemiology and disease outbreak studies.
Data availability
Data supporting the conclusions of this manuscript are provided within the article and will be available from
the corresponding author upon request.
Received: 30 November 2019; Accepted: 17 November 2020
References
1. Shepard, D. S., Undurraga, E. A. & Halasa, Y. A. Economic and disease burden of dengue in Southeast Asia. PLoS Negl. Trop. Dis.
7, e2055. https://doi.org/10.1371/journal.pntd.0002055 (2013).
2. Gibbons, R. V. Dengue: an escalating problem. BMJ 324, 1563–1566. https://doi.org/10.1136/bmj.324.7353.1563 (2002).
3. Usman, A. et al. Dengue fever outbreaks in Eritrea, 2005–2015: A case for strengthening surveillance, control and reporting. Glob.
Health Res. Policy 1, 17. https://doi.org/10.1186/s41256-016-0016-5 (2016).
4. Schmidt, W. P. et al. Population density, water supply, and the risk of dengue fever in Vietnam: Cohort study and spatial analysis.
PLoS Med. 8, e1001082. https://doi.org/10.1371/journal.pmed.1001082 (2011).
5. Cheah, W. K., Ng, K. S., Marzilawati, A. R. & Lum, L. C. A review of dengue research in malaysia. Med. J. Malaysia 69(Suppl A),
59–67 (2014).
6. Mohd-Zaki, A. H., Brett, J., Ismail, E. & L’Azou, M. Epidemiology of dengue disease in Malaysia (2000–2012): A systematic literature
review. PLoS Negl. Trop. Dis. 8, e3159. https://doi.org/10.1371/journal.pntd.0003159 (2014).
7. Malaysia, M. O. H. (ed Ministry of Health Technology Assesment Section) (Clinical Practice Guidelines, 2015).
8. Louis, V. R. et al. Modeling tools for dengue risk mapping: A systematic review. Int. J. Health Geogr. 13, 50. https://doi.
org/10.1186/1476-072X-13-50 (2014).
9. Cazelles, B., Chavez, M., McMichael, A. J. & Hales, S. Nonstationary influence of El Nino on the synchronous dengue epidemics
in Thailand. PLoS Med. 2, e106. https://doi.org/10.1371/journal.pmed.0020106 (2005).
10. Dhiman, R. C., Pahwa, S., Dhillon, G. P. & Dash, A. P. Climate change and threat of vector-borne diseases in India: Are we pre-
pared?. Parasitol. Res. 106, 763–773. https://doi.org/10.1007/s00436-010-1767-4 (2010).
11. Hii, Y. L. et al. Climate variability and increase in intensity and magnitude of dengue incidence in Singapore. Glob. Health Action
https://doi.org/10.3402/gha.v2i0.2036 (2009).
12. Rosa-Freitas, M. G., Schreiber, K. V., Tsouris, P., Weimann, E. T. & Luitgards-Moura, J. F. Associations between dengue and com-
binations of weather factors in a city in the Brazilian Amazon. Rev. Panam Salud Publica 20, 256–267. https://doi.org/10.1590/
s1020-49892006000900006 (2006).
13. Yang, H. M., Macoris, M. L., Galvani, K. C., Andrighetti, M. T. & Wanderley, D. M. Assessing the effects of temperature on the
population of Aedes aegypti, the vector of dengue. Epidemiol. Infect. 137, 1188–1202. https://doi.org/10.1017/S09502688090020
40 (2009).
Scientific Reports | (2021) 11:939 | https://doi.org/10.1038/s41598-020-79193-2 7
Vol.:(0123456789)www.nature.com/scientificreports/
14. Organization, W. H. 1–92 (WHO Library Cataloguing-in-Publication, Geneva Switzerland, 2016).
15. Narapusetty, B., Delsole, T. & Tippett, M. K. Optimal estimation of the climatological. Mean. 22, 4845–4859. https://doi.
org/10.1175/2009jcli2944.1 (2009).
16. World Health Organisation. Technical handbook for dengue surveillance, dengue outbreak prediction/detection and outbreak
response (“model contingency plan”). WHO Library Cataloguing-in-Publication Data, 1–92. http://www.who.int/tdr/news/2016/
handbook-dengue-outbreak/en/. Accessed 28 May 2020.
17. Tan, P.N., Steinbach, M., Kumar, V. (2005). Introduction to Data Mining. Addison Wesley. 2000 ISBN: 0321321367.
18. Wendler, T. & Grottrup, S. Data Mining Using SPSS Modeler: Theory, Exercises and 203 Solutions (Springer, New York, 2016).
19. Tyagi, S., & Mittal, S. Sampling approaches for imbalanced data classification problem in machine learning. in Proceedings of
ICRIC 2019. Lecture Notes in Electrical Engineering, vol. 597, 209–221 (Cham: Springer, 2020).
20. Ching Ho, C., Ting, C.-Y. & Baha Raja, D. Using public open data to predict dengue epidemic: assessment of weather variability,
population density, and land use as predictor variables for dengue outbreak prediction using support vector machine. Indian J.
Sci. Technol. 11, 1–8. https://doi.org/10.17485/ijst/2018/v11i4/115405 (2018).
21. Guo, P. et al. Developing a dengue forecast model using machine learning: A case study in China. PLOS Negl. Trop. Dis. 11,
e0005973. https://doi.org/10.1371/journal.pntd.0005973 (2017).
22. Laureano-Rosario, A. et al. Application of artificial neural networks for dengue fever outbreak predictions in the Northwest Coast
of Yucatan, Mexico and San Juan, Puerto Rico. Trop. Med. Infect. Dis. 3, 5. https://doi.org/10.3390/tropicalmed3010005 (2018).
23. Althouse, B. M., Ng, Y. Y. & Cummings, D. A. Prediction of dengue incidence using search query surveillance. PLoS Negl. Trop.
Dis. 5, e1258. https://doi.org/10.1371/journal.pntd.0001258 (2011).
24. Shi, Y. et al. Three-month real-time dengue forecast models: An early warning system for outbreak alerts and policy decision
support in Singapore. Environ. Health Perspect. 124, 1369–1375. https://doi.org/10.1289/ehp.1509981 (2016).
25. Anno, S. et al. Spatiotemporal dengue fever hotspots associated with climatic factors in Taiwan including outbreak predictions
based on machine-learning. Geospat. Health. https://doi.org/10.4081/gh.2019.771 (2019).
26. Macedo Hair, G., Fonseca Nobre, F. & Brasil, P. Characterization of clinical patterns of dengue patients using an unsupervised
machine learning approach. BMC Infect. Dis 19, 649. https://doi.org/10.1186/s12879-019-4282-y (2019).
27. Chen, S., Ding, C. H. Q. & Luo, B. Linear regression based projections for dimensionality reduction. Inf. Sci. 467, 74–86 (2018).
28. Tuladhar, R. et al. Effect of meteorological factors on the seasonal prevalence of dengue vectors in upland hilly and lowland Terai
regions of Nepal. Parasit. Vectors 12, 42. https://doi.org/10.1186/s13071-019-3304-3 (2019).
29. Liu, D. et al. A dengue fever predicting model based on Baidu search index data and climate data in South China. PLoS ONE 14,
e0226841. https://doi.org/10.1371/journal.pone.0226841 (2019).
30. Nayak, M. S. D. P. & Narayan, K. A. Forecasting dengue fever incidence using ARIMA analysis. Int. J. Collaborat. Res. Intern. Med.
11, 1–3 (2019).
31. Carvajal, T. M. et al. Machine learning methods reveal the temporal pattern of dengue incidence using meteorological factors in
metropolitan Manila, Philippines. BMC Infect. Dis 18, 183. https://doi.org/10.1186/s12879-018-3066-0 (2018).
32. Shaukat Dar, K. & Ulya Azmeen, S. M. Dengue fever prediction: a data mining problem. J. Data Min. Genom. Proteom. 06, 03
(2015).
33. Husam, I. S. et al. Feature selection algorithms for malaysian dengue outbreak detection model. Sains Malaysiana 46(2), 255–265
(2017).
34. Wu, P.-C., Guo, H.-R., Lung, S.-C., Lin, C.-Y. & Su, H.-J. Weather as an effective predictor for occurrence of dengue fever in Taiwan.
Acta Trop. 103, 50–57. https://doi.org/10.1016/j.actatropica.2007.05.014 (2007).
35. Gubler, D. J. et al. Climate variability and change in the United States: Potential impacts on vector- and rodent-borne diseases.
Environ. Health Perspect. 109, 223–233. https://doi.org/10.1289/ehp.109-1240669 (2001).
36. Shaman, J. & Day, J. F. Reproductive phase locking of mosquito populations in response to rainfall frequency. PLoS ONE 2, e331.
https://doi.org/10.1371/journal.pone.0000331 (2007).
37. Lubinda, J. et al. Environmental suitability for Aedes aegypti and Aedes albopictus and the spatial distribution of major arboviral
infections in Mexico. Parasite Epidemiol. Control 6, e00116. https://doi.org/10.1016/j.parepi.2019.e00116 (2019).
38. Phanitchat, T. et al. Spatial and temporal patterns of dengue incidence in northeastern Thailand 2006–2016. BMC Infect. Dis. 19,
743. https://doi.org/10.1186/s12879-019-4379-3 (2019).
39. Grimstad, P. R. & DeFoliart, G. R. Mosquito nectar feeding in Wisconsin in relation to twilight and microclimate1. J. Med. Entomol.
11, 691–698. https://doi.org/10.1093/jmedent/11.6.691 (1975).
40. Cheong, Y., Burkart, K., Leitão, P. & Lakes, T. Assessing weather effects on dengue disease in Malaysia. Int. J. Environ. Res. Public
Health 10, 6319–6334. https://doi.org/10.3390/ijerph10126319 (2013).
41. Struchiner, C. J., Rocklov, J., Wilder-Smith, A. & Massad, E. Increasing dengue incidence in Singapore over the past 40 years:
Population growth, climate and mobility. PLoS ONE 10, e0136286. https://doi.org/10.1371/journal.pone.0136286 (2015).
42. Acuña, E. & Rodriguez, C. in Classification, Clustering, and Data Mining Applications. (eds D. Banks, F. R. McMorris, P. Arabie, &
W. Gaul) 639–647 (Springer, Berlin Heidelberg).
43. Haque, U., Ball, J. D., Zhang, W., Khan, M. M. H. & Trevino, C. J. Clinical and spatial features of Zika virus in Mexico. Acta Trop.
162, 5–10. https://doi.org/10.1016/j.actatropica.2016.06.010 (2016).
44. Kabir, I., Dhimal, M., Muller, R., Banik, S. & Haque, U. The 2017 Dhaka chikungunya outbreak. Lancet Infect. Dis. 17, 1118. https
://doi.org/10.1016/S1473-3099(17)30564-9 (2017).
Acknowledgements
The authors would like to thank Universiti Teknologi MARA (UiTM) and Ministry of Higher Education Malaysia
for the funding of this research under the FRGS Grant (FRGS/1/2016/STG06/UITM02/2). UH was supported
by the Research Council of Norway (Grant # 281077).
Author contributions
N.A.M.S. and Y.B.W. analyzed the data and drafted the manuscript. Ubydul Haque and Caitlynn Reeves gave
critical input, edited, and rewrote the manuscript. W.F.W.Y. contributed to the interpretation of the results.
W.F.W.Y. and N.N.F.F.S. also contributed to data collection, preparation and obtaining Medical Research and
Ethics Committee (MREC) approval (NMRR ID: NMRR-17-218-34011). R.N.M. and R.D. were involved in
providing and explaining the dengue data collection process. MS revised the final draft.
Competing interests
The authors declare no competing interests.
Scientific Reports | (2021) 11:939 | https://doi.org/10.1038/s41598-020-79193-2 8
Vol:.(1234567890)www.nature.com/scientificreports/
Additional information
Supplementary Information The online version contains supplementary material available at https://doi.
org/10.1038/s41598-020-79193-2.
Correspondence and requests for materials should be addressed to U.H.
Reprints and permissions information is available at www.nature.com/reprints.
Publisher’s note Springer Nature remains neutral with regard to jurisdictional claims in published maps and
institutional affiliations.
Open Access This article is licensed under a Creative Commons Attribution 4.0 International
License, which permits use, sharing, adaptation, distribution and reproduction in any medium or
format, as long as you give appropriate credit to the original author(s) and the source, provide a link to the
Creative Commons licence, and indicate if changes were made. The images or other third party material in this
article are included in the article’s Creative Commons licence, unless indicated otherwise in a credit line to the
material. If material is not included in the article’s Creative Commons licence and your intended use is not
permitted by statutory regulation or exceeds the permitted use, you will need to obtain permission directly from
the copyright holder. To view a copy of this licence, visit http://creativecommons.org/licenses/by/4.0/.
© The Author(s) 2021
Scientific Reports | (2021) 11:939 | https://doi.org/10.1038/s41598-020-79193-2 9
Vol.:(0123456789)You can also read