Mobility as a Service: An Exploratory Study of Consumer Mobility Behaviour - MDPI
←
→
Page content transcription
If your browser does not render page correctly, please read the page content below
sustainability

Article
Mobility as a Service: An Exploratory Study of
Consumer Mobility Behaviour
Lapo Mola 1,2, *, Quentin Berger 2 , Karoliina Haavisto 2 and Isabella Soscia 2
 1    Department of Busines Administration, University of Verona, via Cantarane 24, 37129 Verona, Italy
 2    SKEMA Business School, Université Cote Azure (GREDEG), 60 Rue Fedor Dostoïevski,
      Sophia Antipolis Campus, 06902 Valbonne, France; quentin.berger@skema.edu (Q.B.);
      karoliinahelenaelisabeth.haavisto@skema.edu (K.H.); isabella.soscia@skema.edu (I.S.)
 *    Correspondence: lapo.mola@univr.it

 Received: 30 June 2020; Accepted: 24 September 2020; Published: 5 October 2020

 Abstract: Key challenges in transportation need to be addressed to tackle the problems of fossil
 fuel emissions and worsened air quality in urban area. The development of a more efficient and
 clean transport system could benefit from mobility as a service (MaaS). The present paper aims
 to understand the determinants of the intention to adopt such a service. We test the Technology
 Acceptance Model (TAM) on mobility behavior and intention to adopt mobility as a service, and we
 analyze the role of perceived cost saving as a determinant for the perceived ease of use. Data were
 collected through a survey on a sample of 201 potential adopters. The findings show that for such a
 technology, perceived usefulness fully mediate the influence of perceived ese of use on the intention
 to adopt. Moreover, the effect of perceived cost saving on perceived ease of use is moderated by the
 life cycle of the technology. Implications for marketing managers and policy makers are discussed.

 Keywords: mobility as a service; technology acceptance model; mobility behaviour; mobile services;
 technology adoption

1. Introduction
      The way of living is changing worldwide and based on the current estimates, the number of people
living in urban areas will increase by 2.5 billion inhabitants (around 70%) by 2050 [1]. The massive
urbanization will cause further problems with traffic bottlenecks, fossil fuel emissions and worsened
air quality. Therefore, the key challenges in transportation need to be addressed in order to tackle the
problems and develop a more efficient and clean transport system in urban areas [2]. In fact, the change
is already in progress, but it sets prerequisites for various parties to succeed in the shift towards a more
sustainable mobility [3–5].
      People are still using cars as their main means of transport, even though privately-owned
cars are mostly idle during their lifetime. In the last years, new technological solutions have been
introduced to solve the growing mobility needs in a more sustainable manner [3]. From the business
perspective, the automotive industry realized that disruptive trends would have a great impact on
their traditional business model due to the more constraining environmental regulations, new mobility
trends and technical innovations [6,7]. Consequently, the players of the industry presented electric and
autonomous cars as an option to meet the consumer’s changed preferences and needs. [8] and mobility
applications based on the concept “as a service” [6,9]. These disrupted the traditional value chains
such as Uber and Lyft with access to real-time data and integrated means of transport. [10,11].
      Mobility as a Service (MaaS) is an emerging and evolving phenomenon, an example of
technology-driven innovation that allows users to plan their trip and travel through the integration
of different mobility mode offered by different service providers, using a single interface IT based.

Sustainability 2020, 12, 8210; doi:10.3390/su12198210                        www.mdpi.com/journal/sustainability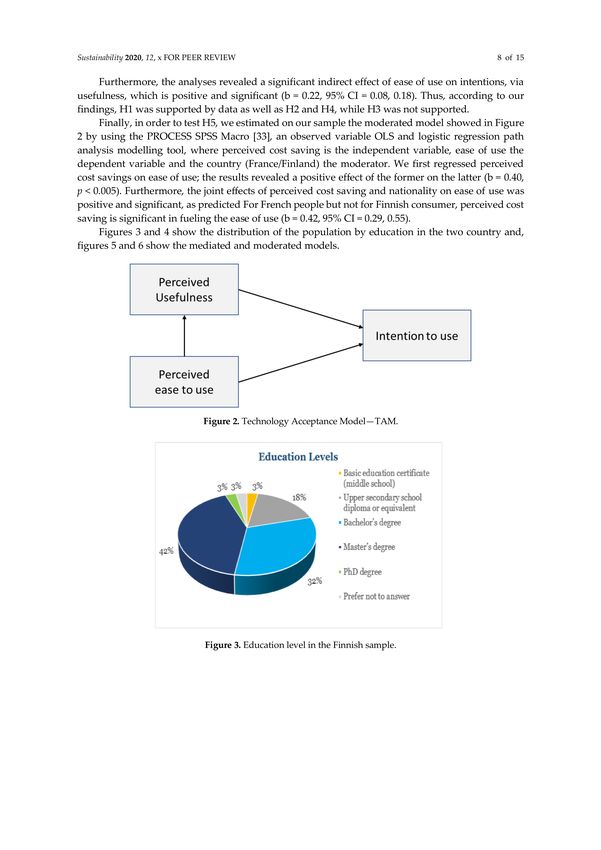
Sustainability 2020, 12, 8210                                                                      2 of 14

In this way, simplifying the journey planning and ticket purchase processes among other things [3].
MaaS is an example of technology-driven innovation, which will set the foundation for future vision of
mobility and “move us toward a more user-centered mobility paradigm” [3], (p. 114).
      Despite the current newsfeeds about Mobility as a Service, the concept is still rather novel and
unexplored as a research subject, particularly, behavioral studies about people’s mobility behavior.
      In order to fil this gap we conducted a study in two distinct European countries at different
stages in the current mobility revolution: Finland and France. The first one is a pioneer while the
second one is a follower moving towards a more sustainable mobility future. Since 2014, Mobility
as a Service has been a trendy research and news topic in Finland, but not so much in the French
market. Consequently, we were confident that a quantitative study would give us insight into both
population’s daily commuting habits and to their attitudes towards changing mobility behavior.
      We aimed at determining which elements affect the user’s decision to start using a mobility
application. The paper covers a time period of 3 months during the summer 2019, when the data
collection took place between different demographic groups (i.e., different aged people living either in
urban, suburban or rural areas).
      The purpose of our study is to get an understanding of what drives the user’s perceived usefulness
and intent to use a MaaS.
      More precisely, the aim of our research paper is to predict user’s adoption or rejection of a MaaS
service through the application of technology acceptance model (TAM), thus empirically examine how
its elements capacity to predict and explain consumers’ intentions. Therefore, we will focus on the
relationship between perceived ease of use (PEU), perceived usefulness (PU) and intention to use (IU)
in the context of Maas. We also explore the role of a possible determinant of ease of use—such as the
perceived cost saving—in the context of Maas. Finally wi will verify under which conditions perceived
cost saving is able to determine ease of use. With this regard, we suggest that the stage in the current
mobility revolution moderates the relationship between perceived cost saving and ease of use.

2. Theoretical Background
       Mobility as a Service—MaaS—is going to change the automotive industry (Smith et al. 2020). In the
last five years the digital transformation has affected the automotive industry and the transportation
sector moving automotive firms’ goal from selling cars to provide mobility service such as drivenow by
BMW or free2move by PSA group. This trend can be studied under the umbrella of servitization [12],
i.e., the “innovation of an organization’s capabilities and processes to shift from selling products to
selling integrated products and services that deliver value in use” [13]: (p. 548).
       According to Baines and Lightfoot there are six distinct technologies and practices that enable
the servitization process: facilities and their location, micro-vertical integration and supplier
relationships, information and communication technologies (ICTs), performance measurement and
value demonstration, people deployment and their skills, and business processes and customer
relationships [14].
       Despite the relevance of the digitization of mobility, only in the last 2 years the topic has been
studied systematically [15]. Moreover, as per any major technology-driven innovation, the success
depends on the acceptance of the new technology by the users. In order to understand this new
phenomenon and its acceptability by potential users, we adopted the technology acceptance model
(TAM) in order to predict and explain a user’s adoption or rejection of a MaaS service.

2.1. Mobility as a Service—MaaS
     Boosted by global trends such as digitization and servitization, the notion of MaaS has rapidly
gained popularity. Several pilot demonstrations of MaaS and MaaS-related services have been
performed, like, among others, UbiGo in Sweden, SMILE in Austria, Switch in Germany, and Whim in
Finland [10].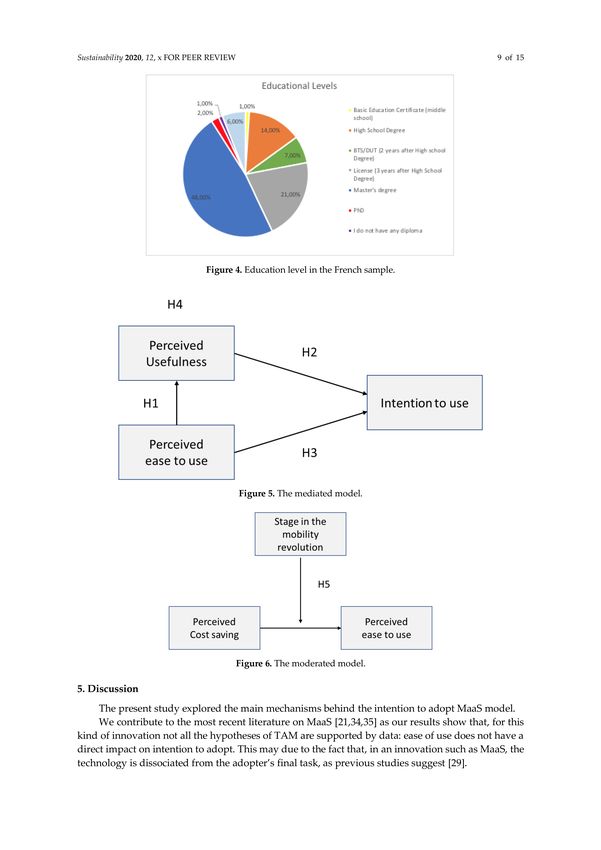
Sustainability 2020, 12, 8210                                                                         3 of 14

     Mobility-as-a-Service (MaaS) can defined as the set of mobility services that aim to provide
consumers with integrated, flexible, efficient, and user-oriented mobility. “It implies a shift away from
the personal ownership of individual motorized transportation modes, and non-integrated means of
transportation towards the use of integrated multimodal mobility solutions consumed as services.
This shift is enabled by combining transportation services from public- and private-transportation
providers through an “integrated mobility platform” that creates and manages the journey and
integrates planning and payment (based on mobility packages tailored to the needs of each customer
segment) on a one-stop-shop principle.” [16], (p. 61).
     According to the above definition, transportation services will become integrated platform of
a new forms of transportation (e.g., car- and bike-sharing) will be offered to deliver smooth and
optimized mobility for the end-users [17]. The term “as a service” means that an integrator accumulates
offers from numerous transport service providers and a MaaS provider offers them to the users through
a single interface on the web or mobile devices creating a mobility platform [18].
     Mobility as a Service combines the sharing economy and personalization of services like
car-sharing [19].
     The core of Mobility as a Service is the mobile application platform that integrates various
transport service providers, offering the possibility to users to plan their journeys and purchase tickets
through one single app [18]. There are four levels of MaaS integration:
•     The first level refers to the planning of the journey only (i.e., Google Maps). In this level the user
      access to the different options and solutions to manage the journey.
•     The second level refers to the planning of a journey and the ticketing. (i.e., Uber). The user can
      book the car, taxi, bus etc., with related tickets and reservations.
•     The third level, the highest one reached today (by Whim and UbiGo), gathers all kind of
      transportation within one mobile app only. The payment can be done whether as you go or in an
      all-inclusive plan.
•     The fourth level includes the three first levels plus an ultimate goal: incentives [20]. According to
      the history of the user the platform can provide tailor made offers in order to optimize both the
      resources of the platform and the users’ mobility needs and costs.

2.2. Technology Acceptance Model (TAM) for MaaS
      The use of MaaS requires an integrated mobile application that manages all the steps of a travel
(from the type of mobility mean to the itinerary, timing, price etc.). Thus, MaaS can be regarded
as a new digital product [21], where the information technology (IT) represents the core element,
suggesting the Technology Acceptance Model (TAM; Davis, 1989) as an appropriate initial framework
for the present research aim, which is a well-established framework for explaining the adoption of new
technologies, products and services.
      Even if TAM was initially developed to understand the acceptance of information technology—such
as personal computers—by users within the organization, the model has been successfully adjuster
to different contexts. From the acceptance to bike sharing application (Chen, 2016) to mobility as a
service [21], TAM central constructs have demonstrated to be an useful base to understand the attitude
and the motivation of users for accepting this type of new technology-based innovations.
      Following the classic economic view and transaction cost theory [22], the TAM is built on the core
idea that adoption depends on the ‘value’ of new products and services for the user, while transaction
cost theory also focusses on costs (e.g., price, risks associated with the product usage) and the resulting
‘net-value [21].
      The technology acceptance model aims to predict and explain user behavior of technology
acceptance [23]. The model consists of three core constructs: perceived ease of use (PEU), perceived
usefulness (PU) and intention to use (IU), which are connected with each other via causal relationships.
      According to TAM, Perceived usefulness (PU) is “the degree to which a person believes that using
a particular system would enhance his or her job performance” [23], (p. 320) and Perceived Easy to
Sustainability 2020, 12, 8210 4 of 14
Use (PEU) is “the degree to which a person believes that using a particular system would be free of
effort” [23], (p. 320).
Perceived usefulness and perceived ease of use have been identified as the most influential
predictors of adoption in the Information Systems literature [24]. Venkatesh and Davis (2000) [24] and
Venkatesh et al. (2003) [25] show a direct relationship between perceived ease of use and intention to
use. This causal link is also tested and proven in more recent application of TAM to adoption of new
technologies [26,27]. Moreover, perceived ease of use is also able to indirectly affect intention to use
through perceived usefulness [27].
The model uses a rating scale comprising of multiple items, where each statement is evaluated
to measure the reliability of the core constructs PEU, PU and IU. Davis & Venkatesh (1996) [23] state
that “the Cronbach alpha reliability of the TAM scales has generally been found to exceed 0.9 across
numerous studies” [23]. Theoretical and empirical support has led to the acceptance of using TAM
models for research purposes [23]. According to extant research, the model has proven to explain “a
substantial proportion of the variance (typically about 40%) in usage intentions and behavior” [24],
(p. 186) and that PU is a determining factor on intention to use [24].
As mentioned before few previous studies [21,28] have used TAM demonstrating the ability of
this model to support generalization in emerging contexts.
The generalization to this new context is relevant, due to the specificity of the technology analyzed
for which IT ease-of-use is not an inherent quality of the purchased product [29]. In line with Gefen
and Straub (2000) findings, for a service such as MaaS where IT itself does not provides the primary
service—the mobility, perceived ease of use may not directly influence the intention to adopt.
Testing the TAM in this new context implies the formulation of the following hypotheses:
Hypotheses 1 (H1). In the adoption of MaaS, perceived ease of use determines perceived usefulness.
Hypotheses 2 (H2). In the adoption of MaaS, perceived usefulness influence intention to use.
Hypotheses 3 (H3). In the adoption of MaaS, perceived ease of use determines intention to use.
Hypotheses 4 (H4). In the adoption of MaaS, perceived usefulness mediates the relationship between perceived
ease of use and intention to use.
According to TAM, ease of use determines both usefulness and intention to use. However, from a
managerial perspective, the model lack in suggesting how to increase the perceived ease of use among
the adopters of a new technology.
With regard to MaaS, previous studies suggest as possible determinant of ease of use the perceived
cost saving [30].
Interestingly differently from other type technology adoption, the study shows that a decrease in
transportation prices and car-ownership among users were not thought to be a significant benefit [30].
Our paper aims to clarify the role of perceived cost saving on the perceived ease of use and we
state this effect is related to the life cycle of the adoption [31].
We hypothesis that in the early stage of the adoption the price could positively affect the accessibility
of a technology, thus its perceived ease to use, encouraging its trial, for example, while in the maturity
phase, this is not anymore, an entry barrier [31]. Therefore:
Hypotheses 5 (H5). In the adoption of MaaS, life cycle moderates the relationship between perceived cost
saving and ease of use.
3. Method
A convenience sample of 100 French residents (women 50%, mean age 28) and 101 Finnish residents
(53% women, mean age 39) were surveyed. Responses were assembled from people on the street.
Referring to the French sample, half of the respondents are living in cities/urban area of Paris, Bordeaux
and Marseille on while 27 are living in suburban area (Paris for the most part) and the remaining 23Sustainability 2020, 12, 8210 5 of 14
respondents in a rural area. In Finland, a majority of the answerers (70%) lived in the Capital region,
which encompasses Helsinki, Espoo, Vantaa and Kauniainen. Additional five respondents resided in
the Greater Helsinki area including towns such as Järvenpää, Kerava, Kirkkonummi and Sipoo. The 2
populations are not statistically different in term of gender distribution: 53% of the Finland sample
is composed by females versus the 50% of the French sample (Chi Square = 0.24; p = n.s.) Moreover,
a paired-sample t tests with environmental attitude within-subjects variable were conducted to assess
the impact of this variable on intention to use. The results show that the 2 populations do not differ in
term of environmental attitude: M = 4.6 for the Finnish population; M = 4.9 for the French population;
t (195) = −1.60, p= n.s.
Among the Finnish sample, quantitative study shows that most common education levels were
bachelor’s (32%) and master’s degree (42%). Also referring to the French sample, the majority of
respondents possess either a master’s degree or a bachelor’s degree (see the details in the graph below).
With regard to the car use by Finnish, the possession of a driving licence was very common (98%
of the respondents). Most of them (89%) had also access to a car. 71% of the French respondents
possess a driving license, and the 60% have access a car.
As explained in the introduction section, we have chosen Finland and France as those two
countries are in a different stage in the current mobility servitization; the first one is a pioneer while
the second one is a follower. Respondents were asked to answer an online survey about perceived cost
saving, ease of use, usefulness and intention to use the service.
The questionnaires (Appendix A) were run in Finnish and in French for the two different
populations as one of the authors is Finnish and one other is French.
3.1. Measures
3.1.1. Perceived Cost Saving
We adapted Kamargianni, Matyas, Li and Muscat, (2018) [10] scale and we used 3 items measured
by 7-points Likert scale: I consider that a MaaS type of service should cost less than a traditional way
of commuting; I consider that a monthly subscription should be more affordable than 30 on demand
tickets; I consider that a MaaS service should deliver savings in travel costs.
3.1.2. Ease of Use
We referred to the same construct proposed by Davis and Venkatesh (2000) [23], measured
by two 7 points Likert items: I expect a MaaS to make commuting easier; I expect a MaaS to be
user-friendly/intuitive.
3.1.3. Usefulness
We adapted the scale proposed by Davis (1989) [32] to our context. We measured usefulness with
4 items (7 points scale): Use of a MaaS would improve my mobility options; Use of a MaaS would
make my daily commute faster; Use of a MaaS would allow me to optimize my daily commute; Use of
a MaaS would allow me to commute in the way I want.
3.1.4. Intention to Use
We referred to the same construct proposed by Davis and Venkatesh (1996) [23], measured by
three 7 points Likert items: I intend to use a MaaS if I have access to the service; I would rather use a
MaaS than a traditional way of commuting; I would use a MaaS if I find it useful and easy to use.
4. Results
The reliability for the analyzed constructs is showed in Table 1 while Tables 2–5 show the means,
standard deviations, and correlations among scales for the 2 populations.Sustainability 2020, 12, 8210 6 of 14
Table 1. Reliability of measures.
Populations Perceived Cost Saving Ease of Use Usefulness Intention to Use
French 0.75 0.70 0.88 0.86
Finnish 0.70 0.60 0.90 0.83
Table 2. Factor Analysis for the Finnish sample.
Component
Measures
1 2 3 4
Useful1 0.922 - - -
Useful2 0.873 - - -
Useful3 0.865 - - -
Useful4 0.834 - - -
Intention1 - 0.875 - -
Intention 2 - 0.863 - -
Intention3 - 0.860 - -
Cost 1 - - 0.837 -
Cost2 - - 0.769 -
Cost 3 - - 0.767 -
Easy1 - - - 0.841
Easy2 - - - 0.840
Extraction Method: Principal Component Analysis. Rotation Method: Promax with Kaiser Normalization.
Table 3. Factor Analysis. for the French sample.
Component
Measures
1 2 3 4
Useful 1 0.919 - - -
Useful2 0.861 - - -
Useful3 0.822 - - -
Useful4 0.800 - - -
Intention1 - 0.928 - -
Intention2 - 0.878 - -
Intention3 - 0.818 - -
Cost1 - - 0.865 -
Cost 2 - - 0.833 -
Cost3 - - 0.744 -
Easy1 - - - 0.877
Easy2 - - - 0.830
Extraction Method: Principal Component Analysis. Rotation Method: Promax with Kaiser Normalization.
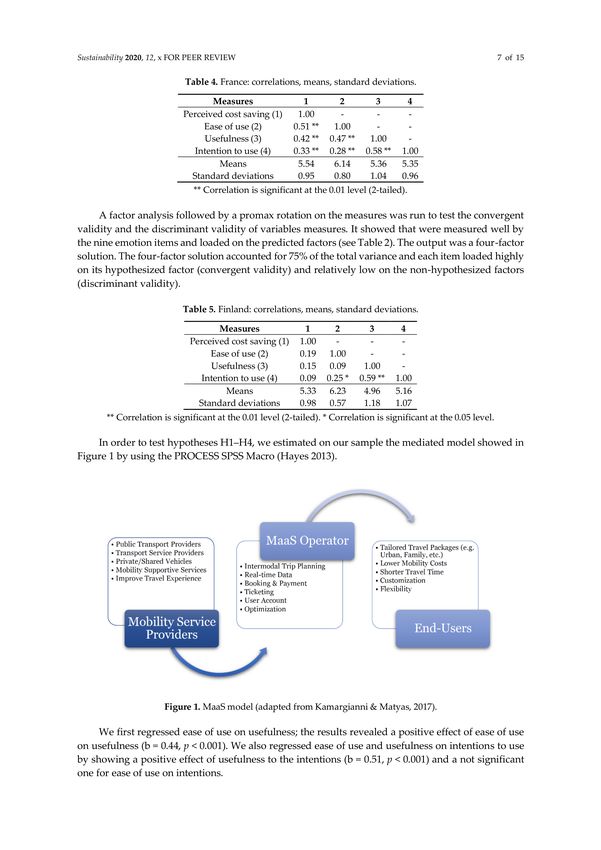
Table 4. France: correlations, means, standard deviations.
Measures 1 2 3 4
Perceived cost
1.00 - - -
saving (1)
Ease of use (2) 0.51 ** 1.00 - -
Usefulness (3) 0.42 ** 0.47 ** 1.00 -
Intention to use (4) 0.33 ** 0.28 ** 0.58 ** 1.00
Means 5.54 6.14 5.36 5.35
Standard
0.95 0.80 1.04 0.96
deviations
** Correlation is significant at the 0.01 level (2-tailed).Sustainability 2020, 12, 8210 7 of 14
Table 5. Finland: correlations, means, standard deviations.
Measures 1 2 3 4
Perceived cost
1.00 - - -
saving (1)
Ease of use (2) 0.19 1.00 - -
Usefulness (3) 0.15 0.09 1.00 -
Intention to use (4) 0.09 0.25 * 0.59 ** 1.00
Means 5.33 6.23 4.96 5.16
Standard
0.98 0.57 1.18 1.07
deviations
** Correlation is significant at the 0.01 level (2-tailed). * Correlation is significant at the 0.05 level.
A factor analysis followed by a promax rotation on the measures was run to test the convergent
validity and the discriminant validity of variables measures. It showed that were measured well by
the nine emotion items and loaded on the predicted factors (see Table 2). The output was a four-factor
solution. The four-factor solution accounted for 75% of the total variance and each item loaded highly
on its hypothesized factor (convergent validity) and relatively low on the non-hypothesized factors
(discriminant validity).
In order to test hypotheses H1–H4, we estimated on our sample the mediated model showed in
Figure 1 by using the PROCESS SPSS Macro (Hayes 2013).
Figure 1. MaaS model (adapted from Kamargianni & Matyas, 2017).
We first regressed ease of use on usefulness; the results revealed a positive effect of ease of use on
usefulness (b = 0.44, p < 0.001). We also regressed ease of use and usefulness on intentions to use by
showing a positive effect of usefulness to the intentions (b = 0.51, p < 0.001) and a not significant one
for ease of use on intentions.
Furthermore, the analyses revealed a significant indirect effect of ease of use on intentions,
via usefulness, which is positive and significant (b = 0.22, 95% CI = 0.08, 0.18). Thus, according to our
findings, H1 was supported by data as well as H2 and H4, while H3 was not supported.
Finally, in order to test H5, we estimated on our sample the moderated model showed in Figure 2
by using the PROCESS SPSS Macro [33], an observed variable OLS and logistic regression path analysis
modelling tool, where perceived cost saving is the independent variable, ease of use the dependent
variable and the country (France/Finland) the moderator. We first regressed perceived cost savings
on ease of use; the results revealed a positive effect of the former on the latter (b = 0.40, p < 0.005).Sustainability 2020, 12, 8210 8 of 14
Furthermore, the joint effects of perceived cost saving and nationality on ease of use was positive and
significant, as predicted For French people but not for Finnish consumer, perceived cost saving is
significant in fueling the ease of use (b = 0.42, 95% CI = 0.29, 0.55).
Figures 3 and 4 show the distribution of the population by education in the two country and,
Figures 5 and 6 show the mediated and moderated models.
Figure 2. Technology Acceptance Model—TAM.
Figure 3. Education level in the Finnish sample.
Figure 4. Education level in the French sample.Sustainability 2020, 12, 8210 9 of 14
Figure 5. The mediated model.
Figure 6. The moderated model.
5. Discussion
The present study explored the main mechanisms behind the intention to adopt MaaS model.
We contribute to the most recent literature on MaaS [21,34,35] as our results show that, for this
kind of innovation not all the hypotheses of TAM are supported by data: ease of use does not have
a direct impact on intention to adopt. This may due to the fact that, in an innovation such as MaaS,
the technology is dissociated from the adopter’s final task, as previous studies suggest [29].
Indeed our data confirms Gefen and Straub (2000) [29] work that demonstrate that when the
technology is not the final goal of the potential adopters, but it represents only a mean to reach this
final objective, the perceived ease of use does not have a direct impact on intention to adopt. Referring
to MaaS, the final goal for the potential adopters is represented by the mobility and the application
can be only an effective tool to reach this final goal. This seems the reason why as Gefen and Straub
predict, we did not find a significant direct relationship between ease of use and intention to adopt.
A further explanation for this relative importance of perceived ease of use could be found in the
fact that, nowadays, consumers take for granted that a mobile app must be intuitive and conceived to
simplify their lives.
Therefore, in line with our findings, we suggest a modified version of TAM in order to explain the
intention of adopt this new kind of technology.
Nevertheless, perceived ease of use remains an important determinant of perceived usefulness
that, in turn, impact on intention to adopt.Sustainability 2020, 12, 8210 10 of 14
For this reason, one of our goal was to identify the determinants for the user-friendliness. Previous
studies suggest that the perceived cost may increase the perceived complexity of a new technology [30]
and we tested under which conditions it represents a barrier.
An interesting contribution of the present study is the role played by the cost of these type of
services in facilitating their acceptance. Our finding shows that the perceived cost is a determinant
of the perceived ease of use only for in the first stage of the life cycle of the technology, while, in the
maturity phase, consumers seem less elastic to price.
As previous studies about the adoption of technology have shown [31], the perceived cost is a
barrier for the potential B2C adopters only in first stages of life cycle of the technology and our results
support this conclusion.
Indeed, in the maturity phase adopters have the possibility to fully experience the new technology
and then they are able to value it in the correct way.
Finally, understanding acceptance factors and mechanisms that can facilitate MaaS adoption is of
high importance for designing effective mobility policies. MaaS implies a cultural switch from the
ownership of a transportation mean to the focus on the journey and the services that make it easier.
In other words, MaaS is a socio-technological change and transformation process of public and private
mobility. Our findings suggest that policy makers need to focus on communicating the usefulness and
the positive impact at individual and social level of this model of mobility.
6. Conclusions, Managerial Implications and Limitations
Mobility as a Service (MaaS) is the new hyped phenomenon resulting from a massive urbanization,
which causes many problems such as traffic bottlenecks and environmental issues. This massive
urbanization creates many challenges for cities as the transport systems need to be rethought.
Our data shows that in order to make this new mobility model to be accepted, firms need to make
clear the advantages (perceived usefulness) that these new services provide to users. At the same time,
we find out that the price can be an incentive only in the in the launch phase of the service. Moreover,
our data suggests that the more the customer becomes aware of the advantages and the feature of the
service (maturity stage) the less the price affects their intention to use the service.
According to our findings, an accurate study of the stage in the life cycle of a technology service is
necessary for designing distribution models for firms as well as mobility policies for policy makers in
deploying new and more sustainable mobility models.
Finally, our data highlights an interesting effect that is not predicted by TAM. Perceived ease of
use seems to be taken for granted when an innovation is app-based and it is not intrinsic to the final
goal but represents only a tool to reach the final objective (the journey in our case). This might suggest
that simplicity and readiness are not an option in designing such as apps. However, simplicity and
readiness (perceived ease of use) must not be pursued at the expenses of affect the quality of the service.
Finally, like as other pieces of research, the present paper presents some limitations that could
suggest directions for further research. The first one refers to the number of countries analyzed (two:
France end and Finland). They were chosen because of the different stage of the life cycle of MaaS in
the two countries and further comparisons among other nationalities may contribute to generalize our
findings, testing the external validity of our study.
The second limit resides in the focus on the perceived cost saving as determinant of the ease of
use. Other variables might affect perceived ease of use and further research could explore the role of
these predictors, such as flexibility, quality and experience with the service.
Author Contributions: The four authors contributed equally. The paper came as a result of a collegial confrontation.
In particular Q.B. and K.H. initiated the data collection and the first round of analysis. L.M. defined the theoretical
framework that was discussed with Q.B. and K.H. I.S. refined the theoretical and methodological model. All authors
have read and agreed to the published version of the manuscript.
Funding: This research received no external funding.
Conflicts of Interest: There are no conflict of interest.Sustainability 2020, 12, 8210 11 of 14
Appendix A. The Questionnaire
Mobility as a Service (MaaS)—A study of consumer behaviour
Part 1—Socio demographic profile
1. Where do you reside?
a. France
b. Finland
2. Please specify your city
a. __________________________________________
3. Please indicate your gender.
a. Female
b. Male
c. Prefer not to answer
4. What is your age?
a. __________________________________________
5. What is your educational background?
a. No degree
b. Basic education (middle school)
c. Upper secondary school diploma or equivalent
d. Bachelor’s degree
e. Master’s degree
f. PhD degree
g. Prefer not to answer
6. In which area do you live in
a. City / Urban area
b. Suburban area
c. Rural area
Part 2: Transportation behaviours
7. Do you have a driving licence?
a. Yes
b. No
8. Do you have access to a car?
a. Yes
b. No
9. What is your primary type of transportation?
a. On foot
b. Bicycle
c. Bus
d. TramSustainability 2020, 12, 8210 12 of 14
e. Train
f. Subway
g. Car
h. Other ____________________
10. Do you use more than one type of transportation?
a. Yes
b. Sometimes
c. No
Part 3 options about your future mobility behaviour
11. How willing are you to change your way of commuting from and environmental perspective?
(on a scale from 1 to 7 (where 1= “not at all willing” and 7 “completely willing”)
1__ 2__ 3__ 4__ 5__ 6__ 7__
12. Please rete the following statements about you future travel behaviour / attitude On a scale
from 1 to 7 Where 1 = “I strongly disagree” and 7 “I Strongly agree”.
Price
(1) I consider that . . .
a. A MaaS service should cost less than a traditional way of commuting
1__ 2__ 3__ 4__ 5__ 6__ 7__
a. A monthly subscription should be more affordable than 30 on demand tickets
1__ 2__ 3__ 4__ 5__ 6__ 7__
b. A MaaS service should deliver saving in travel costs
1__ 2__ 3__ 4__ 5__ 6__ 7__
Ease of Use
(2) expect a MAAS app to . . .
a. Make commuting easier
1__ 2__ 3__ 4__ 5__ 6__ 7__
b. Be user friendly / intuitive
1__ 2__ 3__ 4__ 5__ 6__ 7__
Usefulness
(3) Use of a MaaS would
a. Improve My mobility options
1__ 2__ 3__ 4__ 5__ 6__ 7__
b. Make my daily commute faster
1__ 2__ 3__ 4__ 5__ 6__ 7__
c. Allow me to optimize my daily commute
1__ 2__ 3__ 4__ 5__ 6__ 7__
d. Allow me to commute in the way I want
1__ 2__ 3__ 4__ 5__ 6__ 7__Sustainability 2020, 12, 8210 13 of 14
Intention to use
a. I intend to use a MaaS if I have access to the service
1__ 2__ 3__ 4__ 5__ 6__ 7__
b. I would rather use a MaaS than a traditional way of commuting
1__ 2__ 3__ 4__ 5__ 6__ 7__
c. I would use a MaaS if I find it useful and easy to use
1__ 2__ 3__ 4__ 5__ 6__ 7__
References
1. United Nations. 2018 Revision of World Urbanization Prospects; Population Division of the United Nations
Department of Economic and Social Affairs (UN DESA): New York, NY, USA, 2018.
2. Graham-Rowe, E.; Skippon, S.; Gardner, B.; Abraham, C. Can we reduce car use and, if so, how? A review of
available evidence. Transp. Res. Part A Policy Pr. 2011, 45, 401–418. [CrossRef]
3. Goodall, W.; Fishman, T.D.; Bornstein, J.; Bonthron, B. The rise of mobility as a service: Reshaping how
urbanites get around. Deloitte Rev. 2017, 20, 112–129.
4. Smith, G.; Sochor, J.; Karlsson, M.A. Mobility as a Service: Development scenarios and implications for
public transport. Res. Transp. Econ. 2018, 69, 592–599. [CrossRef]
5. Pinto, J.T.; Morales, M.E.; Fedoruk, M.; Kovaleva, M.; Diemer, A. Servitization in Support of Sustainable
Cities: What Are Steel’s Contributions and Challenges? Sustainability 2019, 11, 855. [CrossRef]
6. Fonstad, N.; Mocker, M. How IT Drives Digital Innovations at Audi; Center for Information Systems Research:
Cambridge, MA, USA, 2016.
7. Genzlinger, F.; Zejnilovic, L.; Bustinza, O.F. Servitization in the automotive industry: How car manufacturers
become mobility service providers. Strat. Chang. 2020, 29, 215–226. [CrossRef]
8. Mohr, D.; Wee, D.; Möller, T. Eight Disruptive Trends Shaping the Auto Industry of 2030. 2016. Available
online: https://www.automotiveworld.com/articles/eight-disruptive-trends-shaping-auto-industry-2030/.
(accessed on 20 June 2019).
9. McFarland, M. BMW Plans for a Future Where Nobody Buys Cars CNN Tech. 2017. Available online:
https://money.cnn.com/2017/05/24/technology/bmw-seattle-reachnow/index.html. (accessed on 20 June 2019).
10. Kamargianni, M.; Li, W.; Matyas, M. A Comprehensive Review of “Mobility as A Service. In Proceedings of
the Transportation Research Board 95th (TRB) Annual Meeting, Washington, DC, USA, 11-12 January 2016;
pp. 10–14.
11. Dans, E. Why Helsinki’s Mobility App, Whim, Is No Fad. 2018. Available online: https://www.forbes.com/
sites/enriquedans/2018/07/18/why-helsinkis-whim-is-no-fad/#62c500ef2e14. (accessed on 2 October 2020).
12. Opazo-Basáez, M.; Vendrell-Herrero, F.; Bustinza, O.F. Uncovering Productivity Gains of Digital and Green
Servitization: Implications from the Automotive Industry. Sustainability 2018, 10, 1524. [CrossRef]
13. Baines, T.S.; Lightfoot, H.W.; Benedettini, O.; Kay, J.M. The servitization of manufacturing: A review of
literature and reflection on future challenges. J. Manuf. Technol. Manag. 2009, 20, 547–567. [CrossRef]
14. Baines, T.; Lightfoot, H.W. Servitization of the manufacturing firm. Int. J. Oper. Prod. Manag. 2013, 34, 2–35.
[CrossRef]
15. Hensher, D.A.; Mulley, C. Special issue on developments in Mobility as a Service (MaaS) and intelligent
mobility. Transp. Res. Part A Policy Pr. 2020, 131, 1–4. [CrossRef]
16. Little, A.D. The Future of Mobility 3.0. Reinventing Mobility in the Era of Disruption and Creativity. Future
of Mobility Lab. 2018.
17. Mukhtar-Landgren, D.; Smith, G. Perceived action spaces for public actors in the development of Mobility as
a Service. Eur. Transp. Res. Rev. 2019, 11, 32. [CrossRef]
18. Polydoropoulou, A.; Pagoni, I.; Tsirimpa, A.; Roumboutsos, A.; Kamargianni, M.; Tsouros, I. Prototype
business models for Mobility-as-a-Service. Transp. Res. Part A Policy Pr. 2020, 131, 149–162. [CrossRef]
19. Kamargianni, M.; Matyas, M. The Business Ecosystem of Mobility as a Service. In Proceedings of the 96th
Transportation Research Board (TRB) Annual Meeting, Washington, DC, USA, 8–12 January 2017; pp. 8–12.Sustainability 2020, 12, 8210 14 of 14
20. Hazan, J.; Lang, N.; El Abassi Chraibi, H. Seeking Perpetual Motion with Mobility as a Service; Boston
Consulting Group Hendersen Institute, 2019; Available online: https://www.bcg.com/publications/2019/
seeking-perpetual-motion-mobility-as-service (accessed on 2 October 2020).
21. Schikofsky, J.; Dannewald, T.; Kowald, M. Exploring motivational mechanisms behind the intention to adopt
mobility as a service (MaaS): Insights from Germany. Transp. Res. Part A Policy Pr. 2020, 131, 296–312.
[CrossRef]
22. Williamson, O.E. Transaction-Cost Economics: The Governance of Contractual Relations. J. Law Econ. 1979,
22, 233–261. [CrossRef]
23. Davis, F.D.; Venkatesh, V. A critical assessment of potential measurement biases in the technology acceptance
model: Three experiments. Int. J. Hum. Computer Stud. 1996, 45, 19–45. [CrossRef]
24. Venkatesh, V.; Davis, F.D. A Theoretical Extension of the Technology Acceptance Model: Four Longitudinal
Field Studies. Manag. Sci. 2000, 46, 186–204. [CrossRef]
25. Venkatesh, V.; Morris, M.G.; Davis, G.B.; Davis, F.D. User acceptance of information technology: Toward a
unified view. MIS Q. 2003, 27, 425–478. [CrossRef]
26. Soscia, I.; Arbore, A.; Hofacker, C.F. The impact of trial on technology adoption: The case of mobile TV. J. Res.
Interact. Mark. 2011, 5, 226–238. [CrossRef]
27. Arbore, A.; Soscia, I.; Bagozzi, R. The Role of Signaling Identity in the Adoption of Personal Technologies.
J. Assoc. Inf. Syst. 2014, 15, 86–110. [CrossRef]
28. Chen, S.-Y. Using the sustainable modified TAM and TPB to analyze the effects of perceived green value on
loyalty to a public bike system. Transp. Res. Part A Policy Pr. 2016, 88, 58–72. [CrossRef]
29. Gefen, D.; Straub, D. The Relative Importance of Perceived Ease of Use in IS Adoption: A Study of
E-Commerce Adoption. J. Assoc. Inf. Syst. 2000, 1, 1–30. [CrossRef]
30. Polydoropoulou, A.; Pagoni, I.; Tsirimpa, A. Ready for Mobility as a Service? Insights from stakeholders and
end-users. Travel Behav. Soc. 2018, 1–12. [CrossRef]
31. Brown, S.A.; Venkatesh, V.; Bala, H. Household Technology Use: Integrating Household Life Cycle and the
Model of Adoption of Technology in Households. Inf. Soc. 2006, 22, 205–218. [CrossRef]
32. Davis, F.D. Perceived Usefulness, Perceived Ease of Use, and User Acceptance of Information Technology.
MIS Q. 1989, 13, 319. [CrossRef]
33. Hayes, A.F. Introduction to Mediation, Moderation, and Conditional Process Analysis: A Regression-Based Approach;
Guilford publications: New York, NY, USA, 2017.
34. Ho, C.; Mulley, C.; Hensher, D.A. Public preferences for mobility as a service: Insights from stated preference
surveys. Transp. Res. Part A Policy Pr. 2020, 131, 70–90. [CrossRef]
35. Smith, G.; Sochor, J.; Karlsson, I.M. Public–private innovation: Barriers in the case of mobility as a service in
West Sweden. Public Manag. Rev. 2018, 21, 116–137. [CrossRef]
© 2020 by the authors. Licensee MDPI, Basel, Switzerland. This article is an open access
article distributed under the terms and conditions of the Creative Commons Attribution
(CC BY) license (http://creativecommons.org/licenses/by/4.0/).You can also read