Array CGH identifies distinct DNA copy number profiles of oncogenes and tumor suppressor genes in chromosomal- and microsatellite-unstable ...
←
→
Page content transcription
If your browser does not render page correctly, please read the page content below
J Mol Med (2007) 85:293–304
DOI 10.1007/s00109-006-0126-5

 ORIGINAL ARTICLE

Array CGH identifies distinct DNA copy number profiles
of oncogenes and tumor suppressor genes in chromosomal-
and microsatellite-unstable sporadic colorectal carcinomas
Silke Lassmann & Roland Weis & Frank Makowiec &
Jasmine Roth & Mihai Danciu & Ulrich Hopt &
Martin Werner

Received: 26 July 2006 / Revised: 21 September 2006 / Accepted: 25 October 2006 / Published online: 2 December 2006
# Springer-Verlag 2006

Abstract DNA copy number changes represent molecular
fingerprints of solid tumors and are as such relevant for
better understanding of tumor development and progression.
In this study, we applied genome-wide array comparative
genomic hybridization (aCGH) to identify gene-specific
DNA copy number changes in chromosomal (CIN)- and
microsatellite (MIN)-unstable sporadic colorectal cancers
(sCRC). Genomic DNA was extracted from microdissected,
matching normal colorectal epithelium and invasive tumor
cells of formalin-fixed and paraffin-embedded tissues of 22
cases with colorectal cancer (CIN=11, MIN=11). DNA
copy number changes were determined by aCGH for 287
                                                                        SILKE LASSMANN                      MARTIN WERNER
target sequences in tumor cell DNAs, using pooled normal
                                                                        Silke Lassmann was awarded          Martin Werner was awarded his
DNAs as reference. aCGH data of tumor cell DNAs was                     her BSc. in Physiology in 1994      M.D. from the University of
confirmed by fluorescence in situ hybridization (FISH) for              from King’s College and her         Saarland in 1986 and his Ph.D.
three genes on serial tissues as those used for aCGH. aCGH              Ph.D. in 1998 from the Faculty      from the University of Hannover
                                                                        of Biochemistry, University of      in 1993. Since 2002 Martin
revealed DNA copy number changes previously described
                                                                        London, Great Britain. She is       Werner is the Chairman of the
by metaphase CGH (gains 7, 8q, 13q, and 20q; losses 8p,                 presently principal investigator    Institute of Pathology, Albert-
15q, 18q, and 17p). However, chromosomal regions 20q,                   at the Institute of Pathology,      Ludwigs-University Freiburg,
13q, 7, and 17p were preferentially altered in CIN-type                 Albert-Ludwigs-University,          Germany.
                                                                        Freiburg, Germany.                   The main research interests of
tumors and included DNA amplifications of eight genes on
                                                                         The main research interests of     their molecular tumorpathology
chromosome 20q (TOP1, AIB1, MYBL2, CAS, PTPN1,                          their molecular tumorpathology      group focuses on the biology of

S. Lassmann (*) : R. Weis : J. Roth : M. Danciu : M. Werner
                                                                        group focuses on the biology of     solid (gastrointestinal) tumors
                                                                        solid (gastrointestinal) tumors     and hematologic neoplasms, in
Institut für Pathologie, Universitätsklinikum Freiburg,                 and hematologic neoplasms, in       particular the basic molecular
Breisacherstr. 115a,                                                    particular the basic molecular      mechanisms of tumor develop-
79110 Freiburg, Germany                                                 mechanisms of tumor develop-        ment and progression and the
e-mail: silke.lassmann@uniklinik-freiburg.de                            ment and progression and the        evaluation of novel applications
F. Makowiec : U. Hopt
                                                                        evaluation of novel applications    of molecular pathology in a
                                                                        of molecular pathology in a         clinically relevant setting, such
Abteilung Allgemein- und Viszeralchirurgie,                             clinically relevant setting, such   as therapy prediction.
Universitätsklinikum Freiburg,                                          as therapy prediction.
Hugstetterstr. 55, 79106 Freiburg, Germany

M. Danciu
                                                                      STK15, ZNF217, and CYP24), two genes on chromosome
Pathology Department, Faculty of Medicine,
University of Medicine and Pharmacy, “Gr. T. Popa”,                   13q (BRCA2 and D13S25), and three genes on chromo-
Iasi, Romania                                                         some 7 (IL6, CYLN2, and MET) as well as DNA deletions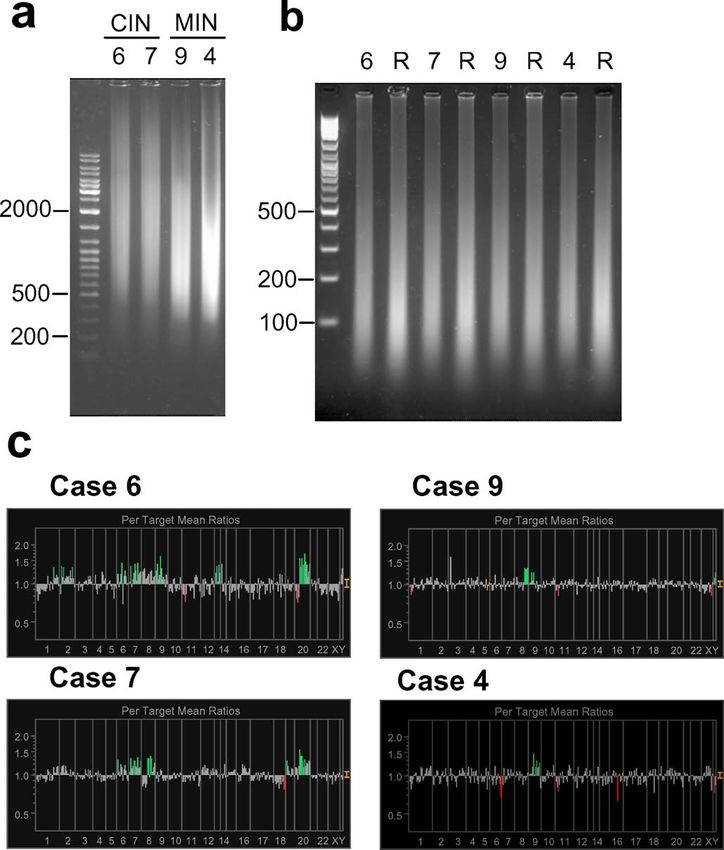
294                                                                                               J Mol Med (2007) 85:293–304

of two genes on chromosome 17p (HIC1 and LLGL1).                 (CIN, 85% of cases) and microsatellite instability (MIN,
Finally, additional CIN-tumor-associated DNA amplifica-          15% of cases). CIN-type tumors display many genomic
tions were identified for EXT1 (8q24.11) and MYC                 alterations and are frequently aneuploid, whereas MIN-
(8q24.12) as well as DNA deletions for MAP2K5 (15q23)            tumors have fewer genomic alterations and are generally
and LAMA3 (18q11.2). In contrast, distinct MIN-tumor-            regarded as diploid [17, 18]. Although DNA analysis by
associated DNA amplifications were detected for E2F5             mCGH and FISH [6, 11–16] and mRNA expression
(8p22–q21.3), GARP (11q13.5–q14), ATM (11q22.3),                 profiling by cDNA microarray [19–23] have revealed
KAL (Xp22.3), and XIST (Xq13.2) as well as DNA                   CIN- and MIN-type tumor-associated candidate genes,
deletions for RAF1 (3p25), DCC (18q21.3), and KEN                there is currently little experimental evidence about the
(21q tel). aCGH revealed distinct DNA copy number                genome-wide differences of DNA copy number changes,
changes of oncogenes and tumor suppressor genes in CIN-          especially at a gene-specific level, between CIN- and MIN-
and MIN-type sporadic colorectal carcinomas. The identi-         type colorectal cancers. Moreover, whether such gene-
fied candidate genes are likely to have distinct functional      specific profiles of DNA copy number changes could be
roles in the carcinogenesis and progression of CIN- and          responsible for the differential mRNA expression profiles
MIN-type sporadic CRCs and may be involved in the                and the distinct clinicopathological phenotypes of CIN- and
differential response of CIN- and MIN-type tumor cells to        MIN-type colorectal tumors remains to be solved.
(adjuvant) therapy, such as 5-fluorouracil.                         Recent studies have addressed the issue of screening
                                                                 DNA copy number changes by array-based comparative
Keywords Colorectal cancer . Genetic instability .               genomic hybridization (aCGH) in colorectal cancer [24–
Oncogenes . Tumor suppressor genes . Array CGH                   26]. These studies used fresh frozen tissues without prior
                                                                 microdissection of tumor cells, potentially biasing the
                                                                 quantity and quality of aCGH data. Moreover, no clear
Introduction                                                     distinction was made between sporadic and potentially
                                                                 familiar colorectal cancer cases. With respect to differences
Alterations of genomic DNA at the level of whole                 of CIN- and MIN-type colorectal cancers, only one study
chromosomal regions or individual genes represent molec-         [26], which included 125 cases, revealed distinct chromo-
ular fingerprints of solid tumors [1, 2]. Specific patterns of   somal regions affected in CIN- and MIN-type tumors.
DNA copy number gains/losses of entire chromosomal               Similar chromosomal regions were detected in the other
regions and/or target gene-specific amplifications/deletions     aCGH studies [24, 25], but sample sizes of CIN- and MIN-
were identified for individual tumors and their precursor        tumors were unbalanced and low (32 vs 2 and 4 vs 6,
lesions [3–5], including colorectal cancer [6, 7].               respectively) and didn’t allow final conclusions about DNA
    The development of sporadic colorectal cancer (sCRC)         copy number differences between CIN- and MIN-type
is characterized by specific genetic alterations, which          tumors. Thus, candidate chromosomal regions were
accompany the tumor’s specific macroscopic and histologic        detected in CIN- and MIN-type colorectal cancers, but
changes and hence also influence individual tumor pro-           gene-specific targets, especially with respect to differences
gression [8–10]. At the DNA level, these genetic alterations     between CIN- and MIN-type colorectal cancers, await
were investigated by metaphase comparative genomic               identification and validation.
hybridization (mCGH) and fluorescence in situ hybridiza-            To evaluate whether distinct genomic DNA alterations
tion (FISH), resulting in the definition of a specific pattern   occur in CIN- compared to MIN-type sCRC and to pinpoint
of DNA gains at 7, 8q, 13q, and 20q as well as DNA losses        involved oncogenes and tumor suppressor genes, we
at 5q, 8p, 17p, and 18q [1–16]. In addition, individual          therefore analyzed DNA from microdissected tumor cells
oncogenes and tumor suppressor genes, located within             of a previously characterized group of sporadic CIN- and
these chromosomal regions, were identified and shown to          MIN-type colorectal cancers [27] by aCGH. The aCGH
play a major role in colorectal carcinogenesis, such as APC      platform included a selected panel of 287 target sequences,
at 5q, DCC at 18q, and MYC at 8q. However, the detailed          mostly known oncogenes and tumor suppressor genes, and
profile of gene-specific changes and its contribution to         allowed both reliable aCGH screening and subsequent
sporadic colorectal carcinogenesis and tumor progression is      validation of candidate genes by FISH using serial sections
still unknown. This is complicated by the fact that the          of formalin-fixed and paraffin-embedded tissues, as shown
development of sCRC does not follow a single molecular           before for Barrett carcinomas [28]. aCGH revealed distinct
pathway, but is rather characterized by multiple (over-          DNA copy number changes between sporadic CIN- and
lapping) pathways [8].                                           MIN-associated colorectal carcinomas. A differential role
    In general, the genetic changes of sporadic colorectal       of these candidate oncogenes and tumor suppressor genes
carcinogenesis can be divided into chromosomal instability       in tumor development and progression of sporadic CIN and
J Mol Med (2007) 85:293–304                                                                                                  295

MIN CRC is likely and may also be involved in the                     specimens were used for preparation of genomic DNA, but
response or resistance to therapeutic interventions, such as          with normal epithelium being derived from the resection
that shown for microsatellite instability and 5-fluorouracil          margins at a distance of at least 10 cm from the primary
(5-FU) [29].                                                          tumor.

                                                                      Microdissection and DNA isolation
Materials and methods
                                                                      Normal colorectal epithelium and invasive carcinoma cells
Tissue samples                                                        were microdissected from each one 10 μm section under
                                                                      microscopic surveillance using fine needles. Cells were
The study included a total of 22 cases with sCRC, of which            immediately placed into tissue lysis buffer (QIAamp DNA
the CIN and MIN status had been determined in a previous              Kit, Qiagen, Hilden, Germany) and incubated overnight at
study [27]. Resection specimens were from the colon (19/              55°C. DNA was purified the next day according to the
22 cases) and from the rectum (3/22 cases). None of the               manufacture’s protocol, eluted in 20 μl of water, and mea-
patients had received neoadjuvant therapy before resection            sured in a spectrophotometer (ND1000, Peqlab, Erlangen,
of the primary tumor and 21/22 cases had an R0 resection              Germany). In addition, DNA fragment length was assessed
and 1/22 an R1 resection (rectum carcinoma and palliative             by agarose gel electrophoresis and showed good quality for
surgery). Hematoxylin & eosin (HE) sections of the                    aCGH analysis (Fig. 2a).
specimens had been classified for pT and pN categories
[30] and WHO tumor type and tumor grade [31]. The                     aCGH experiments and statistical data analysis
clinicopathological data of all cases is summarized in
Table 1.                                                              For aCGH, commercially available arrays, including 287
   Representative tissue areas (normal epithelium and                 target clones of oncogenes and tumor suppressor genes
invasive carcinoma) were marked on HE sections for                    spotted in triplicate (“GenoSensor™ Array 300,” Abbott,
microdissection (see below). Case-matched normal colonic              Wiesbaden, Germany), were used according to the manu-
epithelial cell and invasive carcinoma cells from the same            facturer’s protocols with some modifications:
formalin-fixed and paraffin-embedded surgical resection                  A pool of all 22 normal DNAs was used as “reference
                                                                      DNA” for the aCGH experiments. This approach had been
Table 1 Clinicopathological data of cases                             successful before in our laboratory [28], but was addition-
                                                                      ally assessed in the present study by aCGH analysis of
Case    Age    Sex        pT    pN     Hist. type   G   Genetic
ID                                                      instability
                                                                      individual normal DNA against the pooled normal refer-
                                                        [27]          ence DNA. From this, the threshold for significant DNA
                                                                      copy number changes above normal variation was defined
1       71     Male       3     0      Tubular      2   CIN           for DNA losses and gains at 1.2, respectively
2       86     Male       3     0      Tubular      2   CIN           (“Results,” Fig. 1).
3       88     Male       3     0      Tubular      2   CIN
                                                                         For each aCGH experiment, 300 ng of pooled reference
4       67     Male       3     0      Mucinous     3   MIN
5       74     Male       3     0      Tubular      3   CIN
                                                                      DNA and 300 ng of one tumor DNA were subjected to
6       64     Female     2     0      Tubular      2   CIN           random priming with Cy3- and Cy5-labeled deoxycytidine
7       70     Male       3     0      Tubular      2   CIN           5′-triphosphates, respectively (“Microarray Random Prim-
8       83     Female     3     2      Tubular      3   MIN           ing Kit,” Abbott). This was followed by a DNase digestion
9       90     Female     3     1      Tubular      2   MIN           step, probe purification using microspin columns (S-200
10      77     Female     3     0      Tubular      2   CIN           HR, Amersham), and checking the reaction on an agarose
11      75     Male       3     0      Tubular      2   CIN           gel, with all processed samples having an acceptable size
12      80     Female     3     0      Tubular      2   MIN
                                                                      range of 50–200 bp (Fig. 2b). For sample, hybridization,
13      90     Female     3     0      Mucinous     2   MIN
14      76     Male       3     0      Tubular      2   CIN
                                                                      Cy3-labeled pooled reference DNA, and Cy5-labeled tumor
15      82     Male       3     0      Mucinous     3   MIN           DNA were incubated together at equal amounts with
16      66     Female     3     0      Undiff.      3   MIN           hybridization buffer containing Cot-1 DNA, denatured,
17      69     Female     3     0      Tubular      2   MIN           and incubated on the aCGH at 37°C for 72 h. Microarrays
18      86     Female     2     0      Mucinous     2   MIN           were washed three times in 2×SSC/50% formamide at
19      72     Male       2     0      Undiff.      3   MIN           40°C for 10 min each, three times in 1×SSC at room
20      64     Male       3     1      Tubular      3   CIN
                                                                      temperature for 5 min each, and rinsed in distilled water
21      79     Female     3     0      Tubular      2   MIN
                                                                      before embedding in diamidino-2-phenylindole (DAPI)-
22      77     Male       3     0      Tubular      2   CIN
                                                                      mounting medium. Microarrays were left for 45 min before
296                                                                                                             J Mol Med (2007) 85:293–304

a                           Per Target Mean Ratios                             specific single color probe (Cy3™, red) and a single color
                                                                               CEP20-specific probe [fluorescein isothiocyanate (FITC),
2.0
                                                                               green] were custom made (Chrombios, Raubling, Germany).
1.5
                                                                               The single color probes for ZNF217 and STK15 were each
1.0
                                                                               cohybridized with the single color CEP20 probe, so as to
                                                                               allow assessment of gene-specific (red) and centromere-
0.5
                                                                               specific (green) signals in the same cells.
      1   2   3   4 5 6 7    8 9 10 11 12 14         16   17 18   20   22 XY      Before probe hybridization, tissue sections were sub-
b                                                                              jected to deparaffination (2× xylene and 100, 95, 70, and
                            Per Target Mean Ratios
                                                                               50% ethanol) and pretreatment in citrate buffer (pH 6.0)
2.0                                                                            in a microwave oven (180 W) for 20 min followed by
1.5                                                                            Pronase E (0.05%) digestion for 3 min at 37°C.
1.0                                                                            Subsequently, tissue sections were denatured in 50%
                                                                               formamide at room temperature for 15 min and in 70%
0.5                                                                            formamide at 75°C for 5 min. Slides were immediately
      1   2   3   4 5 6 7    8 9 10 11 12 14         16   17 18   20   22 XY
                                                                               immersed in ice cold ethanol (70, 95, and 100%, 5 min
Fig. 1 Validation of aCGH approach. Control experiments for aCGH               each) and dried at 37°C. In the meantime, fluorescent
were performed as described in “Materials and methods” and                     hybridization probes had been denatured at 75°C for
“Results.” aCGH data is depicted for all investigated target sequences         5 min and were pipetted onto dried slides, followed by
(bars along x-axis) as the mean ratio (y-axis). a aCGH analysis of
                                                                               incubation for 16 h at 37°C. Slides were then washed in
DNA extracted from microdissected normal colonic epithelium of a
female case against normal colonic epithelial DNA of a male case. b            2×SSC at room temperature and in 2×SSC at 37°C for
aCGH analysis of normal colonic epithelial DNA from a single case              each 2 min and finally counterstained with DAPI for
vs the pooled normal reference DNA (normal epithelial DNA of all 22            3 min. Cover-glassed (Vecta-Shield, Molecular Probes)
cases). The colors used for each target sequence specific bar are gray
                                                                               slides were stored at −20°C until analysis.
(no significant DNA copy number change) and red (significant DNA
copy number loss)                                                                 Microscopic analysis of FISH sections was performed
                                                                               using a fluorescence microscope with ApoTome imaging
                                                                               system for 3D visualization (“Zeiss Axioplan2 imaging
scanning in the “GenoSensor Reader System” (Abbott,                            microscope” equipped with a PlanApochromat ×63/NA1.4
Wiesbaden, Germany). DNA copy number changes from                              oil objective, Carl Zeiss MicroImaging GmbH, Göttingen,
scanned microarrays were identified by the software and                        Germany). A total of 5–10 image stacks were taken with a
analysis program supplied (Abbott, Wiesbaden, Germany).                        pixel size of 1,388×1,040 at 0.925- to 0.945-μm intervals
This first segments and identifies target spots on the                         from representative tumor areas. The AxioVision software
captured image and rejects debris, then measures the                           converted the image stacks into a 3D view, which was then
intensity and ratios of tumor to reference DNA signals                         assessed for the number of gene and centromere signals.
hybridized to triplicate target clones, performs normaliza-                    Evaluation of FISH was done by an investigator who did
tion, and finally statistically evaluates significant copy                     not know the results of the aCGH. Signals of gene- and
number changes. The thresholds for significant DNA copy                        CEP-specific probes were counted in at least 50 cells and the
number changes were for DNA losses of 1.2. Differences of copy number changes
between CIN and MIN tumors were evaluated by calculat-
ing the frequencies of aberration per target gene.                             Results

Validation of aCGH results by FISH analysis                                    Validation of aCGH approach

To validate individual genes detected by aCGH, serial                          To validate sample preparation and aCGH analysis of
sections (5 μm) of a tissue microarray containing represen-                    the formalin-fixed and paraffin-embedded tissue samples,
tative invasive carcinoma areas of all 22 sCRC cases were                      normal colonic epithelium DNA samples from a female
hybridized with gene-specific and centromere-specific                          were hybridized against those from a male case (Fig. 1a).
(chromosome enumeration probe, CEP) fluorescent hybrid-                        No copy number changes were detected, except for losses
ization probes. A dual color probe for EGFR/CEP7                               at the X chromosome. The mean copy number change
(Spectrum Orange™, Spectrum Green™) and a single color                         for the 287 targets was 1.0034 ± 0.06 (coefficient of
probe for ZNF217 (Spectrum Orange™) were commercially                          variation=2.53±2.06%). In addition, aCGH analysis of a
available (Abbott/Vysis, Wiesbaden, Germany). A STK15-                         single normal DNA against the pooled normal reference
J Mol Med (2007) 85:293–304 297 Fig. 2 Experimental steps for aCGH analysis of the sporadic colorectal ladders (left lanes). c aCGH profiles of the two CIN-type (6 and 7; carcinomas. Representative data of the experimental steps of aCGH left panels) and two MIN-type (9 and 4; right panels) tumor DNAs. analysis is shown for two CIN-type (cases 6 and 7) and two MIN-type aCGH data is depicted at all investigated target sequences (bars (cases 9 and 4) tumors (“Materials and methods”, Table 1): agarose along x-axis) as the mean ratio (y-axis). The colors used for each gels of a purified DNA extracts from microdissected invasive tumor target sequence specific bar are gray (no significant DNA copy cells and b of labeled and fragmented tumor DNAs and pooled normal number change), green (significant DNA gain), and red (significant reference DNA (R), with fragment sizes indicated on the basepair DNA loss)
298 J Mol Med (2007) 85:293–304
DNA revealed no significant copy number changes steps of the analysis are exemplified for each two CIN- and
(Fig. 1b). However, a slightly higher variation of signals MIN-type tumors in Fig. 2.
(mean copy number change for 287 targets=1.0156±0.17, Purified DNA from microdissected, formalin-fixed, and
coefficient of variation=2.02±1.45%) was detected and paraffin-embedded invasive colorectal tumor cells did
the threshold for significant DNA losses and gains was exhibit an acceptable fragment size of >200 bp (Fig. 2a).
adapted accordingly to 1.2, respectively. After fluorescence labeling and DNase digestion, both
tumor DNAs and simultaneously processed reference
Evaluation of aCGH profiles of sCRC DNAs had comparable fragment sizes between 50 and
200 bp (Fig. 2b), and these resulted in high quality aCGH
All 22 cases with sCRC (Table 1) were analyzed as data (Fig. 2c, coefficient of variation=2.05±2.7% for all
described in the “Materials and methods” and the individual 22 tumors).
Fig. 3 Summary of DNA copy
number changes detected in 22 75 50 25
a 25 50 75 75
b 25 50 75 75 50 25
c 25 50 75
50 25
sporadic colorectal carcinomas 1p 1p 1p
by aCGH. The graphs display 1q 1q 1q
the distribution of DNA copy 2p 2p 2p
number changes of the investi- 2q 2q 2q
gated target sequences, summa-
3p 3p 3p
rized into the p and q arms of
3q 3q 3q
chromosomes 1–22 and chro-
mosomes X, Y (y-axis). a Fre- 4p 4p 4p
quency of DNA copy number 4q 4q 4q
changes of all 22 sporadic colo- 5p 5p 5p
rectal carcinomas combined and 5q 5q 5q
frequency of DNA copy number 6p 6p 6p
changes in the separate groups 6q 6q 6q
of b only CIN-type tumors and c
7p 7p 7p
only MIN-type tumors. The
7q 7q 7q
mean frequency is expressed as
percentage (x-axis) and shown 8p 8p 8p
as red bars for DNA losses (left 8q 8q 8q
bars) and as green bars for 9p 9p 9p
DNA gains (right bars) 9q 9q 9q
10p 10p 10p
10q 10q 10q
11p 11p 11p
11q 11q 11q
12p 12p 12p
12q 12q 12q
13q 13q 13q
14q 14q 14q
15q 15q 15q
16p 16p 16p
16q 16q 16q
17p 17p 17p
17q 17q 17q
18p 18p 18p
18q 18q 18q
19p 19p 19p
19q 19q 19q
20p 20p 20p
20q 20q 20q
21q 21q 21q
22q 22q 22q
Xp Xp Xp
Xq Xq Xq
Yq Yq YqJ Mol Med (2007) 85:293–304 299
Analysis of all DNA copy number changes from the 22 Comparison of aCGH profiles between CIN- and MIN-type
tumor DNAs showed that chromosomal regions known to be colorectal cancers
affected in colorectal cancers (metaphase CGH [6, 11–16])
were also identified in the present aCGH approach. Thus, Upon separate evaluation of the CIN- and MIN-type tumor
aCGH revealed frequent DNA gains at 20q, 13q, 8q, and 7p aCGH profiles, differences were observed between the two
and losses at 18q, 17p, and 8p (Fig. 3a) and specifically groups for the frequency of DNA gains and losses at
pinpointed oncogenes and tumor suppressor genes located specific chromosomal regions and for gene-specific ampli-
within these chromosomal regions (Tables 2 and 3). fications and deletions (Fig. 3b,c, Tables 2 and 3).
With respect to the frequency of specific chromo-
somal regions, those previously associated with colorec-
tal tumors by mCGH [6, 11–16], i.e., DNA gains at 20q,
Table 2 Gene-specific DNA amplifications detected in sporadic 13q, 8q, and 7p and losses at 18q, 17p, and 8p, were more
colorectal carcinomas by aCGH
often observed in CIN-type (Fig. 3b), but less in MIN-
Gene name Location CRC CIN MIN type (Fig. 3c) tumors. In particular, DNA gains at 20q
were detected at a frequency of 36–64% in CIN-type, but
U32389 2p tel 36.36 36.36 36.36 only 9–27% in MIN-type tumors; DNA gains at 13q were
D5S23 5p15.2 31.82 27.27 36.36
identified at a frequency of 45–54% in CIN- and only 18–
G31341 7p tel 36.36 45.45 27.27
IL6 7p21 36.36 54.55 18.18
36% in MIN-type tumors; DNA amplifications at 7pq
RFC2, CYLN2 7q11.23 36.36 63.64 9.09 were seen at a frequency of 9–72% in CIN- and only 9–
MET 7q31 22.73 36.36 9.09 27% in MIN-type tumors and DNA losses at 17p occurred
7QTEL20 7q tel 40.91 72.73 9.09 at 18–55% in CIN- and only 9–18% in MIN-type tumors.
D8S596 8p tel 22.73 36.36 9.09 Moreover, aCGH allowed the identification of specific
E2F5 8p22–q21.3 36.36 27.27 45.45 target sequences within these differentially altered chromo-
EXT1 8q24.11–q24.13 31.82 45.45 18.18 somal regions. Thus, genes preferentially altered within the
MYC 8q24.12–q24.13 36.36 45.45 27.27
AFM137XA11 9p11.2 40.91 36.36 45.45
INS 11p tel 31.82 27.27 36.36 Table 3 Gene-specific DNA deletions detected in sporadic colorectal
carcinomas by aCGH
GARP 11q13.5–q14 31.82 18.18 45.45
ATM 11q22.3 27.27 18.18 36.36 Name Location CRC CIN MIN
BRCA2 13q12–q13 36.36 54.55 18.18
RB1 13q14 40.91 45.45 36.36 3PTEL25 3p tel 13.64 0.00 27.27
D13S319 13q14.2 36.36 45.45 27.27 RAF1 3p25 13.64 0.00 27.27
D13S25 13q14.3 36.36 54.55 18.18 THRB 3p24.3 31.82 36.36 27.27
WI-5214 15q tel 31.82 27.27 36.36 PDGRL 8p22–p21.3 22.73 18.18 27.27
16PTEL03 16p tel 31.82 27.27 36.36 LPL 8p22 22.73 27.27 18.18
DCC 18q21.3 31.82 27.27 36.36 EGR2 10q21.3 22.73 27.27 18.18
20PTEL18 20p tel 27.27 36.36 18.18 DMBT1 10q25.3–q26.1 22.73 27.27 18.18
TOP1 20q12–q13.1 31.82 54.55 9.09 WI-6509 11q tel 22.73 27.27 18.18
NCOA3 (AIB1) 20q12 31.82 54.55 9.09 MAP2K5 15q23 31.82 45.45 18.18
MYBL2 20q13.1 31.82 54.55 9.09 282M15/SP6 17p tel 22.73 27.27 18.18
CSE1L (CAS) 20q13 27.27 45.45 9.09 HIC1 17p13.3 31.82 45.45 18.18
PTPN1 20q13.1–q13.2 22.73 36.36 9.09 LLGL1 17p12–17p11.2 36.36 54.55 18.18
STK6 (STK15) 20q13.2–q13.3 36.36 54.55 18.18 FLI, TOP3A 17p12–17p11.2 22.73 27.27 18.18
ZNF217 (ZABC1) 20q13.2 31.82 45.45 18.18 SHGC17327 18p tel 27.27 27.27 27.27
CYP24 20q13.2 36.36 54.55 18.18 LAMA3 18q11.2 13.64 27.27 0.00
TNFRSF6B (DCR3) 20q13 31.82 36.36 27.27 DCC 18q21.3 18.18 9.09 27.27
TPD52L2, TOM 20q tel 27.27 45.45 9.09 BCL2 3′ 18q21.3 22.73 18.18 27.27
20QTEL14 20q tel 40.91 63.64 18.18 CTDP1, 18q tel 45.45 45.45 45.45
KAL Xp22.3 36.36 27.27 45.45 SHGC-145820
XIST Xq13.2 36.36 27.27 45.45 PCNT2 (KEN) 21q tel 18.18 9.09 27.27
SRY Yp11.3 36.36 36.36 36.36 STS 3′ Xp22.3 22.73 18.18 27.27
AZFa region Yq11 31.82 36.36 27.27 SRY Yp11.3 27.27 18.18 36.36
The frequency of DNA amplification occurring at a specific target The frequency of DNA deletion occurring at a specific target sequence
sequence is shown in percent (n/N cases×100). Only alterations is shown in percent (n/N cases×100). Only alterations occurring in
occurring in at least 30% of the cases are listed. at least 20% of the cases are listed.
CRC All 22 sCRC cases, CIN CIN-type tumors (n=11), MIN CRC All 22 sCRC, CIN CIN-type tumors (n=11), MIN MIN-type
MIN-type tumors (n=11) tumors (n=11)300 J Mol Med (2007) 85:293–304
identified CIN-tumor-associated chromosomal regions Several other studies have investigated CIN- and MIN-
(20q, 13q, 7pq, and 17p) included DNA amplifications of type colorectal cancers with respect to their mRNA
eight genes on chromosome 20q (TOP1, AIB1, MYBL2, expression profiles using cDNA microarrays [19–23] or to
CAS, PTPN1, STK15, ZNF217, and CYP24), two genes on genome-wide DNA copy number changes using aCGH
chromosome 13q (BRCA2 and D13S25), and three genes [24–26] or the relationship between aCGH and cDNA
on chromosome 7 (IL6, CYLN2, and MET) as well as profiles [32]. Besides contributing to a better understanding
DNA deletions of two genes on chromosome 17p (HIC1 of colorectal carcinogenesis and progression, such studies
and LLGL1) (Tables 2 and 3). may become of relevance for dissection of the differential
Finally, additional differences of gene-specific DNA clinical responses of CIN- and MIN-type colorectal tumors
amplifications and deletions between CIN- and MIN-type to particular chemotherapeutic agents, such as 5-FU [29].
tumors were observed at other chromosomal regions than One major pitfall of these studies is the use of inhomoge-
20q, 13q, 7pq, and 17p (Tables 2 and 3): CIN-tumor- neous patient groups (e.g., sporadic and familiar cases) and
associated DNA amplifications were identified for EXT1 DNA extracted from tissue samples without prior micro-
(8q24.11) and MYC (8q24.12) as well as DNA deletions dissection. However, the latter is especially important for
for MAP2K5 (15q23) and LAMA3 (18q11.2). In contrast, the detection of tumor-cell-specific DNA alterations be-
distinct MIN-tumor-associated DNA amplifications were cause cancer resection specimens contain a highly variable
detected for E2F5 (8p22–q21.3), GARP (11q13.5–q14), number of tumor cells and associated stromal components.
ATM (11q22.3), KAL (Xp22.3), XIST (Xq13.2), and DNA Our study aim was therefore to provide a genome-wide
deletions for RAF1 (3p25), DCC (18q21.3), and KEN profile of tumor-cell-specific DNA copy number changes in
(21q tel). sCRC and to define CIN- and MIN-type-specific oncogenes
and tumor suppressor genes, which most likely contribute
Validation of aCGH findings by FISH to the deregulation of functional pathways as those seen on
the mRNA level by cDNA microarrays. To achieve this, we
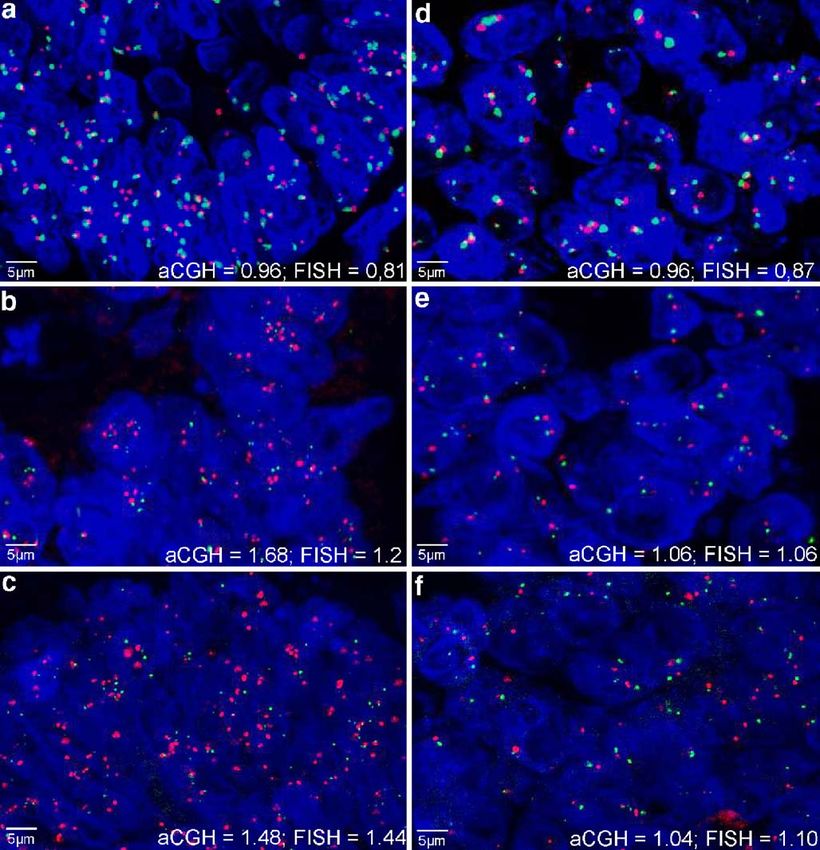
To validate aCGH findings, FISH analysis of three selected included an equal number of previously well characterized
genes was performed on serial tissues as those used for CIN- and MIN-type sCRC [27]. Second, we used an aCGH
aCGH, including one gene showing normal DNA copy approach with a small number (287) of target sequences
numbers in CIN- and MIN-type tumors (EGFR on [28] to avoid a potential bias introduced by large-scale
chromosome 7p) and two genes (STK15 and ZNF217) screening of DNA alterations in small sample series.
on chromosome 20q, which were differentially altered in Besides telomeric sequences and microsatellite markers,
CIN- and MIN-type tumors. Representative FISH images these target sequences included mostly known oncogenes
are shown with corresponding aCGH data and FISH and tumor suppressor genes, which readily allowed candi-
ratios for two cases (#14=CIN and #16=MIN, see also date-specific validation. Third, aCGH was applied to
Table 1) for each of the three genes in Fig. 4. Normal microdissected matched normal colorectal epithelium and
DNA copy numbers of EGFR as determined by aCGH in invasive tumor cells from 22 surgically resected, formalin-
both CIN- and MIN-type tumors corresponded to normal fixed, and paraffin-embedded tissue specimens. Fourth, we
EGFR copy numbers or polyploidy of chromosome 7 by used reference DNA extracted from normal colorectal
FISH (Fig. 4a,d). Preferential amplification of STK15 epithelium of the same resection specimens and hence
(Fig. 4b,e) and ZNF217 (Fig. 4c,f) in CIN-type tumors as tissues that had been equally processed as microdissected
determined by aCGH was confirmed by FISH analysis. tumor cells. This avoided potential false positive or false
Note that aCGH data and FISH ratios are different negative results due to differential quality of test and
parameters, as aCGH is based on a comparative analysis reference DNAs. Finally, FISH validation of three genes
of DNA extracted from normal colorectal epithelium was performed on serial tissues as those used for aCGH.
and microdissected tumor cells, whereas FISH is a direct By doing this, aCGH profiles obtained from the 22
cell-specific analysis and quantification is different for the sporadic colorectal carcinomas, irrespective of their CIN or
two methods (“Materials and methods”). MIN status, confirmed DNA gains at 20q, 13q, 8q, and 7p
and losses at 18q, 17p, and 8p chromosomal regions also
previously reported by metaphase CGH [6, 11–16] and
Discussion recent aCGH studies [24–26]. However, chromosomal
regions 20q, 13q, 7, and 17p were preferentially altered in
To our knowledge, the present study is the first to have CIN-type tumors. Novel candidate oncogenes and tumor
analyzed DNA copy number changes of a large series of suppressor genes located within these CIN-type tumor-
mostly known oncogenes and tumor suppressor genes in associated chromosomal regions were identified and in-
CIN and MIN unstable sporadic colorectal carcinomas. cluded the amplified genes TOP1, AIB1, MYBL2, CAS,J Mol Med (2007) 85:293–304 301 Fig. 4 Validation of aCGH data by FISH analysis. FISH images of cases without DNA copy number changes in aCGH (a, d, e, f), but a two representative cases, one CIN-type (case 14, a–c) and one MIN- slight dislocation of gene- and centromere-specific signals for cases type (case 16, d–f) tumor are shown for three genes. FISH was with DNA amplification (b, c). Subpanels a and d demonstrate that performed as in “Materials and methods,” with gene-specific probes “normal” copy numbers of EGFR on chromosome 7p12, as determined detected as red signals and centromere-specific probes as green by aCGH, were due to polyploidy in both CIN-type (a) and MIN-type signals. Both aCGH data and FISH ratios (gene- to centromere- (d) tumors. Subpanels b, c, e, and f show that the preferential STK15 specific signals, “Materials and methods”) are given for each case. and ZNF217 gene amplification on chromosome 20q in CIN-type Note that aCGH and FISH values cannot be directly compared tumors as seen by aCGH was confirmed by STK15-specific (b) and (“Results”). Note also that there is a close structural association ZNF217-specific (c) FISH analysis in CIN-type, but not MIN-type between gene- and centromere-specific signals of FISH analysis for tumors [STK15 (e) and ZNF217 (f)]
302                                                                                                     J Mol Med (2007) 85:293–304

PTPN1, STK15, ZNF217, and CYP24 on chromosome                     the WNT pathway in model system [42, 43]. In fact,
20q, BRCA2 and D13S25 on chromosome 13q and IL6,                  Schimanski et al. [44] recently showed that downregulation
CYLN2, and MET on chromosome 7 as well as the deleted             of LLGL1 appears to contribute to progression of human
genes HIC1 and LLGL1 on chromosome 17p. Furthermore,              colorectal cancer. However, the detailed functional effect of
additional CIN-tumor-associated gene amplifications were          the differential DNA copy number changes of HIC1 and
identified for EXT1 (8q24.11) and MYC (8q24.12) and               LLGL1 in CIN- and MIN-type colorectal tumors and their
gene deletions for MAP2K5 (15q23) and LAMA3                       potential cross-talk to the p53 and WNT pathways remain
(18q11.2). In contrast, distinct MIN-tumor-associated             to be resolved.
DNA amplifications were detected for E2F5 (8p22–                     In conclusion, aCGH revealed distinct DNA copy
q21.3), GARP (11q13.5–q14), ATM (11q22.3), KAL                    number changes between sporadic CIN- and MIN-associ-
(Xp22.3), and XIST (Xq13.2) and DNA deletions for                 ated colorectal carcinomas. A differential role of these
RAF1 (3p25), DCC (18q21.3), and KEN (21q tel).                    candidate oncogenes and tumor suppressor genes in tumor
    The preferential amplification of 8/11 investigated target    development and progression of sporadic CIN and MIN
sequences on 20q in CIN tumors is of particular interest,         CRC is likely and may also be involved in the response or
especially as the relevance of this amplicon in colorectal        resistance to therapeutic interventions, such as shown for
cancer is supported by other studies of early dysplastic          microsatellite instability and 5-FU [29].
lesions [6, 15] and colorectal liver metastasis [6, 14]. Of
these eight amplified candidate genes, three (STK15,
ZNF217, and CYP24) had also been detected in colorectal
carcinomas in an independent aCGH study [26], but
without showing differences between CIN- and MIN-type             References
tumors. Whereas little is known about the functional role
of ZNF217 and CYP24 in colorectal cancer, STK15
                                                                   1. Gebhart E, Liehr T (2000) Patterns of genomic imbalances in
(20q13.2, Aurora-A) is a known oncogene [33] and over-                human solid tumors. Int J Oncol 16:383–399
expression of this centrosome-associated kinase was                2. Ried T, Heselmeyer-Haddad K, Blegen H, Schrock E, Auer G
detected in genetic instable solid tumors [34, 35],                   (1999) Genomic changes defining the genesis, progression, and
                                                                      malignancy potential in solid human tumors: a phenotype/
including colorectal cancer [36, 37]. Moreover, our own
                                                                      genotype correlation. Genes Chromosomes Cancer 25:195–204
studies [27] showed higher STK15-specific mRNA expres-             3. Fridlyand J, Snijders AM, Ylstra B, Li H, Olshen A, Segraves R,
sion in CIN- than MIN-type colorectal tumors. Together, it            Dairkee S, Tokuyasu T, Ljung BM, Jain AN, McLennan J, Ziegler
is therefore likely that the preferential overexpression of           J, Chin K, Devries S, Feiler H, Gray JW, Waldman F, Pinkel D,
                                                                      Albertson DG (2006) Breast tumor copy number aberration
STK15 mRNA in sporadic CIN-type tumors is the result of
                                                                      phenotypes and genomic instability. BMC Cancer 6:96
STK15-specific DNA amplification. Further investigations           4. Lin M, Smith LT, Smiraglia DJ, Kazhiyur-Mannar R, Lang JC,
of the mechanisms of STK15 gene alterations and associ-               Schuller DE, Kornacker K, Wenger R, Plass C (2006) DNA copy
ated STK15 mRNA and protein expression in CIN- and                    number gains in head and neck squamous cell carcinoma.
                                                                      Oncogene 25:1424–1433
MIN-type colorectal tumors and dysplastic precursor
                                                                   5. Zitzelsberger H, Engert D, Walch A, Kulka U, Aubele M, Hofler
lesions will also be of high clinical relevance in view of            H, Bauchinger M, Werner M (2001) Chromosomal changes
the novel therapeutic strategies of Aurora kinase inhibition          during development and progression of prostate adenocarcinomas.
[38, 39].                                                             Br J Cancer 84:202–208
                                                                   6. Diep CB, Kleivi K, Ribeiro FR, Teixeira MR, Lindgjaerde OC,
    Another highly relevant finding of the present aCGH
                                                                      Lothe RA (2006) The order of genetic events associated with
study relates to the 17p chromosomal region. The involve-             colorectal cancer progression inferred from meta-analysis of copy
ment of this chromosomal region in colorectal cancer, in              number changes. Genes Chromosomes Cancer 45:31–41
particular the p53 gene (17p13.1), was extensively studied.        7. Richter H, Slezak P, Walch A, Werner M, Braselmann H,
                                                                      Jaramillo E, Ost A, Hirata I, Takahama K, Zitzelsberger H
The present study has now shown the preferential loss of
                                                                      (2003) Distinct chromosomal imbalances in nonpolypoid and
this region in CIN-type colorectal tumors and has pin-                polypoid colorectal adenomas indicate different genetic pathways
pointed two novel candidate genes, HIC1 (17p13.3) and                 in the development of colorectal neoplasms. Am J Pathol
LLGL1 (17p12), preferentially deleted in CIN-type tumors.             163:287–294
                                                                   8. Hermsen M, Postma C, Baak J, Weiss M, Rapallo A, Sciutto
It is interesting to note that HIC1 encodes for a transcription
                                                                      A, Roemen G, Arends JW, Williams R, Giaretti W, De Goeij
factor that can interact with p53-induced cellular functions          A, Meijer G (2002) Colorectal adenoma to carcinoma pro-
and mice with a heterogeneous disruption of HIC1 that                 gression follows multiple pathways of chromosomal instability.
spontaneously develop epithelial tumors (male) and soft               Gastroenterology 123:1109–1119
                                                                   9. Jass JR, Whitehall VL, Young J, Leggett BA (2002) Emerging
tissue tumors and lymphomas (female) [40, 41]. In contrast,
                                                                      concepts in colorectal neoplasia. Gastroenterology 123:862–876
LLGL1 encodes for a structural protein, which contributes         10. Fearon ER, Vogelstein B (1990) A genetic model for colorectal
to cellular polarity and which was shown to interact with             tumorigenesis. Cell 61:759–767
J Mol Med (2007) 85:293–304 303
11. Aragane H, Sakakura C, Nakanishi M, Yasuoka R, Fujita Y, 25. Jones AM, Douglas EJ, Halford SE, Fiegler H, Gorman PA,
Taniguchi H, Hagiwara A, Yamaguchi T, Abe T, Inazawa J, Roylance RR, Carter NP, Tomlinson IP (2005) Array-CGH analysis
Yamagishi H (2001) Chromosomal aberrations in colorectal of microsatellite-stable, near-diploid bowel cancers and comparison
cancers and liver metastases analyzed by comparative genomic with other types of colorectal carcinoma. Oncogene 24:118–129
hybridization. Int J Cancer 94:623–629 26. Nakao K, Mehta KR, Fridlyand J, Moore DH, Jain AN, Lafuente
12. Rooney PH, Boonsong A, McKay JA, Marsh S, Stevenson DA, A, Wiencke JW, Terdiman JP, Waldman FM (2004) High-
Murray GI, Curran S, Haites NE, Cassidy J, McLeod HL (2001) resolution analysis of DNA copy number alterations in colo-
Colorectal cancer genomics: evidence for multiple genotypes rectal cancer by array-based comparative genomic hybridization.
which influence survival. Br J Cancer 85:1492–1498 Carcinogenesis 25:1345–1357
13. De Angelis PM, Clausen OP, Schjolberg A, Stokke T (1999) 27. Gerlach U, Kayser G, Walch A, Hopt U, Schulte-Monting J,
Chromosomal gains and losses in primary colorectal carcinomas Werner M, Lassmann S (2006) Centrosome-, chromosomal-
detected by CGH and their associations with tumour DNA ploidy, passenger- and cell-cycle-associated mRNAs are differentially
genotypes and phenotypes. Br J Cancer 80:526–535 regulated in the development of sporadic colorectal cancer. J
14. Korn WM, Yasutake T, Kuo WL, Warren RS, Collins C, Tomita Pathol 208:462–472
M, Gray J, Waldman FM (1999) Chromosome arm 20q gains 28. Albrecht B, Hausmann M, Zitzelsberger H, Stein H, Siewert JR,
and other genomic alterations in colorectal cancer metastatic to Hopt U, Langer R, Hofler H, Werner M, Walch A (2004) Array-
liver, as analyzed by comparative genomic hybridization and based comparative genomic hybridization for the detection of
fluorescence in situ hybridization. Genes Chromosomes Cancer DNA sequence copy number changes in Barrett’s adenocarcino-
25:82–90 ma. J Pathol 203:780–788
15. Meijer GA, Hermsen MA, Baak JP, van Diest PJ, Meuwissen 29. Sobin Lh, Wittekind C (eds) (2002) TNM classification of
SG, Belien JA, Hoovers JM, Joenje H, Snijders PJ, Walboomers malignant tumours, 6th edn. UICC and Wiley-Liss, New York
JM (1998) Progression from colorectal adenoma to carcinoma 30. Hamilton S, Aaltonen L (eds) (2000) Pathology and genetics of
is associated with non-random chromosomal gains as detected tumors of the digestive system. WHO Classification of Tumors.
by comparative genomic hybridisation. J Clin Pathol 51:901– IARC, Lyon
909 31. Tsafrir D, Bacolod M, Selvanayagam Z, Tsafrir I, Shia J, Zeng Z,
16. Ried T, Knutzen R, Steinbeck R, Blegen H, Schrock E, Liu H, Krier C, Stengel RF, Barany F, Gerald WL, Paty PB,
Heselmeyer K, du Manoir S, Auer G (1996) Comparative Domany E, Notterman DA (2006) Relationship of gene expres-
genomic hybridization reveals a specific pattern of chromosomal sion and chromosomal abnormalities in colorectal cancer. Cancer
gains and losses during the genesis of colorectal tumors. Genes Res 66:2129–2137
Chromosomes Cancer 15:234–245 32. Meyers M, Wagner MW, Hwang HS, Kinsella TJ, Boothman DA
17. Lengauer C, Kinzler KW, Vogelstein B (1997) Genetic instability (2001) Role of the hMLH1 DNA mismatch repair protein in
in colorectal cancers. Nature 386:623–627 fluoropyrimidine-mediated cell death and cell cycle responses.
18. Sugai T, Takahashi H, Habano W, Nakamura S, Sato K, Orii S, Cancer Res 61:5193–5201
Suzuki K (2003) Analysis of genetic alterations, classified 33. Zhou H, Kuang J, Zhong L, Kuo WL, Gray JW, Sahin A,
according to their DNA ploidy pattern, in the progression of Brinkley BR, Sen S (1998) Tumour amplified kinase STK15/
colorectal adenomas and early colorectal carcinomas. J Pathol BTAK induces centrosome amplification, aneuploidy and trans-
200:168–176 formation. Nat Genet 20:189–193
19. Giacomini CP, Leung SY, Chen X, Yuen ST, Kim YH, Bair E, 34. Li D, Zhu J, Firozi PF, Abbruzzese JL, Evans DB, Cleary K,
Pollack JR (2005) A gene expression signature of genetic Friess H, Sen S (2003) Overexpression of oncogenic STK15/
instability in colon cancer. Cancer Res 65:9200–9205 BTAK/Aurora A kinase in human pancreatic cancer. Clin Cancer
20. Kruhoffer M, Jensen JL, Laiho P, Dyrskjot L, Salovaara R, Res 9:991–997
Arango D, Birkenkamp-Demtroder K, Sorensen FB, Christensen 35. Miyoshi Y, Iwao K, Egawa C, Noguchi S (2001) Association of
LL, Buhl L, Mecklin JP, Jarvinen H, Thykjaer T, Wikman FP, centrosomal kinase STK15/BTAK mRNA expression with chro-
Bech-Knudsen F, Juhola M, Nupponen NN, Laurberg S, Andersen mosomal instability in human breast cancers. Int J Cancer
CL, Aaltonen LA, Orntoft TF (2005) Gene expression signatures 92:370–373
for colorectal cancer microsatellite status and HNPCC. Br J 36. Bischoff JR, Anderson L, Zhu Y, Mossie K, Ng L, Souza B,
Cancer 92:2240–2248 Schryver B, Flanagan P, Clairvoyant F, Ginther C, Chan CS,
21. Mori Y, Yin J, Sato F, Sterian A, Simms LA, Selaru FM, Novotny M, Slamon DJ, Plowman GD (1998) A homologue of
Schulmann K, Xu Y, Olaru A, Wang S, Deacu E, Abraham JM, Drosophila aurora kinase is oncogenic and amplified in human
Young J, Leggett BA, Meltzer SJ (2004) Identification of genes colorectal cancers. EMBO J 17:3052–3065
uniquely involved in frequent microsatellite instability colon 37. Takahashi T, Futamura M, Yoshimi N, Sano J, Katada M, Takagi
carcinogenesis by expression profiling combined with epigenetic Y, Kimura M, Yoshioka T, Okano Y, Saji S (2000) Centrosomal
scanning. Cancer Res 64:2434–2438 kinases, HsAIRK1 and HsAIRK3, are overexpressed in primary
22. Dunican DS, McWilliam P, Tighe O, Parle-McDermott A, Croke colorectal cancers. Jpn J Cancer Res 91:1007–1014
DT (2002) Gene expression differences between the microsatellite 38. Keen N, Taylor S (2004) Aurora-kinase inhibitors as anticancer
instability (MIN) and chromosomal instability (CIN) phenotypes agents. Nat Rev Cancer 4:927–936
in colorectal cancer revealed by high-density cDNA array 39. Harrington EA, Bebbington D, Moore J, Rasmussen RK,
hybridization. Oncogene 21:3253–3257 Ajose-Adeogun AO, Nakayama T, Graham JA, Demur C,
23. Birkenkamp-Demtroder K, Christensen LL, Olesen SH, Hercend T, Diu-Hercend A, Su M, Golec JM, Miller KM
Frederiksen CM, Laiho P, Aaltonen LA, Laurberg S, Sorensen (2004) VX-680, a potent and selective small-molecule inhibitor
FB, Hagemann R, ORntoft TF (2002) Gene expression in colo- of the Aurora kinases, suppresses tumor growth in vivo. Nat
rectal cancer. Cancer Res 62:4352–4363 Med 10:262–267
24. Camps J, Armengol G, Del Rey J, Lozano JJ, Vauhkonen H, Prat 40. Wales MM, Biel MA, el Deiry W, Nelkin BD, Issa JP, Cavenee
E, Egozcue J, Sumoy L, Knuutila S, Miro R (2006) Genome-wide WK, Kuerbitz SJ, Baylin SB (1995) p53 activates expression of
differences between microsatellite stable and unstable colorectal HIC-1, a new candidate tumour suppressor gene on 17p13.3. Nat
tumors. Carcinogenesis 27:419–428 Med 1:570–577304 J Mol Med (2007) 85:293–304
41. Chen WY, Zeng X, Carter MG, Morrell CN, Chiu Yen RW, Esteller 43. Dollar GL, Weber U, Mlodzik M, Sokol SY (2005) Regulation of
M, Watkins DN, Herman JG, Mankowski JL, Baylin SB (2003) Lethal giant larvae by Dishevelled. Nature 437:1376–1380
Heterozygous disruption of Hic1 predisposes mice to a gender- 44. Schimanski CC, Schmitz G, Kashyap A, Bosserhoff AK, Bataille
dependent spectrum of malignant tumors. Nat Genet 33:197–202 F, Schafer SC, Lehr HA, Berger MR, Galle PR, Strand S, Strand
42. Bilder D, Li M, Perrimon N (2000) Cooperative regulation of cell D (2005) Reduced expression of Hugl-1, the human homologue
polarity and growth by Drosophila tumor suppressors. Science of Drosophila tumour suppressor gene lgl, contributes to progres-
289:113–116 sion of colorectal cancer. Oncogene 24:3100–3109You can also read