Gauging the Labour Force Pulse 2019 - Centre for Workforce Development
←
→
Page content transcription
If your browser does not render page correctly, please read the page content below

2019
Local Labour Market Plan

                              Gauging the
                           Labour Force Pulse
                           An update to the 2018 — 2021 Strategic
                              Workforce Development Plan for
                               Hastings, Prince Edward and
                              Lennox and Addington Counties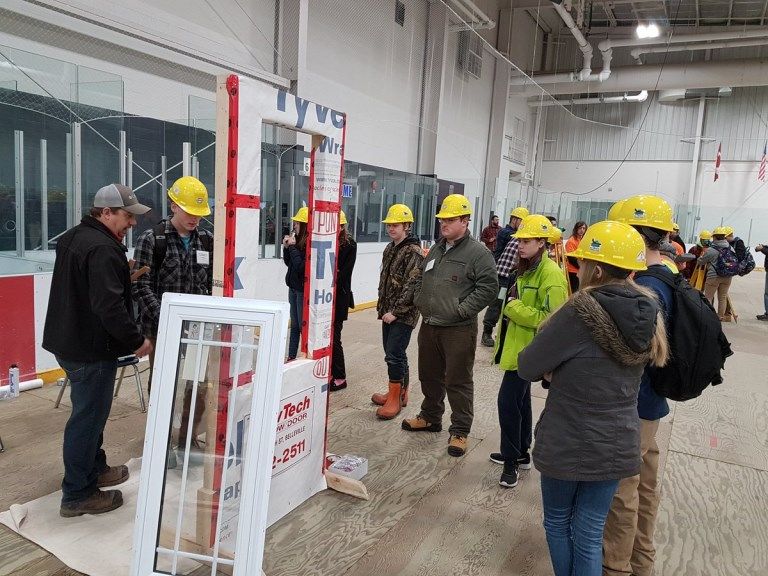
Centre for Workforce Development

    The Centre for Workforce Development is governed by a volunteer Board of Directors. They
    provide vital direction to the activities of the Board as well as important input to addressing
    local labour force issues.
    Francis Cadeau, Co-Chair        Jeremy Braithwaite, Director      Warren Maracle, Director
    Mike Whitaker, Co-Chair         Maddison Ellis, Director          Michelle Michaud, Director
    Heather Bossa, Secretary        Craig Ervine, Director            Derek Morgan, Director
    Jennifer Latham, Treasurer      Dale Hoard, Director              Maureen Rump, Director

     This project is funded in part by the Government of Canada and the
                            Government of Ontario.

The material contained in this report has been prepared by Centre for Workforce Development
(CFWD) and is drawn from a variety of sources considered to be reliable. We make no
representation or warranty, explicit or implied, as to its accuracy or completeness. In providing this
material, CFWD does not assume any responsibility or liability. The views expressed do not
necessarily reflect those of the Government of Canada or the Government of Ontario.

                                                                                                         2
ACKNOWLEDGEMENTS

The past year has seen a number of changes and announcements including the rebranding
of the East Central Ontario Training Board (ECOTB) to Centre for Workforce Development
(CFWD). This new brand speaks clearly about who we are and what we are working on in
the community. The Board’s new website has made it much easier for the community to
understand the projects we are working on and identify labour market resources available to
them.
Understanding the local labour market continues to pose challenges for all involved. The
rural communities within Hastings, Prince Edward and Lennox and Addington sit within a
larger Economic Region where data is often difficult to identify and utilize. CFWD uses as
much local data as possible and combines this with community and partner conversations
over the year as well as industry specific consultations. All this pooled information is used to
guide implementing actions identified in the 2018—2021 three-year strategic Local Labour
Market Plan (LLMP).
The continued input from employers, Chambers of Commerce, Economic Development,
Mohawks of the Bay of Quinte, business associations and key community organizations has
been a valuable resource in helping determine the best way to address the actions outlined
in the LLMP.
As well, working with our Employment Ontario Service Providers, members of the Quinte
Employment Network and Prince Edward County Employment Network have provided a
sound foundation in understanding job seeker needs.
Youth are our future workforce. The solid partnerships CFWD has formed with Hastings and
Prince Edward District School Board, Algonquin Lakeshore District School Board, Limestone
District School Board, École Secondaire Publique Marc-Garneau, Sir James Whitney School
for the Deaf and Loyalist College have been key to sharing future workforce needs with local
youth. Additionally, our role in Youth Collective Impacts in Prince Edward and Hastings
County have helped us understand youth struggles.
To all our partners in the community, the staff and Board of Directors of CFWD say “Thank
You!”. It would not be possible to carry out the work of the Board without you at our side.

                                                                                                   3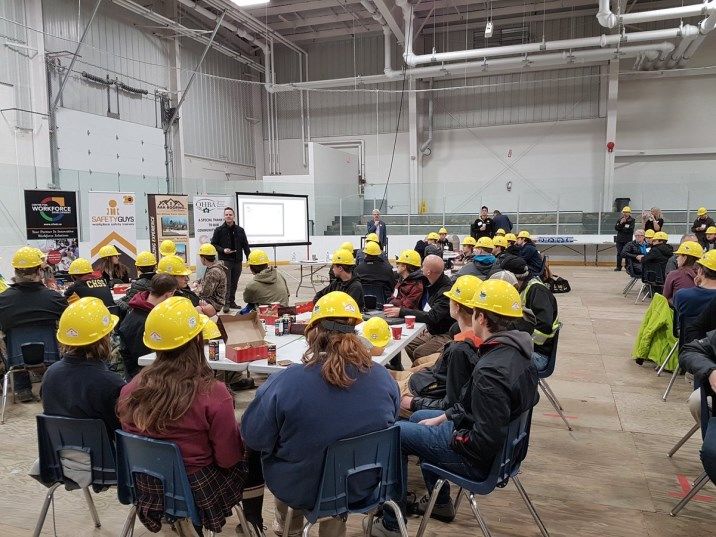
Table of Contents

Acknowledgements ····································································· 3
Executive Summary ···································································· 5
Unemployment Rate Update ························································· 6
Participation Rate Update ····························································· 7
Business Count Update
  Hastings County ······································································· 8
  Prince Edward County ······························································· 9
  Lennox and Addington County····················································· 10
Health Care Industry ··································································· 11
Tourism Industry ········································································· 13
Construction Industry ··································································· 14
Employment Ontario Programs
Apprenticeships·········································································· 15
Canada—Ontario Job Grant ·························································· 16
Employment Services ·································································· 18
Literacy and Basic Skills (LBS) ······················································ 22
Ontario Employment Assistance Service (OEAS)······························· 25
Second Career ··········································································· 26
Youth Job Connection (YJC) ························································· 27
Long Range Actions – Year One Implementation Update ···················· 28
Conclusions··············································································· 34
Special Thanks ·········································································· 35

                                                                                                4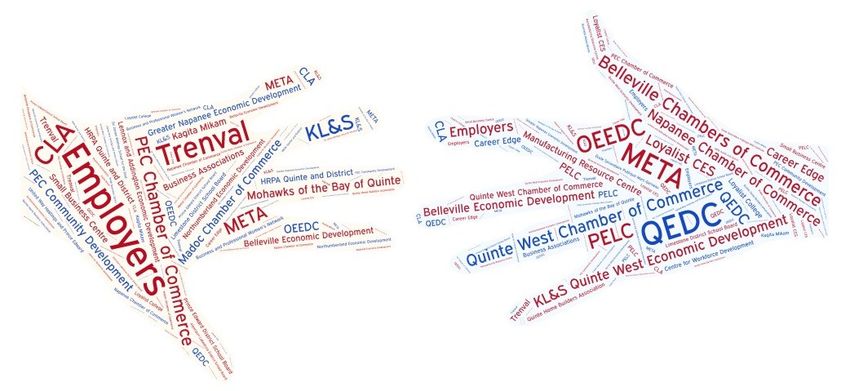
EXECUTIVE SUMMARY
“If you want to go fast, you go alone. If you want to go far, you go together”. This African
proverb is often quoted by Mayor Jim Harrison of Quinte West and it has stuck with me
ever since I heard him use it. The Centre for Workforce Development (CFWD) wants to
see businesses, job seekers, entrepreneurs and youth go far in this community through
collaborative efforts. Whether you are from Bancroft, Picton, Trenton, Belleville, Madoc,
Tweed, Napanee, Mohawks of the Bay of Quinte or another community in Hastings, Prince
Edward and Lennox and Addington Counties, we need to move forward together on our
labour force issues if we are to accomplish the goals the community has set out in the
Local Labour Market Plan.
The 2018-2021 three-year strategic Local Labour Market Plan (LLMP) focused on current
labour market conditions, community profiles of all three Counties and long range actions
to address labour force issues identified. Over the past several months, CFWD partnered
on a number of activities that have begun to address the goals and actions outlined. These
efforts are just the beginning. The Board is continuing this work throughout the 2019 – 20
fiscal year as we focus on three areas that require more detailed research.
This LLMP Update will identify the actions that have been worked on in 2018 – 19 and the
results of the work to date. Not every goal and action saw activity associated with them,
however, discussions with community partners continue on developing opportunities to
tackle them.
In addition to the update of the Action Plan goals and activities table, this LLMP update will
focus on the three key areas: Tourism, Construction and Health Care.
The Employment Ontario Service Provider program updates are once again included as
part of keeping the community informed of the substantial work they are doing to help both
job seekers and employers focus on their workforce development needs.
Since we want this community to “go far”, I invite you to be a part of helping the community
move forward in addressing labour force needs. Read this report! Provide feedback! Get
involved!

Brad Labadie
Executive Director
Centre for Workforce Development

                                                                                                 5
UNEMPLOYMENT RATE UPDATE
    In the LLMP released in February 2018, the two-year averaged unemployment rate covering 2001 to 2016 for Hastings, Prince
    Edward and Lennox and Addington Counties was shared. It was compared to the larger Economic Region of Kingston-
    Pembroke, Ontario and Canada. This table is an update of that data and has been shortened to cover 2008 to 2018. As before,
    the unemployment rate is relatively close to the other areas of comparison.

                                                                                                Unemployment Rates 2008-2018
                                                                                                     Two Year Averaging
                                10

                                9.5

                                                            9.4         8.9
                                 9

                                8.5                                                    8.3
                                                          8.2
                                                                                                                                              8.7                         8.4
                                                                         8.4                                7.9
                                                                                7.8                                           7.8                     7.8
                                 8     8.2
                                                                                                7.4                                                                                 7.8
                                                                                                      7.6         7.4
                                             7.9            8.1                                                                                      7.5
                                7.5
                                                                               7.7                                                                                7.1
                                                                                                                                                                                                  7.0
                                      7.2
                                 7                  7.2                                       7.3                       7.2                                                                                      6.7

        Unemployment Rate (%)
                                                                                                                                  7.2
                                                                                                                                               7.0          6.9                                   6.7
                                                                                                                                                                                                           6.3
                                6.5                                                                                                                                             6.5                                    6.1

                                                                                                                                                                                                                 5.9
                                 6                                                                                                                                                          6.6                                        5.8

                                                                                                                                                                                                                                 5.5
                                5.5
                                                                                                                                                                                                                 5.9
                                                                                                                                                                                                                                 5.3
                                 5
                                            08-09           09-10              10-11            11-12                     12-13             13-14                 14-15                   15-16              16-17       17-18

                                                                  Lennox and Addington, Hastings, Prince Edward                   Kingston-Pembroke [3515]                Ontario                 Canada

    Source: Statistics Canada, Labour Force Survey, Special Tabulations

6
PARTICIPATION RATE UPDATE
    In the LLMP released in February 2018, the two-year averaged participation rate covering 2001 to 2016 for Hastings, Prince Edward
    and Lennox and Addington Counties was also shared. It was compared to the larger Economic Region of Kingston-Pembroke,
    Ontario and Canada. This table is an update of that data and has been shortened to cover 2008 to 2018. Unlike the unemployment
    rate, the participation rate has continued a downward trend locally. Sitting at 14.3% lower than Ontario and 7% lower than the
    Economic Region, this is of a concern. Employers locally have been finding it more difficult over the past two years to fill available
    positions and the low participation rate is an indicator of why they are struggling. Because there are more questions than answers to
    this issue, in-depth research on the participation rate across Eastern Ontario is proposed.

                                                                             Participation Rates 2008 - 2018
                                                                                    Two Year Averaging
                              70.0
                                     67.4
                                              66.9
                              68.0                           66.7                             66.5
                                                                             66.4                                      66.3            65.9        65.8                   65.8   65.6
                              66.0     67.4
                                              67.0           66.8
                                     63.6                                    66.6
                                                                                                66.3          66.1
                              64.0                                               62.9                                         65.5                                       65
                                                                                                                                                          65.1                   64.7
                                              61.4           61.4                              61.4
                                                                                                              61.1
                              62.0
                                     62.6                                     62.3
                                                                                                                              59.2                                  58.9
                              60.0
                                                                                                                                                        58.6
                                                             60.3                                                                                                                57.4
                              58.0                                                             59.9            60.0
                                              59.3

     Participation Rate (%)
                              56.0
                                                                                                                               56.9
                              54.0

                                                                                                                                                  54.1              54
                              52.0                                                                                                                                                      50.4

                              50.0
                                     08-09    09-10          10-11           11-12             12-13           13-14           14-15               15-16            16-17        17-18

                                              Lennox and Addington, Hastings, Prince Edward            Kingston-Pembroke [3515]               Ontario            Canada

     Source: Statistics Canada, Labour Force Survey, Special Tabulations

7
BUSINESS COUNT UPDATE
The top five industries remained the same as those
HASTINGS COUNTY in the 2018 LLMP with Construction seeing a slight
increase. Manufacturing, Health Care and
Construction all saw minor increases in number of
employees.
Hastings County -Top Five Industries
By Business Count
18% 17%
% of Businesses With Employees
16% 15%
14%
12% 11%
10%
10%
8%
8%
6%
4%
2%
0%
44-45 Retail trade 23 Construction 62 Health care 81 Other services 72
and social (except public Accommodation
Source: Statistics Canada, Canada Business Counts June 2018 assistance administration) and food services
Hastings County - Top Five Industries
by Employee Count
20%
18%
% of Estimated Employee Count
18%
16%
14%
14% 13%
12%
10%
10%
8%
8%
6%
4%
2%
0%
44-45 Retail 31-33 62 Health care 72 23 Construction
trade Manufacturing and social Accommodation
assistance and food
services
Source: Statistics Canada, Canada Business Counts June 2018, Special Calculations
8BUSINESS COUNT UPDATE
The top five industries remained the same as those in
the 2018 LLMP with Accommodation and Food Services
PRINCE EDWARD COUNTY seeing a minor decrease in total percentage of all
businesses. Health Care saw a minor increase in
number of employees while Accommodation and Food
Services and Retail saw minor decreases.
Prince Edward County -Top Five Industries
By Business Count
18% 17%
% of Businesses With Employees
16%
14%
12% 11%
10%
10% 9% 9%
8%
6%
4%
2%
0%
23 Construction 44-45 Retail trade 62 Health care 11 Agriculture, 72
and social forestry, fishing Accommodation
Source: Statistics Canada, Canada Business Counts June 2018
assistance and hunting and food services
Prince Edward County - Top Five Industries
by Employee Count
18%
% of Estimated Employee Count
16%
16%
14%
12% 12%
12% 11%
10%
10%
8%
6%
4%
2%
0%
62 Health care 72 44-45 Retail trade 11 Agriculture, 23 Construction
and social Accommodation forestry, fishing
assistance and food services and hunting
Source: Statistics Canada, Canada Business Counts June 2018, Special Calculations
9BUSINESS COUNT UPDATE
The top five industries remained the same as those in the
2018 LLMP with Construction seeing a minor decrease
LENNOX AND and Retail seeing a minor increase in total percentage of
ADDINGTON COUNTY all businesses. Health Care saw a minor increase in
number of employees.
Lennox and Addington County -Top Five Industries
By Business Count
25%
% of Businesses With Employees
20%
20%
15%
15%
10%
10% 9%
8%
5%
0%
23 Construction 44-45 Retail 62 Health care 81 Other 72
trade and social services (except Accommodation
assistance public and food
administration) services
Source: Statistics Canada, Canada Business Counts June 2018
Lennox and Addington County - Top Five Industries
by Employee Count
18%
% of Estimated Employee Count
16%
16% 15% 15%
14%
12%
10% 9%
8% 7%
6%
4%
2%
0%
31-33 62 Health care 44-45 Retail 23 Construction 72
Manufacturing and social trade Accommodation
assistance and food
services
Source: Statistics Canada, Canada Business Counts June 2018, Special Calculations
10HEALTH CARE INDUSTRY
In the 2018—2021 LLMP, Health Care was an industry area noted as needing further
exploration. Although data indicated an increase in health care related businesses and in the
labour force associated with that industry, not much is known about what types of positions are
available and what the struggles are to find, fill and retain people for them. The Health Care
industry will be a high priority research component in 2019 and leading up to this, consultations
with employers in the industry and Employment Ontario Service Providers were held throughout
January 2019. The information from these consultations will help lead further research.
Employment Service Providers have Employers have a variety of Health
qualified clients looking for work in Care occupations they struggle to fill
these occupations. across the region.
Personal Support Worker Personal Support Worker
(Especially in remote areas)
Developmental Support Worker
Dietary Food Service Worker
Medical Administration/Office
Registered Nurse (With specialty
Home Care Worker
area experience)
Dietary Aide
Registered Practical Nurse (With
Registered Practical Nurse specialty area experience)
Child and Youth Worker Physiotherapists
Registered Massage Therapists Occupational Therapists
(Spa related opportunities)
Speech & Language Therapists
Nurse Practitioners (Growing
opportunities)
There appears to be both gaps and
opportunities however, no strategy is yet in
place to address this.
11HEALTH CARE INDUSTRY
Employment Service Providers Employers identified a number of
identified a number of barriers that barriers in finding candidates for
their clients face in finding positions in available positions in the Health Care
the Health Care Industry. Industry.
Lack of experience Lack of applicants
Lack of education Applicants lack experience
Disability issues Budget restrictions
Employer inflexible in their hiring Applicants lack interpersonal skills
Other areas: Applicants lack work ethic
Newly educated clients Other areas:
struggle to break into field Travel
Newcomers to Ontario have Number of resumes received
issues with education being that are not relevant
recognized
Lack of senior experienced
RN/RPN that wants that PSW RN’s that can provide
position as a result of burnout mentorship to junior RN’s
Communication issues for Overall shortage of
deaf and hard of hearing professionals within the
clients that are qualified to Province (e.g. Therapy
hold PSW positions positions)
Only part-time work Lack of people currently in the
career path (e.g. Nurse
Practitioner)
! Employers also identified a number of retention issues they have encountered.
Getting more hours Patient and client loads
Lack of stability Staffing shortages
Not what staff envisioned Inability to fill vacation requests
No regular hours at the Competition from other
beginning employers locally and
provincially
Workload
12TOURISM INDUSTRY
Sector Partnership Planning Grant
In 2017, the Ministry of Training, Colleges and Universities (then called Ministry of Advanced
Education and Skills Development) opened up a call for proposals known as Sector Partnership
Planning Grants (SPPG). With a focus on addressing industry/sector specific training needs
through the identification of workforce challenges and strategy development, two organizations
were successfully approved under this grant to look at tourism related issues that would impact
the industry locally.
Local based Agri-tourism research Provincial based tourism research
Prince Edward Ontario Tourism
Learning Centre Education
(PELC) Corporation (OTEC)
Partnered with
Their research resulted in:
Formation of
Tourism & Hospitality Sector
Partnership Planning Meetings held
in Windsor, Kitchener/Waterloo,
The Prince Edward Learning Kingston and Toronto.
Centre
PEC Chamber of Commerce
Career Edge Formation of
PEC Community Development
Department
Loyalist College Training &
Knowledge Centre
Implementation of SkillsAdvance Implementation of SkillsAdvance (SAO)
Ontario (SAO) Pilot Project Phase 2 and Skills Catalyst Fund
(2018) by Career Edge. Project in various areas across Ontario
H.E.A.T. including Quinte West in Partnership
with Career Edge.
Helping Employers Acquire
Talent Hospitality Career Catalyst
13CONSTRUCTION INDUSTRY
In 2018, CFWD began addressing shortages in the
construction labour force through two partnership
initiatives with the Quinte Home Builders
Association (QHBA).
In April 2018, CFWD along with staff from the
Ministry of Training, Colleges and Universities
manned a booth at the Home and Lifestyle Show
over the weekend. Approximately 250 people
encompassing youth, parents and grandparents
visited the booth to learn more about the career
path in apprenticeable trades across all industry
sectors.
Across most of the Board’s catchment area, construction related businesses and occupations
remained steady or were on the increase. Only Lennox and Addington saw a small decrease in
the number of businesses but the labour force numbers did not decrease. A better understanding
of this industry’s needs will be the subject of research over the next two years, both locally and
across Eastern Ontario.
In November 2018, CFWD and QHBA partnered on an
QHBA and its members identified event to inform high school students about the great
numerous positions as a priority to fill. local opportunities in the construction industry. About
100 students participated in speed mentoring and skills
competitions!
We need:
Journeyman Carpenters/
Framers
Masons
General Contractors
HVAC installers
Plumbers
Electricians
14EMPLOYMENT ONTARIO PROGRAMS
The Ministry of Training, Colleges and Universities (MTCU) provides data updates on various
program areas administered through the Employment Ontario Service Provider Network. The
organizations that deliver the programs are broken into Employment Services and Literacy and
Basic Skills Services. The following data update, covering the 2017-18 fiscal year, is presented
to provide an overview to the community of what is occurring across the program areas. The
data is presented with a note of caution as any data numbers below 10 are suppressed by
MTCU and will not be reflected in the data presented. For this reason no direct analysis of this
data is done, however it is reviewed with the Service Provider Network. The numbers in all
tables and charts, unless expressed as a percentage, indicate number of clients.
Apprenticeships
Apprenticeship Across Hastings, Prince Edward and Lennox and
Addington Counties
900
784
800 New
700 registrants
Number of Persons
600 dropped by
20% as
500
compared
400
298 to 2016-17.
300
179
200
101
100
0
Number of New Number of Active Number of CofAs Number of Modular
Registrations Apprentices Issued Training Registrations
New Apprentice Age Ranges Across Hastings, Prince
Edward and Lennox and Addington Counties
160 146
139
140
Number of Persons
120
100
80
60
40
20 13
0
15-24 25-44 45-64
Age Range
15EMPLOYMENT ONTARIO PROGRAMS
New Apprentice Gender
255 43
New Apprentice Registrations by Trade Across Hastings,
Prince Edward and Lennox and Addington Counties
313A: Refrigeration and Air Conditioning Systems Mechanic 11
433A: Industrial Mechanic Millwright 25
403A: General Carpenter 25
306A: Plumber 26
332A: Hairstylist 30
310T: Truck and Coach Technician 37
309A: Electrician - Construction and Maintenance 39
310S: Automotive Service Technician 43
0 5 10 15 20 25 30 35 40 45 50
Number of Registrants
Number of Employees in Participating
Canada - Ontario Job Grant (COJG) Companies
In the Employer Stream, there were 172 14
participating employers. All of these fell
within the “Under 25” category. This
category means there were 25 or less
participants in training. 147
Less than 50 50-150
16EMPLOYMENT ONTARIO PROGRAMS
Training Outcome at Exit
92%
92%
Percent of Employers Reporting
91%
90%
90%
89%
Increase in trainee Training met workforce
productivity needs
There were a total of 465
COJG Participant Age Range participants in the COJG
300 program.
242
250
Number of Participants
200
140
COJG Participant Gender
150
100
55
50 28
0
15-24 25-44 45-64 65 and older
Age Range
222 242
Participant Education Level
Completion of Secondary 30
84% of the
participants were
Certificate/Diploma 162
employed full-time.
14% were Applied/Associate/Bachelor Degree 45
employed part-time.
Unknown 210
0 50 100 150 200 250
Number of Participants
17EMPLOYMENT ONTARIO PROGRAMS
Employment Services
Assisted Service Clients1 Unassisted R&I Clients2
Assisted clients
saw a slight
increase while
unassisted saw a
slight decrease
from the previous
fiscal year.
3366 5796
Assisted Client Age Range
Assisted Client Gender
1600
1406
1400
1200
Number of Clients
1049
1000 857
800
600
400
200 54
0 1771 1587
15-24 25-44 45-64 65 and older
Age Ranges
1
Assisted Clients are unemployed and not participating in full time training or education. Components include Job Search, Job
Matching, Placement and Incentive and Job/Training Retention.
2
(R&I) - The Resource and Information (RI) component is a resource that is available to everyone in the community including the
employed, under-employed, job seekers, students, laid off workers, apprentices, internationally trained and employers. There are no
eligibility or access criteria for RI.
18EMPLOYMENT ONTARIO PROGRAMS
Assisted Client Highest Education Level at Program Entry
Less than Grade 9 42
Less than Grade 12 576
Completion of Secondary 1416
Certificate of Apprenticeship/Journey Person 59
Certificate/Diploma 973
Applied/Associate/Bachelor Degree 170
Post Graduate 26
Other (Some Apprenticeship/College/University) 104
0 500 1000 1500
Number of Clients
Designated Groups
Aboriginal Group 173 Labour Force
Francophone 17 Attachment
Internationally Trained Employed Full Time 69
Professionals 71 Employed Part Time 57
Newcomer 54 Self Employed 20
Person with Disability 712 Under Employed 90
Visible Minority 99 Unemployed 3120
Top Five Layoff Occupations
Trades helpers, construction labourers and related occupations 222
Service support and other service occupations, n.e.c. 193
Service representatives & other customer & personal services
occupations 155
Labourers in Processing, Manufacturing and Utilities 143
Other installers, repairers and servicers and material handlers 134
19Assisted Client Layoff Industry
Agriculture, Forestry, Fishing and Hunting 23
Construction 250
Manufacturing 249
Wholesale Trade 37
Retail Trade 328
Transportation and Warehousing 148
Information 17
Finance and Insurance 13
Real Estate and Rental and Leasing 15
Professional, Scientific, and Technical Services 34
Administrative and Support, Waste Management and Remediation Services 212
Educational Services 20
Health Care and Social Assistance 95
Arts, Entertainment, and Recreation 48
Accommodation and Food Services 265
Other Services (except Public Administration) 92
Public Administration 30
0 50 100 150 200 250 300 350
Number of Clients
Client Numbers by Layoff Occupation
Processing and manufacturing machine operators Trades helpers, construction labourers
and related production workers 59 and related occupations 222
Harvesting, landscaping and natural resources Service support and other service
labourers 49 occupations, n.e.c. 193
Care providers and educational, legal Service representatives and other customer
and public protection support occupations 39 and personal services occupations 155
Maintenance and equipment operation trades 35 Labourers in Processing, Manufacturing
and Utilities 143
Paraprofessional occupations in legal, social,
community and education services 29 Other installers, repairers and servicers
and material handlers 134
Middle management occupations in retail
and wholesale trade and customer services 28 Sales support occupations 120
Distribution, tracking and scheduling Sales representatives and salespersons
co-ordination occupations 27 – wholesale and retail trade 101
Technical Occupations Related to Transport and heavy equipment operation
natural and applied sciences 27 and related maintenance occupations 100
Assemblers in Manufacturing 20 Service supervisors and technical s
ervice occupations 89
Middle management occupations in trades,
transportation, production and utilities 13 Office support occupations 80
Retail sales supervisors and specialized Administrative and financial supervisors
sales occupations 13 and administrative occupations 67
Workers in natural resources, agriculture Industrial, electrical and construction trades 65
and related production 11
* n.e.c. means “not elsewhere classified” 20EMPLOYMENT ONTARIO PROGRAMS
Detailed Outcome at Exit
Employed Full-Time 1448
Employed Part-Time 471
Employed Apprentice 28
Employed - Other* 175
Self-Employed 72
In Education 98
In Training 219
Independent 22
Unable to Work 88
Unemployed 418
Unknown 313
0 200 400 600 800 1000 1200 1400 1600
Number of Clients
*Other (employed in a more suitable job, employed in a professional occupation/trade, employed in area of training/choice)
Employed Outcome
Top Five Occupations
Employed Outcome
Top Five Industries Service support and other
service occupations, n.e.c.* 81
Manufacturing 115
Retail Trade 99 Trades helpers, construction
Accommodation and Food labourers and related occupations 70
Services 89
Labourers in Processing,
Construction 68
Manufacturing and Utilities 66
Administrative and Support,
Waste Management & Sales support occupations
Remediation Services 62 Service representatives and
other customer and personal
services occupations 42
* n.e.c. means “not elsewhere classified”
21EMPLOYMENT ONTARIO PROGRAMS
Literacy and Basic Skills (LBS)
Client Numbers
450 437
400
Number of Clients
350
300
250 219
200 4% Increase in the
150
number of In-Person
Learners.
100
Number of In-Person Learners Number of In-Person Learners
(New) (Carry-Over)
LBS Client Gender
Labour Force Attachment
3% 2%
9%
Unemployed
15% Employed Part Time
Employed Full Time
278 376 Self Employed
71%
Unknown
Designated Groups
Aboriginal Group 50
Newcomer 14
Person with Disability 266
Visible Minority 26
22Clients by Age Range
300
258
250
Number of Clients
195
200
147
150
100
56
50
0
15-24 25-44 45-64 65 and older
Where Were Clients Referred
In From?
EO - Employment Service Provider 87
EO - Literacy and Basic Skills Service
Provider 14
Informal Word of Mouth/Media Referral 346
Ontario Works 53
Other - Structured/Formal Referral 118
Client Source of Income
Dependent of OW/ODSP 38
Employed 111 Number of Learners by Sector
Employment Insurance 51 Community Agency 391
No Source of Income 71 Community College 265
Ontario Disability Support Program 143
Ontario Works 119
Other 94
23Learner Goal Path
300
255
250
Number of Clients
197
200
150
100
100 84
50
20
0
Apprenticeship Independence Secondary Employment Postsecondary
School Credit
Referral Out to Community and Other Programs/Resources
Educational/Academic Services 145
Custom Basic Plan 64
Multiple 34
High School 32
Employment Service Provider 31
Multiple 20
Federal Youth Employment Strategy 13
0 50 100 150
Number of Clients
Detailed Outcome at Program Exit
Unknown 92
Unemployed 57
In Education 55
Employed Full-Time 51
Employed Part-Time 30
Independent 21
Volunteer 20
Both employed and in education 15
Unable to Work 14
In Training 12
0 10 20 30 40 50 60 70 80 90 100
Number of Clients
24EMPLOYMENT ONTARIO PROGRAMS
Ontario Employment Assistance Service (OEAS)
There were a total of 116 clients assisted through this program. The data outlined below does not
include the new Supported Employment program which launched in April 2018.
Clients by Age Range
40
39
39 Client Gender
Number of Clients
38
37
37
36
35
35
34
33
15-24 25-44 45-64
Age Range 66 50
Client Education Level
Less than Grade 12 19
Completion of Secondary 43
Certificate/Diploma 32
Other (Some
11
Apprenticeship/College/University)
0 5 10 15 20 25 30 35 40 45 50
Number of Clients
Client Income Source
40 36
35 30
Number of Clients
30 26 Client Designated
25
20
Groups
16
15 Aboriginal Group 11
10
5 Person with Disability 86
0
No Source of Ontario Ontario Works Other
Income Disability
Support
Program
25EMPLOYMENT ONTARIO PROGRAMS
Second Career There were a total of 99 clients assisted through
the Second Career program.
Client Highest Education Levels Client Gender
45
39
40
Number of Clients
35 30
30
25
20
15 13
10
5 46 53
0
Less than Grade 12 Completion of Certificate/Diploma
Secondary
Length of Time Out of
Employment/Training
25% of clients in this
Client Age Ranges program went into
Transport Truck Driver Less than 3 months 52
25-44 49 Training. Client numbers
across other training 3 - 6 months 16
45-64 41
programs are suppressed. 6 - 12 months 13
More than 12 months 12
Outcome at Exit Detail
Employed - Other* 16
Employed Full-Time 25
Unknown 20
Unemployed** 47
0 5 10 15 20 25 30 35 40 45 50
Number of Clients
*Other (employed in a more suitable job, employed in a professional occupation/trade, employed in area of training/choice)
** Unemployed is number of clients at completion of training. 12 month follow-up shows 75% were now employed. 26EMPLOYMENT ONTARIO PROGRAMS
Youth Job Connection (YJC) There were a total of 263 clients assisted
through the Youth Job Connection program.
Client Highest Education Levels at Intake
Less than Grade 9 11
Less than Grade 12 107
Completion of Secondary 118
Certificate/Diploma 14
Other (Some
11
Apprenticeship/College/University)
0 50 100 150
Number of Clients
Client Income Source
160 145
140
Number of Clients
120
100
78
80
60
40
15 17
20
0
Dependent of No Source of Ontario Disability Ontario Works
OW/ODSP Income Support Program
Client Gender
Client Age Ranges Client Designated
Groups
15-24 227 Aboriginal Group 21
25-44 36 Person with Disability 76
152 110
27LONG RANGE ACTIONS – YEAR ONE IMPLEMENTATION UPDATE
Address the need to improve the soft and technical skills of job seekers and to retain these
people once hired in the manufacturing sector.
Goal Activity Update
Job seekers have access to a Develop a short-term No Action to Date
pre-employment program that enhanced training program to
provides integrated soft and be delivered through post-
technical skills development. secondary or adult education
training paths.
Employers be provided with the Existing HR Toolkit to be The HR Toolkit is currently
resources, training and support updated with current Human being revised with an expected
that they require to implement Resource hiring practices and release to be done in early
and maintain an effective legal requirements as well as 2019.
orientation and onboarding be enhanced to include
process. orientation and onboarding.
Employers be provided with the Develop a short-term Loyalist Training and
resources, training and support enhanced training program for Knowledge Centre has
that they require to develop the supervisors and managers to developed a series of training
soft skills necessary to be delivered through post programs for managers and
effectively support employees secondary, adult education or these have been delivered over
to excel at their job. service provider training the past 6-8 months.
paths.
Solutions be identified and Develop and implement a Marketing is being included in
actioned to address the areas strategy to address the issues the larger Eastern Ontario
of concern related to flexible identified. This includes Manufacturing Strategy.
training options, marketing of marketing manufacturing as a Transportation is a high priority
manufacturing and improved Career of Choice. with City of Belleville—new
transportation options. transit pilot implemented and
very successful. More Quinte
Region options being
developed.
Implementing a plan to rapidly respond to changes in workforce staffing and training needs
across manufacturing in Eastern Ontario.
Goal Activity Update
Coordinate collaboration to Development of a plan The Ontario East Economic
deliver an integrated workforce through the Ontario East Development Commission has
development plan. Economic Development developed a draft version of the
Commission in partnership Eastern Ontario Manufacturing
Workforce Development Project.
with Eastern Region Local
CFWD sits as part of the
Boards.
steering committee for this
project.
28LONG RANGE ACTIONS – YEAR ONE IMPLEMENTATION UPDATE
Understanding “true” Labour Market Information data
Goal Activity Update
Locally the participation rate has Detailed research to obtain a CFWD is currently putting
been on a steady decline. better understanding of the together an Ontario Labour
However, participation rates do “true” unemployment and Market Partnership proposal to
not reflect people who may be participation rates of people in conduct detailed research, focus
actively seeking employment but the Board catchment area. groups and develop a strategy to
fall under such programs as From this better assessment of address the low participation rate.
Ontario Works. available labour skills and
training needs of potential
employees can be developed.
Equality in Skilled Trades
Goal Activity Update
Provide a better understanding to Further develop relationships No Action to Date
employers hiring in skilled trades with: local women’s groups;
occupations about the advantage Aboriginal communities,
of hiring underrepresented employers and employment
groups including women, agencies; person with
aboriginal and persons with disabilities groups; visible
disabilities. minority groups; and
organizations supporting
designated groups (as defined
by the Employment Equity Act).
Host an educational event for
employers.
Skilled Trades Handbook Update
Goal Activity Update
The skilled trades handbook A revamp of the existing skilled The Skilled Trades Handbook was
developed by CFWD is several trades handbook will be redone over the Summer and early
years old. It needs to be brought undertaken. It will include Fall of 2018. It was released
up to date to better define training, additional information to assist November 9, 2018.
education and career paths. It also both potential and current
needs to clearly identify assistance apprentices with understanding
paths for apprentices. education and training options,
along with how to access
assistance through Literacy and
Basic Skills.
Employment Ontario Service Provider Data
Goal Activity Update
To provide a better analysis of Work with the Ministry of Concerns have been shared with
Employment Ontario Service Training, Colleges and MTCU around suppressed
Provider programs in order to Universities on providing more numbers as this does not allow
gain an improved understanding concise data for analysis. for a proper analysis of gaps in
of gaps in service or training or opportunities.
opportunities for clients.
29LONG RANGE ACTIONS – YEAR ONE IMPLEMENTATION UPDATE
Regional HR Strategy
Goal Activity Update
Build A More Skilled (Soft Skills Develop a process to network No Action to Date
& Hard Skills) Workforce. and connect community
partners and stakeholders to
create a shared vision of a
“skilled workforce”.
Create stronger connections No Action to Date
between employers and
schools through activities like
job shadowing, co-ops and
work prep programs.
Define the “soft skills” Soft Skilled Solutions program—
necessary for today’s workforce 30 members of the community
and develop a program to build trained and currently arranging
them. for employers to receive the
“Train the Trainer” program.
Encourage education that Soft Skills Pilot being initiated
includes a focus on through Loyalist College.
employment needs & prepares
students for the workforce.
Create Greater Understanding of Conduct future-focused Champions group has discussed
the Benefits of Doing Business in research & strategy for how this could be accomplished.
Our Region. business development.
Involve youth in a youth-led Rural Ontario Institute Municipal
attraction strategy. Internship: Youth Engagement
Strategies funding is being
looked at for future submissions.
Create intentional government No Action to date.
& business communication and
collaboration strategies
(structures & processes).
Attract, Recruit & Retain Develop integrated 24/7 City of Belleville is leading
Qualified Candidates to our transportation options across innovative transportation
Region. the region. solutions. More to follow.
Host collaborative social META/CFWD looking at a Doors
gatherings in workplaces and Open Style of event in 2019.
the community, for workers and
their families.
Create a regional ambassador/ Regional Tourism Board is
mentorship program to increase working on developing strategies
regional pride. to address this.
Use and capitalize on social Discussion point for further
media to centralize and clarification through Champions
coordinate recruitment and meeting.
retention efforts.
30LONG RANGE ACTIONS – YEAR ONE IMPLEMENTATION UPDATE
Regional HR Strategy
Goal Activity Update
Clarify, Simplify, Streamline & Deepen the understanding of HRPA has taken on addressing
Address Regulations in the need for regulations. all these items at their Eastern
Innovative Ways Region Conference in Fall 2018.
Reduce & simplify regulation HRPA has taken on addressing
applications. all these items at their Eastern
Region Conference in Fall 2018.
Reduce & clarify the need for HRPA has taken on addressing
"Red Tape". all these items at their Eastern
Region Conference in Fall 2018.
Regional Workforce Group
Goal Activity Update
Although each County, Develop a Regional Workforce Key leaders within the Board’s
Municipality and community Strategy. catchment area have been
have unique challenges, they invited to participate in the group.
also face similar labour force The first meeting was held in
issues. The Regional Workforce December 2018.
Group would identify and focus Assist in providing direction to See above.
on the shared challenges, CFWD activities.
applying a collaborative
approach to addressing Provide a central resource for See above
workforce development as well CFWD community
as provide ongoing advice to consultations and research.
CFWD.
Youth
Goal Activity Update
Education Council To develop an Industry Discussions have taken place
Education Council that will with Belleville Chamber of
connect and partner with Commerce about further
business and education to help development of this activity. No
students explore careers, gain further actions at this point.
meaningful workplace
experiences and discover a
vibrant connection to the
workforce and the future.
31LONG RANGE ACTIONS – YEAR ONE IMPLEMENTATION UPDATE
Youth
Goal Activity Update
Soft Skills development for high A job fair specifically for No Action to Date.
school and post-secondary youth students from Loyalist College
through part-time job and high schools that targets
opportunities. part-time job opportunities with
local employers. Job fairs
traditionally target full-time
positions for adults or older
youth not in the education
system so this would provide
an opportunity youth would not
normally have.
Entrepreneurship Promotion Develop entrepreneurial Some discussion has taken place
workshops for students to at youth meetings through United
better understand how to run Way but no solid plans have
their own business. Use these been developed yet.
workshops to have local
entrepreneurs as guest
speakers to ensure the youth
have engaging mentors.
Creative Economy Develop a local ‘arts’ council No Action to Date
where creative minds who work
in the area can connect
students to proper resources to
follow their passions
(filmmakers, photographers,
graphic artists, writers, painters
etc.)
Opportunities for Military Personnel
Goal Activity Update
To develop a better Conduct detailed research at a local No Action to Date
understanding of the local level on the gaps and opportunities
workforce opportunities for for military family members,
family members of posted including youth, that can address
military personnel. their struggle in finding meaningful
employment.
To develop a better Conduct detailed research at a local No Action to Date
understanding of local level on the opportunities for retiring
workforce opportunities for military members that can address
retiring military personnel. their struggle in finding meaningful
employment upon leaving the
Canadian Forces.
32LONG RANGE ACTIONS – YEAR ONE IMPLEMENTATION UPDATE
Health Care Industry
Goal Activity Update
To develop a better Conduct detailed research at a local Consultations were conducted
understanding of the local level on the Health Care industry to with employers and
Health Care Industry needs. obtain a better understanding of Employment Ontario Service
labour force issues the industry is Providers that will help lead
facing. the research in 2019.
Conduct a forum to present the Pending research component.
finding of the research and obtain
feedback towards a Health Care
Labour Force Strategy.
Develop and release a strategy for Pending research component.
the local community.
Construction Industry
Goal Activity Update
To develop a better Conduct detailed research at a local Construction event held for
understanding of the local level on the Construction industry to high school students. OLMP
Construction Industry needs. obtain a better understanding of research project being
labour force issues the industry is developed.
facing.
Conduct a forum to present the No Action to Date
finding of the research and obtain
feedback towards a Construction
Labour Force Strategy.
Develop and release a strategy for No Action to Date
the local community.
Tourism Sector
Goal Activity Update
To develop a better Conduct detailed research at a local Research done in Prince
understanding of the local level on the Tourism sector to obtain Edward County by County
Tourism Sector needs. a better understanding of labour Workforce Partnership and
force issues the industry is facing. provincially by Ontario Tourism
Education Corporation (OTEC)
provincially. Pilot training in
place.
Conduct a forum to present the Both County Workforce
finding of the research and obtain Partnership and OTEC have
feedback towards a Tourism Labour presented findings and
Force Strategy. received feedback.
Develop and release a strategy for HEAT program being delivered
the local community. in Prince Edward County.
OTEC Pilot in Quinte West. 33Conclusions
As a community, were are progressing slowly because we want to “go far”! Many of the Long
Range Actions have seen work done on them, however there is much more to do.
The year ahead is exciting with plans to do in-depth research on the Health Care sector and look
at strategies to address the concerns raised through the consultations.
For employers and job seekers in the Tourism and Hospitality industry, there is extensive work
being done through pilot training both in Prince Edward County and Quinte West. Additionally, the
Quinte West Working Group that has been formed as part of Tourism SkillsNet Ontario is just
getting underway. With some key priorities now identified, this group will be leading action plans to
address workforce skills shortages faced by industry employers locally.
Skilled Trades shortages, especially in the Construction Sector, continue to be of concern. CFWD
plans to look at this issue across Eastern Ontario through an Ontario Labour Market Partnership
over 2019.
With the Regional Workforce Group underway and the Regional HR Strategy pieces slowly taking
shape, these are exciting times with great potential. The goals and actions the LLMP has laid out
can benefit the local workforce, however, they cannot be accomplished alone. You are the pulse of
this community so……..
Ask Questions! Provide Input! Get Involved!
34Special Thanks
The Centre for Workforce Development would like to thank all of our community partners who have
provided input to this process over the last year. Whether it was being a part of an action taking
place or a simple conversation about the labour force, the Board and community cannot move the
needle on workforce issues in a positive manner without you.
With Health Care being one of the major focuses over the next year, the input that was received by
both Health Care employers and Employment Ontario Service Providers is a critical key in helping
guide the direction the focus will take.
Thank you everyone!
Algonquin Lakeshore District School Board Manufacturing Resource Centre
Bancroft Chamber of Commerce META Employment Services
Belleville Chamber of Commerce Military Resource Family Centre
Belleville Economic Development Mohawks of the Bay of Quinte
Brighton Quinte West Family Health Team Napanee Chamber of Commerce
Business and Professional Women’s Network Northumberland Economic Development
Career Edge Ontario East Economic Development
Commission
Cheshire Homes (Hastings – Prince Edward)
Inc. Ontario Tourism Education Corporation
(OTEC)
Community Learning Alternatives
Prince Edward County Chamber of Commerce
École Secondaire Publique Marc-Garneau
Prince Edward County Community
Greater Napanee Economic Development
Development
Hastings and Prince Edward District School
Prince Edward Learning Centre
Board
Quinte Economic Development Commission
Hastings Manor
Quinte Health Care
HRPA Quinte and District
Quinte Home Builders Association
Kagita Mikam
Quinte West Chamber of Commerce
Kingston Literacy & Skills
Quinte West Economic Development
Lennox and Addington Economic Development
RTO9 Regional Tourism Organization
Limestone District School Board
Sir James Whitney School for the Deaf
Loyalist College
Small Business Centre
Loyalist Community Employment Services
Trenval
Madoc Chamber of Commerce
United Way Hastings and Prince Edward
35Centre for Workforce Development
11 Bay Bridge Rd., Belleville, ON K8P 3P6
613-969-0720 Fax 613-969-0719
info@cfwd.ca www.cfwd.ca
36You can also read