MUNICIPAL VARIATION IN WAGE SUBSIDY USE - DIVA
←
→
Page content transcription
If your browser does not render page correctly, please read the page content below
Municipal variation in
wage subsidy use
An empirical study on the use of New Start Jobs in
Swedish municipalities

 BACHELOR
 THESIS WITHIN: Economics
 NUMBER OF CREDITS: 15
 PROGRAMME OF STUDY: International Economics
 AUTHOR: Mahmoud Al Sawaf & Leila Bourdayeme
 JÖNKÖPING May 2021

Bachelor Thesis in Economics
Title: Municipal variation in wage subsidy use – An empirical study on the use of
 New Start Jobs in Swedish municipalities
Authors: Mahmoud Al Sawaf and Leila Bourdayeme
Tutor: Johannes Hagen
Date: May 2021

Key terms: employment, wage subsidy, labour market supply and demand, unemployment,
wages, deadweight loss, elasticity of substitution

Abstract
Wage subsidies are commonly used as a tool to reduce the cost of labour and lower the rate of
unemployment. The purpose of this study is to analyse what factors influence the use of the
New Start Jobs subsidy in the two hundred ninety municipalities of Sweden during 2019. The
statistical program EViews was used in the analysis to provide insight into the expansive data
set. Three key hypotheses were drawn up to explore different influencing factors including,
municipal tax rates, share of foreign-born individuals and educational level. The results of this
study can be used to further expand the use of this type of wage subsidy with the aim of
expanded enrolment into the program and consequently reducing long-term unemployment.

 1
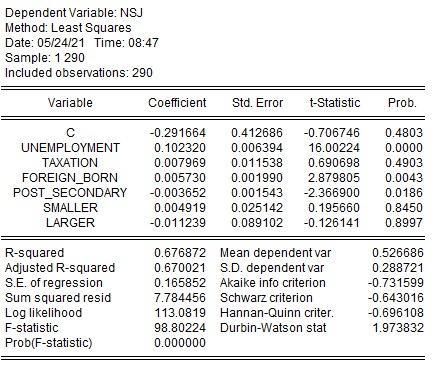
Table of Contents

1. Introduction ......................................................................... 1
1.1 Purpose ................................................................................................. 3
1.2 Limitation ............................................................................................... 3
2. Theoretical framework ........................................................ 4
2.1 Labour market equilibrium ..................................................................... 4
2.2 The impact on equilibrium with a wage subsidy ..................................... 5
2.3 Labour market discrimination ................................................................. 5
2.4 Steady-state rate of unemployment ....................................................... 6
2.5 Negative impacts of using wage subsidies ............................................ 7
3. Wage subsidies in Sweden ................................................ 8
3.1 Background ............................................................................................ 8
3.2 New Start Jobs....................................................................................... 8
3.3 International studies ............................................................................. 10
4. Hypotheses ....................................................................... 12
5. Empirical model and data ................................................. 14
5.1 Dependant Variable ............................................................................. 15
5.2 Independent Variables ......................................................................... 15
5.3 Dummy Variables................................................................................. 15
5.4 EViews equations ................................................................................ 16
5.5 Correlation, Variance Inflation Factors, Durbin-Watson and
Robustness Testing .......................................................................................... 16
6. Empirical results and discussion .................................... 19
6.1 Model 1 - Independent variables .......................................................... 20
6.1.1 Municipal taxation rates and wage subsidy use ................................... 21
6.1.2 Post-secondary education and wage subsidy use ............................... 21
6.1.3 Percentage of foreign-born individuals and wage subsidy use ............ 22
6.2 Model 2 - Dummy variables ................................................................. 22
6.3 Suggestions for further research .......................................................... 23
7. Conclusions ...................................................................... 24
1. Reference list .................................................................... 25
2. Appendix ........................................................................... 27

 2
Figures
Figure 1 - Labour Market Equilibrium ........................................................................ 4
Figure 2 - Shifts in supply and demand with and without a subsidy .......................... 5
Figure 3 - Number of people, age 16-64, in subsidized employments....................... 9

Tables
Table 1 - Descriptive statistics for the data series. .................................................. 14
Table 2 - Correlation matrix for all correlation coefficients ...................................... 16
Table 3 - Variance Inflation Factors for dependent and independent variables ....... 17
Table 4 - Durbin-Watson test for autocorrelation. ................................................... 17
Table 5 - Eviews output coefficients and (p-values) ................................................ 20

Appendix
Appendix 1 - Map of municipalities in Sweden ........................................................ 27
Appendix 2 - Descriptive statistics for the data series ............................................. 29
Appendix 3 - Correlation Matrix .............................................................................. 29
Appendix 4 - Variance Inflation Factors .................................................................. 29
Appendix 5 - Model 1 - EViews output .................................................................... 30
Appendix 6 - Model 2 - EViews output .................................................................... 30
Appendix 7 - Actual fitted residual tables for all municipalities ................................ 31

 3
1. Introduction

One essential element in the Swedish labour market is the use of active labour market
policies over passive financial aids (Kornerud, Mångs, & Olsson, 2018). The difference
between an active labour market policy and a passive financial aid is that the active policy
aims at encouraging movement towards labour market participation. Whereas financial
aid to unemployed people is believed to reduce the incentives for employment (Borjas,
2010). The objective of an active policy is to discourage long-term unemployment and
encourage immediate employment. A wage subsidy is therefore a regularly used tool to
actively regulate unemployment. A wage subsidy helps to reduce wage costs for firms
when hiring an unemployed worker (Borjas, 2010). By reducing the employer’s costs
when hiring someone who is unemployed, the subsidy is aimed at compensating the
perceived risk of hiring someone from long-term unemployment.

The first use of a wage subsidy in Sweden was introduced in the early 1980s to increase
employment within the manufacturing industry (Forslund, 2018). During the 80s and 90s
the subsidy changed form to include other targeted groups within the private and public
sector. The size and duration of the subsidy and who were eligible for it were the primary
changes. Ever since then, this has been the main topic of discussion among political
parties who aim to drop unemployment levels by changing the target groups and size of
the subsidy.

Up until 2006 subsidies were granted first after being approved by a case-officer at the
public employment office (Liljeberg et al. 2012). In 2007 a new form of subsidy, New
Start Jobs, was introduced where all employers who met the requirements for the subsidy
when hiring an unemployed worker were automatically granted this type of wage subsidy.
This change in policy system is believed to have large crowding-out effects, indicating
that firms who receive this new form of subsidy gain positive effects over unsubsidized
firms.

From 2008 to 2009 Sweden experienced an economic downturn that affected
unemployment rates going from 6.1 percent in 2007 to peaking at 8.6 percent in the

 1
beginning of 2010. After, Sweden underwent an economic stabilization period seeing
unemployment rates go down to as low as 6.3 percent in 2018. But due to the Covid-19
pandemic outbreak in early 2020 unemployment levels have again risen to their current
position at 8.3 percent (SCB, 2020). These fluctuations in unemployment rates typically
render political initiatives to make changes in the form and size of wage subsidies. As
mentioned, a new form of wage subsidy, Nystartsjobb (NSJ), was introduced in 2007. In
2015 the political governance introduced two new forms of subsidies, extratjänster,
targeting long-term unemployed for work in the public sector and traineejobb, targeting
young people entering the job market. The effects were not immediately seen which was
followed by a national review in 2016 to oversee the current subsidies and their respective
regulations. (Regeringskansliet)

This large overview resulted in a reduction in the number of subsidies and their respective
rules and regulations were in many ways reformed (Regeringskansliet). For example, a
couple of subsidies were removed (särskilt anställningsstöd and instegsjobb) and
replaced by introduktionsjobb, a subsidy targeting newly arrived immigrants and long-
term unemployed. This subsidy is primarily case officer approved and therefore not
eligible for everyone even if the basic requirements and criteria are met.

Several studies have been made to research the impact wage subsidies have had on
unemployment and firm performance (Forslund, 2018). This thesis however will focus
more on what municipal factors contribute to the usage of New Starts Jobs (NSJ), one of
the wage subsidies most used in Sweden. We find it interesting to look more into what
correlates with usage, rather than looking at what impact has been made by the usage of
a wage subsidy.

The County Administrative Board in Stockholm concluded in a two-part quantitative
study that people with African descent run the risk of being discriminated in the labour
market and therefore have a much more difficulty in finding a job matching their
competence (Wolgast, Gardell, & Molina, 2018). Another study made in 2004 indicate
that the 9-11 attacks in New York changed the attitudes among hiring firms in relation to
minority groups in Sweden (Rooth & Åslund, 2005). This indicates that people with a

 2
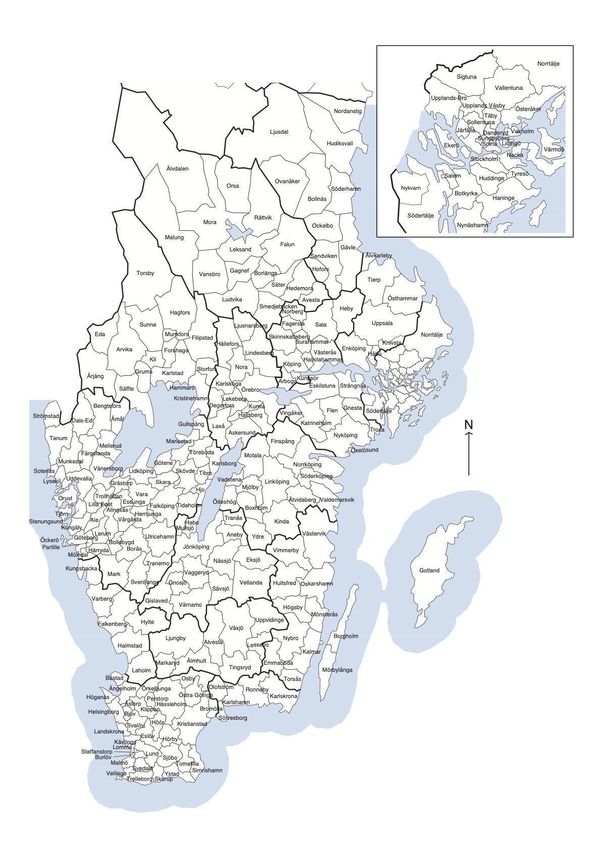
foreign background tend to be discriminated against in a larger extent than native born
swedes.

1.1 Purpose
The purpose of this thesis is to analyse what municipal factors can explain differences in
the utilization of the New Start Jobs subsidy during 2019 in all municipalities in Sweden.
This information could be used to further improve the targeting of the subsidy with the
aim of increasing wage subsidy use and lowering long-term unemployment. The study
area of this thesis is the individual municipalities of Sweden. There are 290 municipalities
in total, their location within Sweden can be seen in Appendix A1.

1.2 Limitation
This thesis will only study the use of NSJ as an employment subsidy. This is a preliminary
study and only the most recent year of full data, 2019 will be studied. This study will also
not cover the long-term effectiveness and employment status of individuals participating
in the New Start Jobs program. This thesis will focus on finding correlations between use
of NSJ and several independent variables but cannot say whether any specific correlation
is causal. The number of variables has been limited to taxation rates in the municipality,
post-secondary education and number of people who are foreign born in the municipality.

 3
2. Theoretical framework

This chapter will present a theoretical framework as well as relevant literature and studies
that can be used to help explain the function of a wage subsidy from a theoretical
perspective.

2.1 Labour market equilibrium
In a perfectly competitive labour market, wages, and demand for labour is determined
and set at an equilibrium. By understanding why wages and employment go up or down
we can start to understand how the point of equilibrium is reached.

Figure 1 illustrates how equilibrium, E*, is reached when supply for labour intersects
demand for labour. The supply curve indicates the total number of hours any given
employee is willing to allocate at a given wage level. The demand curve on the other hand
indicates the total number of hours that firms demand at that given wage level.
Equilibrium therefore occurs where the market wage, w*, is set. At this point there is no
unemployment because all people who are willing to work at this wage level are
employed. People who are not working do so because they simply are not willing to work
at this wage level. In Figure 1 this is illustrated by P, producer surplus, and Q, worker
surplus (Source: Adapted from Borjas, 2010).

Figure 1 - Labour Market Equilibrium

 4
2.2 The impact on equilibrium with a wage subsidy
In cases of imperfectly functioning labour markets governments will sometimes decide
to stimulate employment by introducing a wage subsidy. By doing so, the cost of hiring
is reduced for firms. This is achieved when the government grants a hiring firm a tax
credit for every person-hour it hires. Because the cost of hiring is reduced it shifts the
demand curve up by the same amount received. This is illustrated in Figure 2 where the
new demand curve has changed its position upwards and thereby also reaching a new
equilibrium wage level, w1. A new equilibrium level shifts from point A to point B. At
this stage employment increases as more people are willing to work because of increased
wages, from w0 to w1, at the same time as actual wage costs are reduced for firms, from
w1 to w1 -1 (Borjas, 2010).

Figure 2 - Shifts in supply and demand with and without a subsidy

2.3 Labour market discrimination
When workers and hiring firms meet, hiring decisions are not only based on wage levels,
but can also be based on differences in the characteristics of job history and/or the skills
of the worker. When the hiring individual takes factors such as race or gender into
consideration before making a job decision, this is attributed to labour market

 5
discrimination. Discrimination does not necessarily mean that a hiring individual is
consciously prejudiced, but it can be the result of misinformation about the prospective
worker. One form of discrimination that can occur is called statistical discrimination. This
happens when firms base their hiring decision on historical group performances. When
presented with two equally skilled workers, the decision may then be based on the average
performance of the group that the applicant belongs to.

There is reason to believe that workers belonging to a group of people with a perceived
lower productivity level, will have more difficulty finding a job than a worker with a
perceived higher level of productivity. In Sweden this typically is indicated by the fact
that immigrants and people with a lower level of education will have a higher threshold
to employment, than a native-born swede with an academic education.

The discrimination coefficient helps to explain the concept discrimination into the
language of economics. An employer typically faces a hiring cost based on their
perception of a worker's cost of hiring. If a Swedish worker has a wage rate of ws and an
foreign-born worker has a wage rate of wm, an employer will act as if the cost of the
foreign-born worker is:
 wm (1 + d) SEK
where d is a positive number known as the discrimination coefficient (Borjas, 2010).

2.4 Steady-state rate of unemployment
The labour market is constantly under change and fluctuation. Workers and firms
typically need time to find each other and to make informed decisions on whether to take
on employment or hiring someone at any given time. An economy can typically
experience four different types of unemployment: frictional, structural, cyclical, and
seasonal (Borjas, 2010).

Frictional unemployment occurs when the workers and firms need time to find each other
for a job match to occur. Seasonal unemployment is when the hiring firm needs to shut
down their business during an off season and therefore also lays off its workforce. This
type of unemployment is usually predictable, a ski resort for instance will shut down
during the summer. Structural unemployment occurs when there is an uneven match

 6
between the skills of the workers and the required skills of the hiring firms. This is when
the workers skills do not “match” the jobs available in the labour market. The more
difficult type of unemployment is the cyclical unemployment as it indicates that the
economy has moved into a recession where there is a lower consumer demand versus an
excess supply of workers.

As mentioned, there will always be some unemployment due to the flow of workers. This
is typically known as the steady-state rate of unemployment. If the probability of losing

a job is defined as l and the probability of finding a job is defined as h, and the labour

force is determined by the total number of people who are either employed or unemployed
(E + U), the steady state rate of unemployment is solved by:

 Unemployment rate = U/LF = l / (l + h)

With this stated, any policy aimed at reducing unemployment levels need therefore to

alter either or both of employment and unemployment probabilities, l and h.

2.5 Negative impacts of using wage subsidies
When introducing a wage subsidy there can also be some negative impacts on supply and
demand for labour.

A substitution effect occurs when an employment opportunity would have existed
regardless of the subsidy, but that the hiring decision goes in favour of a worker from a
subsidized group instead of going to an equally skilled person from an unsubsidized
group.

Deadweight losses in turn indicate that a hiring firm receives a subsidy for hiring a worker
that they most likely would have hired even without the subsidy. The hiring decision is
therefore based on the possibility of lowering employment costs.

 7
3. Wage subsidies in Sweden

In this chapter we will present an introductory layout of the usage of wage subsidies in
Sweden and the historical background and layout of the New Start Jobs subsidy programs.
We will also give an overview of some of the international studies that have been made
on subsidy programs and how they have been used in some other countries such as
Finland, France, and Australia.

3.1 Background
The first subsidies to stimulate employment in Sweden were introduced in the early 1980s
primarily within the manufacturing industry to stimulate employment for long-term
unemployed people. In the 1990s different forms of subsidies were introduced and used
to stimulate employment for unemployed academics. Since then, the form and size of the
subsidy has changed form and different target groups have been the subject of the subsidy,
depending on the current political agenda. (Forslund, 2018)

Today there are two types of employment subsidies in Sweden. One type is for people
with a disability reducing their working capacity (lönebidrag), and the other type is for
people with other kinds of difficulties in finding work (nystartsjobb, anställningsstöd)
(Arbetsförmedlingen, 2018:8). In this thesis we will focus on one form of subsidy in the
latter type, New Start Jobs (NSJ), for long-term unemployed and foreign-born people.

3.2 New Start Jobs
In January 2007 the new political governance, ruled by the Alliance (the Moderate party,
the Liberals, the Centre party, and the Christian Democrats), introduced a new
employment subsidy in the form of New Start Jobs (Liljeberg, Sjögren, Vikström, 2012).
Up until then the use of subsidies had been limited, partially because there were not that
many types of subsidies available, but also because the rules and regulations moderated
the use of subsidies to restricted groups of people.

The target groups for NSJ are people who have been unemployed for a minimum period
of 12 months, are newly arrived in Sweden as an asylum seeker, participating in the
Labour market policy program, (jobb- och utvecklingsgarantin), receivers of financial aid
from the municipalities, sickness benefits or rehabilitation allowance. The subsidy is

 8
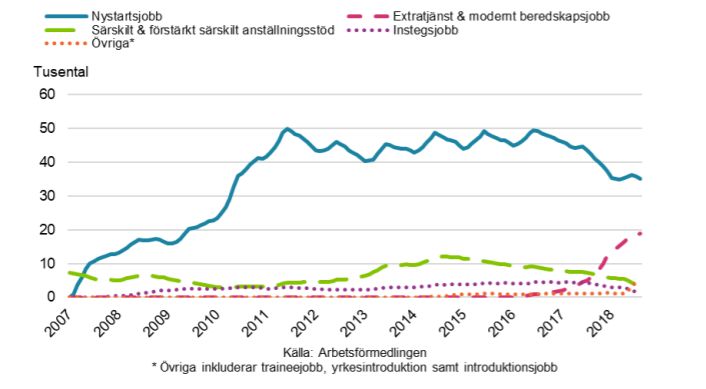
granted for one year at a time, with a maximum of 2 years. The size of the subsidy is
based on the general payroll tax that all employers in Sweden pay for an employee. In
2021 the payroll tax is 31.42 percent of an employer’s wage costs. (Arbetsförmedlingen,
2021)

One distinction of NSJ that differs from other subsidies is that NSJ does not require any
assessment. Arbetsförmedlingen is responsible for the processing of the subsidy and if
the worker and the hiring firm fulfil all the legal requirements for the subsidy the
payments are granted. This means that the risk of dead weight losses is larger with NSJ
than the other subsidies because the Public Employment Services has no possibility of
making an assessment before granting the subsidy.

In 2011 the number of people employed with NSJ reached 50.000 annually, after which
the numbers stabilized at an annual of 45.000 during the years 2012-2016. However, due
to changes in regulation in 2017 the number of people participating in the program
decreased to 30.000 during 2019 (Liljeberg et al., 2012). Because of the recent
coronavirus pandemic outbreak and overall increased unemployment levels the annual
number of people employed with NSJ dropped to 23.000 people by the end of 2020. Most
people employed with NSJ are foreign-born (82 percent) and men (more than 70 percent)
(Arbetsförmedlingen, 2021). Figure 3 shows the overall use of subsidized employment in
Sweden from 2007 to 2018, NSJ is the blue line.

Figure 3 - Number of people, age 16-64, in subsidized employments

 9
3.3 International studies

Most studies on wage subsidy programs have been conducted on high-income countries
where the results have been varied. In general, a common denominator seems to be that
wage subsidy programs help to increase employment, however with the cost of some
substitution and windfall effects (Almeida et al. 2014). Some evidence seems to point out
that wage subsidy programs that are more broadly targeted are more successful in creating
jobs (Almeida, Orr, & Robalino, 2014). In contrast to wage subsidy programs that
specifically target the disadvantaged on the job market instead tend to be ineffective in
the aspect of creating jobs. In this thesis we look primarily on the subsidy program that is
broadly targeted, in this case NSJ. In Sweden, the subsidy programs that target
disadvantaged people are called lönebidrag, introduktionsjobb and extratjänster. They all
target people who have a greater disadvantage in the job market such as people with
disabilities, foreign-born individuals who are newly arrived and the long-term
unemployed.

In Finland, an experiment was initiated in 2006 to reduce unemployment for low-skilled
workers (Huttunen, Pirttilä, & Uusitalo, 2012). Labour taxation was cut for these workers
who had to be over the age of 54, earn between 900-2000 euro per month and work full-
time. In an empirical study made by Huttunen et al. in 2010 they found that the subsidised
tax cuts had little or next to no effect on employment. Even the government reached this
conclusion based on a cost-benefit analysis with the result being that this low-wage
initiative was ended in 2010.

In several European countries wage subsidy programmes targeting young people have
been initiated to combat high long-term youth unemployment. In France and Germany,
for example, these programmes have been introduced following financial crises, since the
1970s, with varying results. The early programmes were characterized by generous
subsidies, specific target groups and several criteria the firms had to meet. Several
programmes have since been initiated in France, the “Employment Initiative Contract'',
the “Youth in Business Contract”, “Unique Inclusion Contract”, “Jobs of the Future” and
“Generation Contract”. The common denominator for these programmes has been a
reduction in the size of the subsidy and lessening of the firm's criterias to be eligible for
the subsidy. In most programs the firm is not allowed to dismiss the employee during the

 10
first three years of the employment. Roger and Zamora (2010) evaluated this policy and
found that only half of the hiring firm applied for the subsidy which indicated that the
workers protection was too costly for the firm.

In 2016 the Australian government initiated a behavioural economics trial with the aim
of increasing the use of wage subsidies (Australian Government, 2018). With a
behavioural approach the trial included small changes such as making it easier for online
signatures, a restructuring of payment methods and an overview of communication and
marketing materials to make it easier to promote wage subsidies to job seekers and
employers. The trial showed that even small and cost-effective changes could slightly
increase the number of wage subsidies. This helped to prove the point that employers are
not only led by financial incentives, but that information and knowledge of available
programs also needs to be taken into consideration.

 11
4. Hypotheses

Based on the literature review and the theoretical background on the use of wage
subsidies, following hypotheses were formed that will be tested in the empirical analysis
in section 5. For all results it is important to note that correlation is being tested for and
not causation.

The municipal taxation rates vary across Sweden where higher rates can indicate
increased expenses in the municipality (Mellander, 2021). Higher taxes in a municipality
can indicate higher unemployment and therefore more people who are eligible for
subsidized employment. The purpose of a wage subsidy is to increase demand by
lowering hiring costs. Payroll taxes are therefore used as a tool to incentivize firms to
employ people who are unemployed. Our first hypothesis for this study is formulated as
follows:

Hypothesis 1: Higher taxation levels in a municipality positively correlates with higher
utilization of NSJ in the same municipality.

People who are unemployed long-term tend to have lower levels of education. According
to data from SCB, 26 percent of people who lack upper secondary education are
unemployed. The corresponding number of people with post-secondary education is 5.2
percent. The theory of compensating differentials indicate that wages vary among
workers due to differences in the job itself and to each worker being a unique individual.
If people who are hired with NSJ have been unemployed for a longer period they are more
likely to have a lower level of education. Our second hypothesis is based on the theory
that a larger number of educated people in the municipality indicates fewer people with
lower levels of education and therefore fewer people will use and need NSJ in the
municipality.

Hypothesis 2: A higher level of education among people in the municipality negatively
correlates with higher levels of NSJ use in the municipality.

Unemployment amongst people who are foreign-born generally is 18.8 percent. For
people with origins from Africa and Asia unemployment can be as high as 30 and 28

 12
percent respectively. The discrimination coefficient indicates that hiring firms perceives
the hiring costs to be higher when considering someone that is different in some way than
themselves. Since the purpose of a wage subsidy is to incentivize the employer by
lowering their hiring costs, a wage subsidy helps to reduce the perceived wage rate
excluding the discrimination coefficient. Therefore, our third hypothesis is as follows:

Hypothesis 3: Foreign born immigrants are more likely to be hired with the NSJ subsidy
than native born people.

 13
5. Empirical model and data

Data was collected from two main sources for the empirical analysis, the Swedish
Employment Agency and Kolada. Population, population per kilometre, employment,
unemployment, workforce, number of foreign-born residents, taxation level, and
education level data was collected from Kolada (Kolada, 2021). The data collected from
Kolada was collected for each individual municipality. Post-secondary education data
was collected for individuals in a municipality. This was data for the entire population of
a municipality and not only the working population. Data for total participation as well
as average participation in the NSJ program was collected for each municipality from the
Swedish Employment Agency, Arbetsförmedlingen (www.arbetsformedlingen.se, n.d.).

All of the data for each variable was transformed into percentages, this was done to ensure
that the data was all analysed using the same units. To achieve this the unemployment
data was transformed into a share of the total workforce and then a percentage. The total
workforce is defined as the number of people of working age currently employed or with
the ability to work. The taxation rates were already given as a percentage. The percentage
of foreign-born individuals and residents with a post-secondary education was calculated
using the total population of a municipality. A more descriptive look at each variable's
data is found in Table 1 below.

Table 1 - Descriptive statistics for the data series.
 Variable Mean Median Max Min Stand. Dev.
 Average NSJ 0.53 0.46 1.82 0.09 0.29
 Unemployment 5.73 5.50 12.9 2.30 1.98
 Taxation 33.03 33.19 35.15 29.18 1.14
 Foreign-born 15.63 14.30 42.9 6.70 6.37
 Post-secondary 33.79 31.20 74.00 19.50 9.82

EViews was used to conduct statistical analysis on the data. Using the collected data, a
cross sectional analysis was performed on data from 2019, the most recent full year of
data, to test the hypotheses. The ordinary least squares method was used for all three
models because there were multiple independent variables (Gujarati & Porter, 2009).

 14
The dependent variable was defined as the percentage of the working age population who
received NSJ in 2019 in each municipality. The independent variables tested were the
percentage of unemployed people, municipal tax rate, percentage of foreign-born
individuals and share of the total population with a post-secondary education. A
regression analysis was used to see if there was a statistical significance in the share of
NSJ in the workforce of a municipality. A least squares model was chosen for the analysis
in EViews, with 290 observations, based on the different municipalities. A hypothesis
was accepted if the calculated critical value, probability, was between 0.00-0.05 and
rejected if it fell outside of that range. An acceptable EViews analysis was defined as
having an R-Squared value higher than 0.6.

5.1 Dependant Variable

Y = percentage of average Nystartsjobb in the working age population in the municipality

5.2 Independent Variables

 1= Intercept

 2 = Share of unemployment of the working population in the municipality

 3 = Municipal tax rate

 4 = Share of foreign-born individuals in the municipality

 5 = Share of total population in the municipality with post-secondary education

5.3 Dummy Variables

d1 = 1 if smaller municipalities with population < 20.000 ppl, otherwise 0

d2 = 1 if larger municipalities with population > 200.000, otherwise 0

These dummy variables were chosen to allow for mid-size municipalities to be the
reference group. Mid-size cities were defined as cities with a population between 20.000
to 200.000 people.

 15
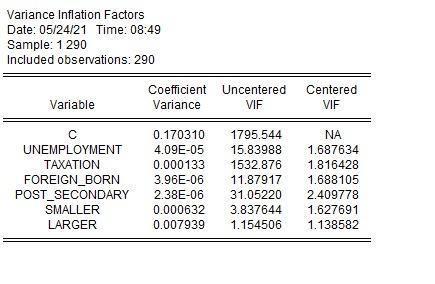
5.4 EViews equations
The following equations was used in EViews for the analysis, two different models were
formed, first with only the dependent and independent variables and second with the
dependent, independent and dummy variables:

Model 1: = 1 + 2 unemployment + 3 foreign born + 4 taxation + 5 post-
secondary + u

Model 2: = 1 + 2 unemployment + 3 foreign born + 4 taxation + 5 post-
secondary + 6 smaller municipalities200.000 + u

5.5 Correlation, Variance Inflation Factors, Durbin-Watson and Robustness
 Testing
Before evaluating data through the model several tests were done to check for or correct
several common problems associated with regression analysis. For this model
autocorrelation and multicollinearity were the main concerns and robustness testing was
done to address these potential issues (Gujarati and Porter, 2009).

Table 2 - Correlation matrix for all correlation coefficients
 Avg.NSJ Unemployment Taxation Foreign- Post-
 born secondary
 Average NSJ 1.0
 Unemployment 0.810 1.0
 Taxation 0.19 0.18 1.0
 Foreign-born 0.42 0.45 -0.32 1.0
 Post-secondary -0.38 -0.35 -0.59 0.10 1.0

The correlation matrix, Table 2, was generated in EViews, the original table located in
Appendix A3. Correlation coefficients were categorized into six categories based on their
value. A coefficient with a value above 0.9 was classified as very highly correlated,
between 0.7-0.9 was highly correlated, between 0.5-0.7 was moderately correlated,
between 0.3-0.5 was lowly correlated and less than 0.3 as very little to non-existent linear
correlation (Gujarati and Porter, 2009). For this model there was no coefficient that was
classified as very highly correlated and only the average NSJ and unemployment
coefficient classified as highly correlated. This correlation is to be expected because the
success and use of the NSJ program has a direct impact on the unemployment rate. People
who use the program with therefore, no longer be unemployed. However, because of this

 16
high correlation the Variance Inflation Factors (VIF) were also determined to check for
multicollinearity, Table 3.

Table 3 - Variance Inflation Factors for dependent and independent variables
 Variable Uncentered VIF Centered VIF

 Average NSJ 1795.54 NA
 Unemployment 15.84 1.69
 Taxation 1532.88 1.82
 Foreign-Born 11.88 1.69
 Post-Secondary 31.05 2.41
 Smaller Municipalities 3.84 1.63
 Larger Municipalities 1.15 1.14

A high VIF indicates that an independent variable is highly collinear with the other
variables in the model. As a rule of thumb, a centered VIF larger than 10 can be a sign of
multicollinearity (Gujarati and Porter, 2009). Fortunately for this model none of the
variables have a value above 10. So based on the VIF and on the correlation matrix the
problem of multicollinearity is not present in this specific EViews model.

To check for autocorrelation a Durbin-Watson test was performed for each of the models,
Table 4.

Table 4 - Durbin-Watson test for autocorrelation.
 Model 1 Model 2
 Durbin-Watson 1.975678 1.973832
 Number of 290 290
 Observations

H0: = 0 (there is no autocorrelation)
H0: < 0(there is positive autocorrelation)

We find the critical values: dU=1.728 dL=1.810 from a known Durbin-Watson statistic
table (Gujarati and Porter, 2009). For Model 1 the Durbin-Watson value is dD=1.975.
H0 is not rejected because dD>dU meaning there is no autocorrelation. For Model 2 the
Durbin-Watson value is dD=1.974. H0 is not rejected because dD>dU meaning there is

 17
no autocorrelation we do not reject H0, since dD>dU so that means there is no
autocorrelation in this model either.

 18
6. Empirical results and discussion

The purpose of a wage subsidy is to incentivize employment in a depressed labour market.
This can assist individuals who are not the first choice of employers, often because
employers are risk averse to individuals who may only increase productivity marginally
while increasing expenses.

The hypotheses were formed considering several factors which may affect the
effectiveness of the wage subsidy. The taxation rate of a municipality could affect
motivation for a hiring firm to employ someone with a wage subsidy. Higher taxation
rates may indicate greater expenses for employers when increasing the total number of
employees that may not be overcome with a wage subsidy.

The level of education could also affect the need for a wage subsidy. People with higher
levels of education are less likely to need a wage subsidy to remedy long-term
unemployment. Municipalities with lower percentages of people with post-secondary
education could have higher utilization of the New Start Jobs program.

Finally, the percentage of foreign-born individuals in a municipality could also correlate
with use of a wage subsidy as these individuals could be classified as less desirable in the
labour market. This classification of less desirable could be due to a myriad of factors
which will not be covered in this analysis.

The full analysis results are in Table 5 on the following page, the original Eviews output
for the corresponding models are in the Appendix A5 and A6.

 19
Table 5 shows Eviews output coefficients and (p-values) for dependent, independent, and
dummy variables for Models 1-3. R-squared values are also included for each model.

Table 5 - Eviews output coefficients and (p-values)
 Model 1 Model 2

 Variables Coefficients: Coefficients:
 (P-value): (P-value):
 Intercept -0.281755 -0.291664
 0.4886 0.4803
 Unemployment 0.102108 0.102320
 0.00000 0.00000
 Taxation 0.008010 0.007969
 0.4818 0.4903
 Foreign-born 0.005665 0.005730
 0.0039 0.0043
 Post-secondary -0.003839 -0.003652
 0.0033 0.0186
 Dummy: smaller 0.004919
 0.8450
 Dummy: Larger -0.011239
 0.8997
 Probability F- 0.00 0.00
 Statistic
 R-squared 0.676813 0.676872

 Number of 290 290
 Observations

6.1 Model 1 - Independent variables
The three independent variables considered in the analysis of this hypothesis were,
unemployment, foreign born individuals in a municipality and taxation rate. The
probability F-statistic, which shows the combined effect of all the independent variables
on the dependent variables, is zero for this analysis. This is less than 5% meaning there
is a low chance of error, and the combined effect is confirmed to be statistically significant
or considerable. The R-Squared value for this regression was 0.676, above the 0.6 limit

 20
so the regression was acceptable. A higher R-Squared value is desired because it means
that there is less unexplained variability in the model.

6.1.1 Municipal taxation rates and wage subsidy use
Higher taxation rates may make businesses less likely to hire additional employees
because of the additional business expenses, including contribution to social security
(Swedish Agency for Economic and Regional Growth, 2021). This disincentive could
increase long-term unemployment in a municipality. A wage subsidy like the NSJ
program would make it cheaper to hire a new employee and could help to overcome this
higher tax rate.

In the first model the p-value, 0.48 for the taxation variable was above the previously
stated 0.05 threshold, meaning that the municipal tax rate was statistically insignificant
for this model. The coefficient for the taxation rate was positive, indicating there could
be a positive correlation between increased municipal tax rates and the increased use of
NSJ. However, based on the p-values this hypothesis must be rejected for this thesis.

6.1.2 Post-secondary education and wage subsidy use
The p-value of 0.0033 for the post-secondary education variable is below the maximum
of 0.05 for statistical significance. Because of this the data is accepted. If the percent of a
municipality’s population with a post-secondary education increases by one percent, then
NSJ decreases by 0.003839 or 0.3839 percent. The second hypothesis, higher post-
secondary education negatively correlates with higher use of the NSJ program is correct.

The purpose of a wage subsidy is to increase demand for a less desirable workforce. It is
likely that people with post-secondary education are already desirable candidates for
employment and therefore, do not need the wage subsidy to remedy long-term
unemployment. This could explain the decrease in NSJ use as the population becomes
more educated. If Sweden wanted to reduce its long-term unemployment for the future,
educating individuals could help to lower the need for a wage subsidy.

 21
6.1.3 Percentage of foreign-born individuals and wage subsidy use
If the foreign-born population increases by one percent, then New Start Jobs will also
increase by 0.005706 or 0.5706 percent, Table 5. The independent variable, percentage
of foreign-born individuals should be considered significant because the critical value of
0.0033 is below the limit of 0.05. The third hypothesis can be accepted based on these
results. There is a positive correlation to the percentage of foreign-born individuals and
utilization of NSJ. The net effect from the foreign-born individual’s variable is larger than
the measured net effect of post-secondary education. This is consistent with the
correlation matrix, Table 2, which showed a larger correlation for the foreign-born
variable to both unemployment and NSJ.

The unemployment rate amongst the foreign-born population in Sweden is significantly
higher than the native-born population. This could be due to several reasons; foreign-born
people may have a more difficult time integrating into a new workforce. Those
individuals may need continued wage subsidy and support if discrimination, conscious or
unconscious, is prevalent in society. Borjas, 2010, has demonstrated the additional
perceived cost to hiring a foreign-born worker. There may also be a skill or language
barrier which would prevent quick employment for an individual. The potential that in
the short term, qualified and specialized individuals may need to pass additional
certifications to use their skills in a new country is an additional factor. For example,
doctors, teachers, or dentists may need additional language or certification to transfer their
degrees to the Swedish job market. These supplementary factors could explain the greater
need for foreign born individuals to use a wage subsidy to alleviate unemployment.

6.2 Model 2 - Dummy variables
A dummy variable is a variable that takes the values of 0 or 1. When the value is 0, there
is an absence of a categorical effect that could shift the outcome and when the value is 1
it indicates the presence of a categorical effect that could shift the outcome. Where a
categorical variable has more than two categories, it can be represented by a set of dummy
variables, with one variable for each category minus one (Gujarati and Porter, 2009). The
dummy variables were included in a separate model to explore the influence of
municipality size on the significance of all three independent variables. Select results of

 22
this model are available in Table 5, full Eviews results are available in Appendix A6. The
probability F-statistic was zero for the dummy model. This is less than 5% meaning there
is a low chance of errors, and the combined effect is confirmed to be statistically
significant or considerable. The R-Squared for the second regression was and third
regression was 0.676872, meaning 67.69 percent of the variation in the dependent
variables is explained by the model. This value was above the minimum of 0.6, so each
model was considered acceptable.

In Model 2, the first dummy value, has a p-value of 0.8450 and the second dummy
variable has a p-value of 0.8997, which is well above the maximum value of 0.05.
Because of this Model 2 is considered statistically insignificant, and the results were not
considered in the final analysis of this thesis. Dummy variables are frequently used in
time series analysis and this thesis focuses on a singular year. This thesis is a singular
year study, and this could be the reason both the dummy variable model is statistically
insignificant. The reason for the dummy variable insignificance could also be due to the
fact that only 1.4% of municipalities in Sweden are classified as large. Continued research
on a multi-year analysis would benefit from the addition of a dummy variable.

6.3 Suggestions for further research
Future studies on the effectiveness of the NSJ program could be expanded to include
multiple years. A multi-year study could further capture the effectiveness of the program
through varying waves of immigration. This could be very important because the majority
of individuals who currently use the NSJ program are foreign-born, 82%
(Arbetsförmedlingen, 2021). Importantly though, one singular program like NSJ is not
the only determining factor in employment prospects for a diverse group of people.
Foreign-born individuals could have different countries of origin, different skills, and
varying levels of education which all factor into the need for a wage subsidy program.

The current data does not differentiate between single-use and multi-use individuals,
which could provide further insight into the long-term effectiveness of the program and
participation. Currently, each use of the program is treated separately even if it is by the
same individual at different times and for different employment opportunities. Further

 23
investigations would require a change in the reporting of the program and data collection,
which would need to be implemented by the Swedish Public Employment Agency.

7. Conclusions

Sweden has an almost forty-year history of using a policy of active labour market
intervention that has been shown to reduce long-term unemployment through wage
subsidies. Several European countries have also benefited from wage subsidy job
programs, including Australia, Germany, France, and Finland. Results, however, have
varied for these other countries. Several studies have also provided evidence that wage
subsidies are more effective at creating jobs then other government financial policy tools.
This is especially true if the wage subsidy is sufficiently broad. This study aimed to see
the correlation of several determining factors, taxation rates, post-secondary education,
and percentage of foreign-born individuals, on the use of an existing wage subsidy in
Sweden.
Only two of the presented hypotheses were proved statistically significant using Swedish
Public Employment Agency data from 2019. There was no significant statistical result
for the municipal taxation rates and utilization of NSJ. The percentage of foreign-born
individuals in a municipality led to increased use of the NSJ program, while an increased
percentage of individuals with a post-secondary education reduced the overall use. The
addition of municipal population for a dummy variable, showed that size of a municipality
has no statistically significant correlation on use of the program, which could be attributed
to the limited study period. Further long-term investigation would need to be conducted
on the NSJ program to study the long-term effects each of these variables have on
program use.
Future government spending could be more targeted at these variables to either reduce or
increase spending on the program to reduce overall long-term unemployment. If the aim
is to increase usage of a wage subsidy the Australian behavioral experiment could be used
as an example. To lower risk of discrimination and risk aversity the wage subsidy fulfills
its purpose and there should be an incentive for the government to take a closer look at
these variables.

 24
1. Reference list

Almeida, R., Orr, L., & Robalino, D. (2014). Wage subsidies in developing countries as
 a tool to build human capital: design and implementation issues. IZA Journal of
 Labor Policy, 24.
Applying Behavioural Economics to Increase the Take-up of Wage Subsidies. (2021, 4
 15). Retrieved from Employment Research and Statistics:
 https://www.dese.gov.au/employment-research-and-
 statistics/resources/applying-behavioural-economics-increase-take-wage-
 subsidies
Arbetsmarknad. (2021, 4 12). ekonomifakta. Retrieved from
 https://www.ekonomifakta.se/Fakta/Arbetsmarknad/
Boockmann, B. (2015). The effects of wage subsidies for older workers. IZA World of
 Labor, 10.
Borjas, G. J. (2010). Labor Economics - Fifth Edition. McGraw-Hill International
 Edition.
Brakman, S., Garretsen, H., & van Marrewijk, C. (2009). The New Introduction to
 Geographical Economics. Cambridge University Press.
Braun, S., & Spielmann, C. (2010). Wage subsidies and international trade: When does
 policy coordination pay? Kiel institute for the World Economy.
De subventionerade anställningarna ska ses över. (2016, 11 11).
 Arbetsmarknadsdepartementet. Retrieved from
 https://www.regeringen.se/pressmeddelanden/2016/11/de-subventionerade-
 anstallningarna-ska-ses-over/
Employing staff. (2021). Swedish Agency for Economic and Regional Growth. Retrieved
 from https://www.verksamt.se/web/international/running/employing-staff
Forslund, A. (2018). Subventionerade anställningar - Avvägningar och empirisk evidens.
 IFAU.
Fri sökning, Nyckeltal - Kolada. (2021, March). Retrieved from Kolada:
 https://www.kolada.se/
Gottfries, N. (2013). Macroeconomics New Edition. Palgrave Macmillan.
Gujarati, N. D., & Porter, C. D. (2009). Basic Econometrics. McGraw-Hill Irwin.

 25
Huttunen, K., Pirttilä, J., & Uusitalo, R. (2012). The employment effects of low-wage
 subsidies. Journal of Public Economics, 49-60.
Kopits, G. F. (1978). Wage Subsidies and Employment: An Analysis of the French
 Experience. Staff Papers (International Monetary Fund) Vol. 25, No. 3, 494-527.
Kornerud, S., Mångs, A., & Olsson, H. (2018). Subventionerade anställningar - en
 översikt. Arbetsförmedlingen.
Liljeberg, L., Sjögren, A., & Vikström, J. (2012). Leder nystartsjobben till högre
 sysselsättning? . IFAU.
Lombardi, S., Nordström Skans, O., & Vikström, J. (2018). Wage subsidies, job-
 displacement and Swedish firms: A comparison between policy systems. IFAU.
Mellander, C. (2021, 05 24). Så skiljer sig kommunalskatten i svenska kommuner.
 Jönköping. Retrieved from https://ju.se/portal/vertikals/blogs/charlotta-
 mellander/bloggposter/2018-11-26-sa-skiljer-sig-kommunalskatten-i-svenska-
 kommuner.html
Neumark, D., & Grijalva, D. (2013). The employment effects of state hiring credits during
 and after the great recession (No. w18928). National Bureau of Economic
 Research.
Pärlemor, L., & Eriksson, J. (2016). Subventionerade anställningar – Kartläggning ur ett
 bransch- och företagsperspektiv. Arbetsförmedlingen.
Pärlemor, L., & Eriksson, J. (2018). Subventionerade anställningar – En översikt.
 Arbetsförmedlingen.
Rita, A., Orr, L., & Robalino, D. (2014). Wage subsidies in developing countries as a tool
 to build human capital: design and implementation issues. IZA Journal of Labor
 Policy, 24.
SCB. (2019:1). Regionala indelningar i Sverige den 1 januari 2019 Meddelanden i
 samordningsfrågor för Sveriges officiella statistik.
SKR Kommungruppsindelning. (2021, Mars 11). Retrieved from Sveriges kommuner och
 regioner:
 https://skr.se/tjanster/kommunerochregioner/faktakommunerochregioner/kommu
 ngruppsindelning.2051.html

 26
2. Appendix

Appendix 1 - Map of municipalities in Sweden

 27
28
Appendix 2 - Descriptive statistics for the data series

Appendix 3 - Correlation Matrix

Appendix 4 - Variance Inflation Factors

 29
Appendix 5 - Model 1 - EViews output

Appendix 6 - Model 2 - EViews output

 30
Appendix 7 - Actual fitted residual tables for all municipalities

 31
32
33
34
35
36
37
38
39
You can also read