CLEAN JOBS AMERICA 2020 - REPOWERING AMERICA'S ECONOMY IN THE WAKE OF COVID-19
←
→
Page content transcription
If your browser does not render page correctly, please read the page content below
APRIL 2020
                                                                        WWW.E2.ORG
                                                                        @E2ORG
                                                                        #CLEANJOBSAMERICA

          CLEAN JOBS AMERICA 2020
                          REPOWERING AMERICA’S ECONOMY IN THE WAKE OF COVID-19

© Dennis Schroeder/NREL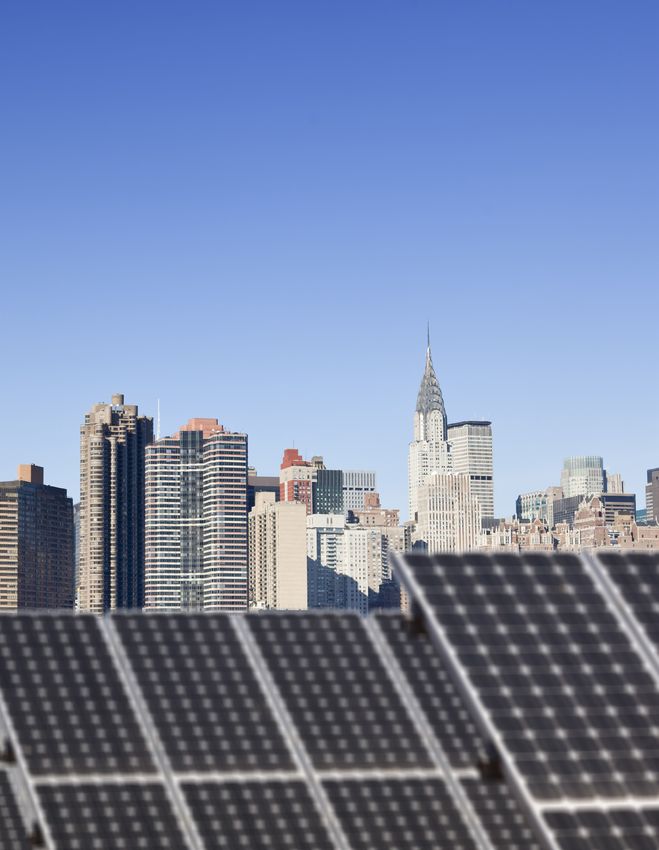
CLEAN JOBS AMERICA 2020 1
REPOWERING AMERICA’S ECONOMY IN THE WAKE OF COVID-19
As lawmakers and policymakers seek to get America back to work after the COVID-19 health
and economic crisis, every job matters, from airline employees and hospitality workers to retail
clerks and restauranteurs. We also cannot forget the employment sector that has become one
of the biggest, fastest-growing and most beneficial for both our economy and our environment.
The clean energy sector
E2’s 2020 Clean Jobs America report details And right now, they are hurting. After the Great Recession, no part of the
the sheer size of this important employment 2009 American Recovery and Reinvestment
sector, the troubles it is currently facing due COVID-19 hammered the clean energy Act (ARRA) was more successful than
to COVID-19 and how focusing recovery sector. According to our estimates, more the $90 billion in federal investments in
policies on clean energy can get America’s than 106,000 workers are in clean energy- clean energy. In the years following ARRA,
economy humming again—quickly and for related companies lost their jobs in just the nearly 1 million clean energy jobs were
the long run. first few weeks after the pandemic began.3 created. Hundreds of new made-in-America
See details in the sidebar on the next page businesses—game-changing companies
Before the COVID-19 crisis, nearly 3.4 and read some of their stories in the pages such as Tesla which employed 45,000
million Americans worked in clean energy— that follow. workers before the crisis—got their start with
solar, wind, energy efficiency, clean vehicles, ARRA-era Department of Energy loans that
and more, according to this new analysis. As federal and state lawmakers look toward
were repaid in full. More than 100,000 wind,
For perspective, that’s more people than economic recovery, this report shows how
solar and other clean energy projects were
worked as school teachers or farmers or clean energy is a major part of the economy
started, bringing new investments and job
real estate brokers in our country, and three of every state, employing workers in inner
opportunities to states across the country.4
times as many as worked in fossil fuels.2 cities as well as rural areas, regardless of
geography, politics or natural resources. Recovery Act investments also led to the
Who are these workers? They are technicians Small businesses—the backbones of weatherization of more than 1 million
and tradespeople who pull on their gloves, America’s economy—employ nearly two out homes, expanding energy efficiency work
lace up their boots and squeeze into attics of three clean energy workers. And clean across the country and quickly getting
and boiler rooms to better insulate our energy companies hire a greater percentage electricians, HVAC technicians and
buildings and improve our heating, air of veterans than the national average. other construction workers—as well as
conditioning and ventilation systems. manufacturers of building supplies and
Most importantly at this time, Clean Jobs
Energy Star appliances—back to work. And
They are electricians who design and America shows why it’s imperative for
along the way, consumers and businesses
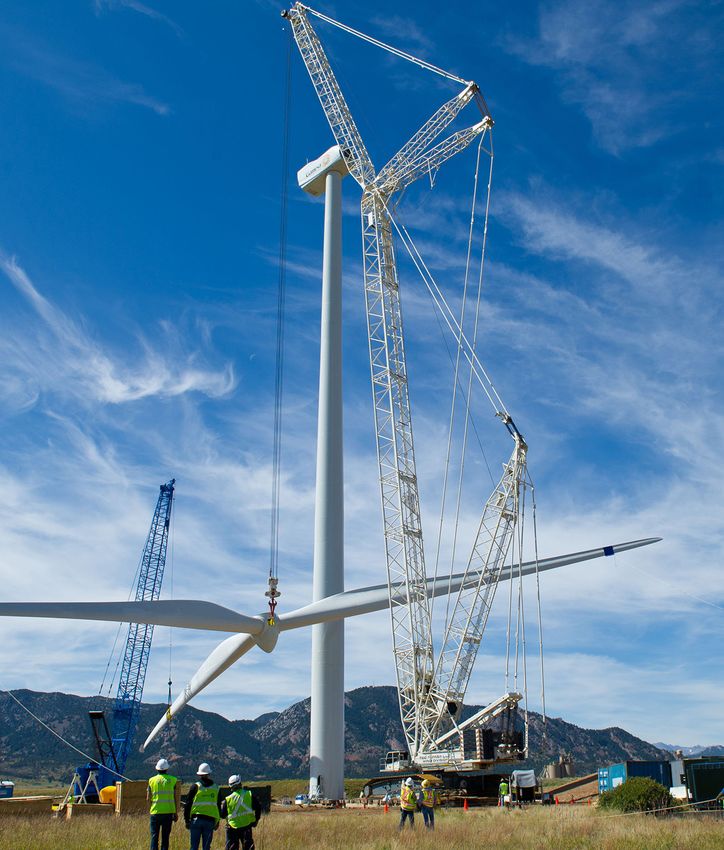
install LED lighting systems; scurry across lawmakers to focus on clean energy in
saved billions of dollars, our environment
hot rooftops to install solar panels; climb economic stimulus packages and other
benefitted and our nation became more
into the sky to work on wind turbines and policies aimed at restarting our economy
energy secure.
upgrade our electricity grid to make it safer, and keep in mind the benefits that will come
more reliable and ready for renewable with a cleaner, more resilient economy in The right clean energy stimulus policies can
energy. the future. once again get this big and game-changing
part of America’s workforce back on the
They are factory workers who build Energy This is an industry that simply cannot be
job. In doing so, we can quickly repower our
Star appliances and building supplies; high- ignored. As history shows, it is a proven
economy—and in ways that make it cleaner,
efficiency HVAC systems; hybrid and electric catalyst for quick job growth in the aftermath
more resilient and better positioned for
vehicles and the parts that go in them. of economic meltdown.
continued growth.
2 // E2 CLEAN JOBS AMERICA 2020
THE CURRENT SITUATION
Clean Energy Unemployment Claims Skyrocket in COVID-19 Aftermath
More than 106,000 clean energy workers          What had been one the nation’s fastest-            The clean energy economy has previously
lost their jobs in the month of March alone,    growing jobs sectors at the start of the year      weathered choppy seas, but this storm is
wiping out all the job gains in renewable       by March was experiencing significant job          wholly different.
energy, energy efficiency, clean vehicles       losses every week.
and other clean energy sectors in 2019,
                                                The job losses are across a wide variety           Unemployment Claims
according to an analysis of unemployment
                                                of occupations, and in every state. Energy         by Clean Energy Workers,
data by BW Research for E2.
                                                efficiency workers are losing their jobs after     March 20203
The March layoffs were just the first           being shut out of homes and buildings to
indication of how badly the clean energy        prevent the spread of the coronavirus. Solar        Industry              Unemployment Claims
industry has been hit by the COVID-19 and       and wind turbine companies are laying off           Energy Efficiency            69,800
economic crises. Much bigger job cuts are       workers as they’re unable to access panels          Renewable Energy             16,500
expected in the months ahead—making             and parts stranded in shut-down factories           Clean Vehicles               12,300
it imperative that Congress and state           and as financing disappears. Factory
                                                                                                    Grid & Storage                4,300
lawmakers seek ways to get the industry         workers are being let go as assembly lines
                                                                                                    Clean Fuels                   3,400
back on its feet, especially since clean        for Energy Star appliances and electric and
energy has a proven history of helping pull     hybrid vehicles are ground to a halt.               Total                      106,400

the country out of economic crises.

States With Most Clean Energy Job Losses, March 20203
                                                 Share of Clean                                                          Share of Clean
 State                    Unemployment Claims                            State                   Unemployment Claims
                                                 Energy Worforce                                                         Energy Worforce
 US TOTAL                       106,472                3.10%             Minnesota                          2,415              3.70%
 California                      19,949                3.60%             New Jersey                         2,345              4.10%
 North Carolina                   6,800                5.90%             Virginia                           2,044              2.10%
 Pennsylvania                     6,068                6.20%             Wisconsin                          2,031              2.60%
 Massachusetts                    5,611                4.40%             Maryland                           1,954              2.30%
 Michigan                         5,446                4.10%             Kentucky                           1,505              3.80%
 New York                         4,789                2.90%             Tennessee                          1,492              1.70%
 Ohio                             4,719                4.10%             Louisiana                          1,463              4.60%
 Texas                            4,246                1.70%             Missouri                           1,462              2.50%
 Washington                       3,940                4.40%             Georgia                            1,332              1.50%
 Illinois                         3,326                2.60%             Oregon                             1,324              2.20%
 Florida                          2,673                1.60%             Colorado                           1,080              1.60%
 Indiana                          2,592                2.90%             Iowa                               1,066              2.90%

3 // E2 CLEAN JOBS AMERICA 2020
Reaction from the Frontlines
Despite how far the clean energy sector has come over the last five years, the economic impact
of the COVID-19 crisis is quickly devastating businesses, workers, and project from coast to coast.
As lawmakers look to reinvigorate our economy and get America back to work, E2 surveyed its
8,000 members and supporters nationwide about how they’re being impacted, and how public
policy could help.
This is the new reality their operations and workers are facing. In their own words:
MARK HALL MICHAEL RUCKER EMILY RICE GREG SMITH LLOYD KASS
Founder, Revalue.io CEO, Scout Clean Energy COO, The Energy Group Founder, Energy Optimizers VP of Policy and Business
California Colorado Iowa Ohio Development, Lime Energy
New Jersey
“We had 5 residential “As I talk to banks … they “We were on track for our “We have terminated
retrofit projects that were are in a panic situation best year ever when this the employment of “We are devastated by the
supposed to begin ... that I haven’t seen since happened. We spent over approximately 25 percent coronavirus. Nothing we
but cannot due to the 2008.” $880k on solar panels of our personnel. We have do is considered ‘critical
shutdown, as well as 1 from China that have been had over $10 million service’ so installing
warehouse project. Much stuck overseas due to of projects halt moving energy efficiency and solar
of our work is in workforce factory shutdowns. Now forward, impacting the panels in California is
development, as we train they are closing schools jobs of at least 150 completely shut down. We
high school, college and and we are losing staff people.” can’t go into apartment
other adults in energy due to self-quarantine. units to do energy audits
efficiency technology. I suspect this is only going or efficiency upgrades
We now have to alter our to get worse.” in NYC. We are facing
training plans and reduce substantial furloughs
our outreach and business for staff and pay cuts
development.” for the ones who aren’t
furloughed.”
4 // E2 CLEAN JOBS AMERICA 2020CLEAN ENERGY JOBS OVERVIEW
One of the many benefits of focusing federal Holland-Grand Haven metro areas led NATIONAL CLEAN
and state economic recovery efforts on the country with clean energy accounting
clean energy is the fact that doing so can for over eight percent of their overall ENERGY EMPLOYMENT
preserve and create new jobs in every state: employment in 2019. Other metros among Q4 2019
in rural and urban areas, and across a wide the Top 25 per capita included Provo (Utah),
variety of occupations. Elizabethtown (Ky.) Fort Wayne (Ind.),
Wilmington (N.C.), and Boulder (Colo.),
At the start of 2020, clean energy while San Francisco and San Diego were
employment increased for the fifth straight the only metros to place among the top 25
year since this annual report was first in both total and per capita clean energy
released—growing beyond 3.3 million employment.
workers nationwide.
Clean energy also proved to be critical to TOTAL:
While California remained the nation’s rural economies in 2019: North Carolina 3,355,419
undisputed leader in clean energy jobs leads the country for clean energy jobs in
through 2019, states as diverse in size rural areas with nearly 29,000 workers,
and structure as Texas and Massachusetts followed by Michigan and Texas.
also are in the top ten for clean energy
jobs. Florida, North Carolina and Georgia Overall, clean energy jobs across the
continued to lead the South, while Michigan, country grew by slightly more than two
Illinois and Ohio led the Midwest. On a per percent in 2019, slower than its nearly four
capita basis of statewide total employment, percent growth in 2018. Jobs in renewable n Energy Efficiency: 2,378,893
the Northeast claimed the top five spots energy grew more than three percent, led n Renewable Energy: 522,811
with Vermont, Rhode Island, Massachusetts, in part by a rebound in solar jobs. Clean
Maryland, and Delaware employing the energy storage and grid modernization n Clean Vehicles: 266,368
largest share of clean energy jobs per capita jobs increased four percent—faster than
in the country. any other sector—while clean vehicle n Grid & Storage: 147,644
employment declined by about two percent
As expected, America’s large metro areas— n Fuels: 39,704
after a 17 percent jump in 2018. Energy
led by New York City, Los Angeles, San efficiency remains the single biggest sector
Francisco, and Chicago—outpaced the of the clean energy economy, growing over
country in total clean energy employment, two percent in 2019 and adding the most
with metros Denver, Houston, and net new jobs (54,000) across the entire
Philadelphia among the top 20 and Kansas energy sector.
City, Milwaukee, and Raleigh among the
top 40. However, small and mid-sized As a result of the industry’s consistent
metros dominated when clean energy jobs growth, clean energy accounted for more
were analyzed per capita. California’s San than 40 percent of America’s entire energy
Luis Obispo-Paso Robles and Michigan’s workforce and over 2.25 percent of the
nation’s overall employment at the end
of 2019.
5 // E2 CLEAN JOBS AMERICA 2020STATEWIDE CLEAN ENERGY EMPLOYMENT Q4 2019
42 states and the District of Columbia employed more clean energy than fossil fuel workers in 2019.
5
4 7
1 6 8
10
9
n Top 10 States
2 n States 11-20
3
Rank STATE TOTAL* Renewables Grid & Storage Energy Efficiency Clean Fuels Clean Vehicles
1 California 536,919 142,957 24,021 323,529 5,785 40,627
2 Texas 241,289 39,303 13,204 169,398 2,073 17,309
3 Florida 166,032 24,987 5,499 123,560 2,897 9,090
4 New York 159,337 18,049 4,290 126,739 1,680 8,579
5 Michigan 125,365 11,447 3,896 85,323 625 24,073
6 Illinois 125,364 17,707 5,077 91,024 1,468 10,088
7 Massachusetts 122,477 21,963 7,050 88,231 569 4,664
8 Ohio 114,388 10,607 3,135 83,165 1,353 16,129
9 North Carolina 112,720 12,349 3,727 88,001 1,538 7,105
10 Virginia 97,305 9,047 2,520 80,181 312 5,245
11 Pennsylvania 93,861 9,744 3,698 71,443 1,436 7,541
12 Indiana 86,892 10,975 3,107 55,663 779 16,369
13 Washington 85,035 11,189 3,628 64,930 1,936 3,351
14 Maryland 84,549 8,203 2,001 71,337 170 2,839
15 Georgia 83,806 8,751 4,241 62,924 467 7,423
16 Tennessee 79,626 5,763 8,778 53,916 1,198 9,971
17 Wisconsin 76,685 5,958 2,175 63,569 368 4,615
18 Colorado 62,420 17,924 3,072 36,092 2,120 3,212
19 Arizona 62,106 11,629 2,273 44,782 345 3,077
20 Minnesota 61,805 7,920 2,899 47,114 681 3,191
* Total includes renewable energy, energy efficiency, clean vehicles, battery storage, advanced biofuels, low-impact hydro and other sectors.
6 // E2 CLEAN JOBS AMERICA 2020STATEWIDE CLEAN ENERGY EMPLOYMENT Q4 2019 continued Rank STATE TOTAL* Renewables Grid & Storage Energy Efficiency Clean Fuels Clean Vehicles 21 New Jersey 57,139 12,569 1,913 37,982 396 4,278 22 Oregon 56,617 7,540 2,873 42,935 776 2,493 23 Missouri 56,486 5,316 1,950 42,537 921 5,762 24 South Carolina 46,527 7,336 2,052 30,794 652 5,693 25 Utah 44,005 8,118 1,079 32,483 109 2,215 26 Alabama 43,828 3,839 1,927 31,546 223 6,294 27 Connecticut 42,455 3,492 761 36,000 337 1,865 28 Kentucky 38,266 2,277 1,380 26,221 289 8,097 29 Nevada 33,788 11,265 9,098 11,988 138 1,299 30 Iowa 32,057 5,796 1,434 21,165 879 2,783 31 Louisiana 31,109 4,352 1,614 23,261 237 1,645 32 Kansas 24,909 3,874 1,059 17,848 288 1,840 33 Oklahoma 22,765 3,199 1,587 15,046 909 2,024 34 Mississippi 20,985 1,508 833 15,668 512 2,464 35 Arkansas 20,377 1,694 806 15,492 565 1,820 36 Nebraska 19,440 3,138 508 13,949 211 1,633 37 Vermont 16,635 2,439 1,024 11,032 688 1,451 38 New Hampshire 16,571 3,377 311 11,913 143 827 39 Rhode Island 16,429 2,066 681 13,028 322 331 40 District of Col. 15,383 1,821 313 12,982 17 251 41 Delaware 13,943 725 233 12,543 76 366 42 Hawaii 13,927 4,830 549 6,083 2,072 394 43 Idaho 13,181 1,763 1,076 9,035 275 1,032 44 Maine 12,798 2,512 472 8,879 213 721 45 New Mexico 12,365 4,614 762 6,099 113 777 46 South Dakota 11,458 2,327 445 7,628 194 863 47 Montana 10,376 464 418 8,838 51 605 48 West Virginia 10,078 1,171 859 7,144 30 873 49 North Dakota 9,192 2,244 566 5,581 154 647 50 Wyoming 8,721 332 445 7,568 79 297 51 Alaska 5,628 342 322 4,701 34 228 * Total includes renewable energy, energy efficiency, clean vehicles, battery storage, advanced biofuels, low-impact hydro and other sectors. 7 // E2 CLEAN JOBS AMERICA 2020
INDUSTRY BREAKDOWN:                                                     CLEAN ENERGY VS FOSSIL FUELS
Q4 2019 EMPLOYMENT

                                                                        3 to 1
                       ENERGY EFFICIENCY:                               Clean energy jobs (3.36 million) outnumbered total
                       n	ENERGY STAR and Efficient Lighting: 552,435
                                                                        fossil fuel employment (1.19 million) by more than
                       n	Traditional HVAC: 598,375
     2,378,893                                                          3 to 1 in 2019
                       n	High-Efficiency HVAC and Renewable
                          Heating & Cooling: 566,290
                       n	Advanced Materials: 366,608
                       n	Other: 295,185
                                                                        2.5 times more
                                                                        Renewable generation employed nearly 2.5X more
                                                                        workers than fossil fuel electric power generation
                       RENEWABLE ENERGY:
                       n	Solar: 345,393                                42
                       n Wind: 114,774
     522,811                                                            States and the District of Columbia employ more clean
                       n Geothermal: 8,794
                       n Bioenergy/CHP: 41,546
                                                                        energy workers than fossil fuel workers
                       n	Low-Impact Hydro: 12,304

                       GRID & STORAGE:                                  Five-Year Trend 2015–Q4 2019
                       n	Clean Storage: 76,699
                                                                        Employment Growth
                       n Smart Grid: 25,631
     147,644
                       n Micro-Grid: 22,192
                                                                        3.5M
                       n	Other Grid Modernization: 20,122

                       CLEAN VEHICLES:
                       n	Hybrid Electric Vehicles: 113,449
                       n	Plug-In Hybrid Vehicles: 51,619
     266,368
                       n	Electric Vehicles: 77,667
                       n	Natural Gas Vehicles: 12,878
                       n	Hydrogen & Fuel Cell: 10,755

                        FUELS:
                        n	Other Ethanol/Non-Woody Biomass: 20,694
                        n	Other Biofuels: 19,009
      39,704

                                                                        3M
                                                                               2015                                    2019

8 // E2 CLEAN JOBS AMERICA 2020
THE CASE FOR A CLEAN ENERGY-DRIVEN RECOVERY
POWERING AMERICA’S RECOVERY
As America looks to recover from the A Closer Look: 2019 What is a clean energy
COVID-19 pandemic in 2020 and beyond, Job Growth Breakdown worker?
no other part of the energy sector can
Employment increased across every sector Along with size and geographic diversity,
deliver the economic benefits—as quickly or
of the U.S. clean energy sector except clean the clean energy sector spans a wide
as significantly as clean energy.
vehicles, which saw record double-digit swath of the economy—meaning
Across the entire U.S. energy sector, clean growth in 2018. millions of Americans across an array of
energy jobs now represent about 40 percent occupations and with different skillsets
While the clean vehicle industry’s are being affected.
of the workforce. Clean energy accounted for
employment decrease was felt in most
more than half (55 percent) of the sector’s
states, at least two-thirds of all 50 states // Energy efficiency companies employ
net employment growth in 2019. Not only
and the District of Columbia saw growth in electricians, roofers, plumbers,
does clean energy employ about three
every other sector—including all 51 in energy welders, and technicians who work
times the number of workers as the entire
efficiency and 44 in renewable energy. in mechanical trades.
U.S. fossil fuel industry, the number of clean
energy jobs added last year was nearly five // Solar, wind and geothermal
times greater than fossil fuel jobs added. Small Businesses at Risk companies employ high-tech
2.2 million clean energy workers—nearly engineers as well as hard-hatted
Clean Energy: In the Overall two-thirds of the entire workforce—are construction workers.
Energy Economy employed by businesses with fewer than
19 employees. // Manufacturers in the clean energy
Energy Sector Employment Q4 2019 and clean vehicles space put
Small firms, more dependent on consistent people to work producing everything
Clean Energy Employment:
n business and access to finance, are some from Low-E energy efficient windows
3,355,419 (+70,819) of the most at-risk companies in the U.S. and LED lighting to the latest
economy due to the impact COVID-19 has energy-sipping dishwashers, clothes
Fossil Fuel Employment:
n
had on regular commerce. dryers and electric and hybrid
1,190,183 (+15,440)
vehicles.
Motor Vehicle Employment:
n
2,290,124 (+26,363) 1–4 employees: 32.9%
n // Salespeople, marketers, energy
5–19 employees: 31.5%
n auditors, field technicians,
Trad. Transmission & Distribution
n
inspectors, line workers, mechanics,
Employment: 1,114,575 (+12,946) 20–99 employees: 25.0%
n
and service tech are a part of nearly
Nuclear Energy Employment:
n 100–499 employees: 8.1%
n every sector of the clean economy.
70,323 (-1,823)
500+ employees: 2.5%
n
Other Employment: 337,629 (+4,775)
n
TOTAL SECTOR U.S. CLEAN
EMPLOYMENT: ENERGY FIRMS:
8,358,252
Total Sector 490,000
(+128,520)
Employment:
8,358,252
(+128,520)
9 // E2 CLEAN JOBS AMERICA 2020CLEAN JOBS: ACROSS THE SUPPLY CHAIN
While construction and manufacturing accounted for the most clean energy jobs in the U.S. economic
value chain in 2019, more than 1.1 million other clean energy workers are employed across agriculture,
trade, distribution and transportation, professional services and more. Those jobs alone employed as
many workers as the entire fossil fuel sector in 2019.
AGRICULTURE: UTILITIES:
26,843 JOBS 16,777 JOBS
OTHER:
248,301 JOBS
PROFESSIONAL TOTAL:
SERVICE: CONSTRUCTION:
536,867 JOBS 3,355,419 1,684,420 JOBS
WHOLESALE TRADE,
DISTRIBUTION, AND
TRANSPORT: MANUFACTURING:
295,277 JOBS 546,933 JOBS
CLEAN ENERGY: AT THE HEART OF AMERICA’S CONSTRUCTION NEEDS
1.7 million workers in the U.S. are employed in construction work across the clean energy sector—
installing new renewable energy systems, making buildings and schools more energy efficient,
repairing the electric grid, and more.
43%
ONE IN FIVE CONSTRUCTION WORKERS 43 PERCENT OF SOLAR AND WIND NEARLY SIX IN TEN ENERGY EFFICIENCY
ARE EMPLOYED IN CLEAN ENERGY ENERGY JOBS ARE IN CONSTRUCTION EMPLOYEES WORK IN CONSTRUCTION
10 // E2 CLEAN JOBS AMERICA 2020CLEAN ENERGY: 12%
IN THE US ECONOMY
Clean energy is uniquely capable of leading
Nationwide Clean Energy Employment
America’s recovery post-COVID-19. Not
(10.4% 2015–2019)
only has the sector proven capable of
delivering results during a time of economic
depression, it has the room needed to
quickly expand and absorb hundreds of
thousands of new job seekers, Americans
who need employment in order for the
economy to fully recover.
In 2019, clean energy employed a record
2.25 percent of U.S. workers nationwide,
including more than 3 percent of workers in
seven states. Clean energy’s share of U.S.
total employment was expected to increase
Total Nationwide Employment
even further in 2020. The industry has
(6.1% 2015–2019)
kept well ahead of total U.S. employment
growth over the last five years, adding jobs
0
70 percent faster than the overall economy 2015 2019
from 2015–2019.
Clean Energy Jobs: Share of Statewide Employment Q4 2019
Nationally, clean energy companies employed 2.25% of all workers in the U.S. in 2019.
DC
KEY
5%
11 // E2 CLEAN JOBS AMERICA 2020GETTING AMERICA BACK TO WORK: WITH POLICIES THAT WORK
Given the extent of the economic shutdown, getting America back to work—and in ways that create a
stronger, cleaner economy in the future—requires bold ideas, big initiatives and commonsense policies
at both the state and federal levels.
Clean Energy Infrastructure Jobs Are Key
Big infrastructure projects have always aging equipment to prevent costly disasters Additionally, commercial buildings account
helped America recover from economic like wildfires. Doing so could get many of for about 40 percent of all energy consumed
calamity—whether it was the Pacific Railroad the nearly 148,000 Americans who work in in the United States and over one-third of
Act that helped get America back to work grid and energy storage businesses back to the country’s carbon dioxide emissions.
after the Civil War or the highway and public work, and create tens of thousands of new
works programs that helped bring the jobs as well. A nationwide program to electrify our
United States out of the Great Depression. buildings could help put some of the nearly
Making sure clean energy infrastructure Building a national electric vehicle 2.4 million energy efficiency workers in
projects are a major part of any economic charging network also could help get the America back to work and create tens of
recovery policies is essential to restarting more than 160,000 American who work in thousands of new jobs too. One place to
our economy. electric and electric-hybrid vehicles back start: The nation’s 98,000 public schools,
to work, in addition to creating tens of most of which will remain closed for
Fixing our power grid is one place to thousands more construction jobs across students and staff for months because
start. Estimates show that America needs the country. of COVID-19. Tens of thousands of other
to invest $30 billion to $90 billion5 to government-owned buildings at the more
upgrade our transmission lines over the next Meanwhile, an estimated 70 million than 800 U.S military bases also are
decade in order to properly handle new American homes and businesses rely on badly in need of energy upgrades and
renewable energy generation and repair natural gas, oil or propane for heating, electrification.
cooking, and warming up bath water.
© Dennis Schroeder/NREL
12 // E2 CLEAN JOBS AMERICA 2020SPECIFIC CONGRESSIONAL ACTIONS THAT CAN GET AMERICA BACK TO
WORK REBUILDING A CLEAN ECONOMY
TREASURY DEPARTMENT
// Reinstate the Section 1603 program to deliver payments directly to clean energy developers and suppliers now, rather than make them
wait to claim these credits in tax filings. And expand the program to cover energy storage and energy efficiency projects.6
// Extend federal clean energy incentive deadlines to account for COVID-19 related delays and to secure the projects and jobs relying on
their funding funding—including “Safe Harbor” and “in construction” deadlines.
INTERNAL REVENUE DEPARTMENT
Extend, expand and reform clean energy incentives, through the following bills:
// H.R. 2096/S. 1142, “The Energy Storage Tax Incentive and Deployment Act of 2019”
// H.R. 3961/S. 2289, “The Renewable Energy Extension Act”
// H.R. 4887/S. 1988, “The Offshore Wind Power Act”, and S. 1957/H.R. 3473, “The Incentivizing Offshore Wind Power Act”
// H.R. 2256/S. 1094, “The Driving America Forward Act”
// Extend the Production Tax Credit (PTC) for wind as included in the House Ways and Means Committee’s GREEN Act proposal
// H.R. 4506/S. 2588, “Home Energy Savings Act”; H.R.4646/S. 2595, “New Home Energy Efficiency Act”.
DEPARTMENT OF ENERGY
Increase funding for:
// The Federal Loan Guarantee Program and the Advanced Research Projects Agency-Energy (ARPA-E), to immediately spur innovation and
new opportunities as the economy recovers.
// The Weatherization Assistance Program, which provides funding for cost-saving energy efficiency upgrades for low-income households.
The program has supported more than 8,000 jobs and provides weatherization services to 35,000 homes every year.
// Clean energy demonstration programs, including for large-scale energy storage, advanced renewable energy technologies, clean
transportation solutions, clean industrial projects, and clean hydrogen and other zero-carbon fuels.
// Advanced construction of net-zero-carbon building retrofits for low-income homes.
// Clean energy job training to help those isolated due to COVID now and to reduce unemployment and help displaced workers find new
careers in clean energy during recovery. This should include increasing funding for DOE clean energy job training as well as funding
community colleges and other certified institutions or organizations to create and grow clean energy training programs.
// Resurrect the Energy Efficiency and Conservation Block Grant program for states that can be used to immediately launch job-intensive
renewable energy projects and energy efficiency programs for K-12 schools and municipal buildings.
DEPARTMENT OF TRANSPORTATION
// Invest in clean cars and clean vehicle infrastructure through legislation such as the Clean Corridors Act of 2019 and the EV Freedom
Act to immediately create jobs, expand the nation’s electric vehicle charging and clean fuel networks
// Support a nationwide vehicle trade-in program to get cleaner, more efficient and cost-effective cars in production and to consumers.
13 // E2 CLEAN JOBS AMERICA 2020American cities across the country were hubs for growing clean
energy jobs and businesses in 2019 while rural districts and
small communities increasingly made their mark.
14 // E2 CLEAN JOBS AMERICA 2020
© iStockAMERICA’S CLEAN JOB ENGINES IN 2019
35 states and the District of Columbia were home to a Top 50 metropolitan statistical areas (MSAs)
for clean energy jobs in 2019, and 15 states had at least two or more metros represented.
In total, the Top 50 metro areas accounted for 1.9 million of the nation’s nearly 3.4 million clean jobs
at the start of 2020.
Clean Jobs Cities: Top 50 Metros By Total Clean Energy Employment Q4 2019
14
19
16 5
43
33
11 1 45
48 28 13
4 37
49
22 36 38 17
3 26 6
21 44 20 34
32
23 40
46 35
30
42 41
27
2 18 25
10 15 12
47
9
50
KEY 24
39
Top 50 Metros – Total clean jobs 31 7
29
8
Clean Clean Clean
Rank Metro Energy Jobs* Rank Metro Energy Jobs* Rank Metro Energy Jobs*
1 New York City, NY-NJ-PA 152,267 18 Riverside-San Bernardino, CA 38,440 35 Virginia Beach, VA-NC 18,412
2 Los Angeles, CA 146,394 19 Portland, OR-WA 35,683 36 Salt Lake City, UT 18,135
3 San Francisco-Oakland, CA 122,813 20 Denver, CO 34,823 37 Pittsburgh, PA 18,116
4 Chicago, IL-IN-WI 102,850 21 San Jose, CA 32,643 38 Columbus, OH 16,890
5 Boston, MA-NH 95,966 22 Sacramento, CA 32,208 39 Orlando, FL 16,870
6 Washington, DC-VA-MD-WV 88,991 23 St. Louis, MO-IL 27,057 40 Richmond, VA 16,424
7 Houston, TX 64,924 24 Austin, TX 26,297 41 Raleigh-Cary, NC 16,126
8 Miami, FL 60,963 25 Charlotte, NC-SC 25,001 42 Memphis, TN-AR-MS 14,921
9 Dallas-Fort Worth, TX 58,554 26 Indianapolis, IN 24,822 43 Hartford, CT 14,869
10 San Diego, CA 58,094 27 Nashville, TN 24,168 44 Provo, UT 14,842
11 Detroit, MI 55,466 28 Cleveland, OH 22,399 45 Bridgeport, CT 14,323
12 Atlanta, GA 55,085 29 Tampa-St. Petersburg, FL 22,071 46 Louisville, KY-IN 14,186
13 Philadelphia, PA-NJ-DE-MD 49,510 30 Las Vegas, NV 22,042 47 Birmingham, AL 13,298
14 Seattle, WA 48,345 31 San Antonio, TX 21,307 48 Toledo, OH 12,823
15 Phoenix, AZ 47,462 32 Kansas City, MO-KS 20,835 49 Santa Rosa, CA 11,301
16 Minneapolis-St. Paul, MN-WI 42,021 33 Milwaukee, WI 20,505 50 Jacksonville, FL 11,116
17 Baltimore, MD 38,860 34 Cincinnati, OH-KY-IN 20,389
* Total includes renewable energy, energy efficiency, clean vehicles, battery storage, advanced biofuels, low-impact hydro and other sectors.
15 // E2 CLEAN JOBS AMERICA 2020BEYOND THE BIG CITIES
While the largest metros are home to most clean energy jobs, many smaller and mid-sized metro areas
are seeing clean energy businesses make an even greater impact per capita. Among the metro areas
with the largest share of clean energy jobs in their total workforce, 22 of the top 25 have populations
under 500,000.
Clean Jobs Cities: Metros with Largest City & Country: Top states for rural clean
Share of Clean Energy Workers as Share energy jobs; top metros by share of total
of Total Workforce7 Q4 2019 workforce
Clean Share of Total
Rank Metro Energy Jobs Employment 19
1 San Luis Obispo-Paso Robles, CA 11,050 8.8%
2 Holland-Grand Haven, MI 3,538 8.6%
3 Cleveland, TN 3,071 6.4% 8
20
4 Provo, UT 14,842 5.4% 24 6
2
5 Santa Rosa, CA 11,301 5.2% 21 14
10
16
6 Barnstable Town, MA 4,953 4.9% 5 13 11
12
4
7
7 San Francisco-Oakland, CA 122,813 4.9% 18
1 23
8 Burlington, VT 5,609 4.3% 9
9 Elizabethtown, KY 2,541 4.3% 25
3 15
10 Niles-Benton Harbor, MI 2,685 4.2% 17
22
11 Fort Wayne, IN 8,625 4.0%
12 Toledo, OH 12,823 4.0%
13 Reno-Sparks, NV 9,807 4.0%
14 Casper, WY 1,571 3.9%
15 Wilmington, NC 5,121 3.9%
16 Chico, CA 3,325 3.8%
KEY
17 Santa Barbara, CA 8,094 3.8%
18 Boulder, CO 7,372 3.8% Top States – Rural clean jobs
19 Bellingham, WA 3,638 3.8% Top 25 Metros – Clean jobs per capita
20 Medford, OR 3,387 3.7%
21 Redding, CA 2,532 3.6%
22 San Diego, CA 58,094 3.6%
23 Charlottesville, VA 4,307 3.6%
24 Oshkosh-Neenah, WI 3,403 3.5% Clean Jobs Rural America: Top 10 States
25 Asheville, NC 7,177 3.5% for Rural Clean Energy Jobs* Q4 2019
Rank State Rural Clean Energy Jobs
1 North Carolina 28,894
America’s rural communities are also reaping the rewards, 2 Michigan 24,954
accounting for more than 430,000 jobs in 2019 led by 3 Texas 23,904
Midwestern and Southern states. 4 Wisconsin 19,513
5 Ohio 17,513
6 Indiana 16,009
7 Tennessee 14,725
8 Iowa 14,244
9 Minnesota 13,845
10 Illinois 13,502
*Rural clean energy jobs are calculated based on the Bureau of Labor
Statistics’ (BLS) nonmetropolitan area for every state, which is any
area not designated as a metropolitan area by BLS.8
16 // E2 CLEAN JOBS AMERICA 2020Methodology
The analysis expands on data from the 2020 U.S. Energy and Employment Report (USEER) produced by the Energy Futures Initiative (EFI) in
partnership with the National Association of State Energy Officials (NASEO), using data collected and analyzed by the BW Research Partnership.
The USEER analyzes data from the U.S. Bureau of Labor Statistics (BLS) Quarterly Census of Employment and Wages (QCEW) to track employment
across many energy production, transmission, and distribution subsectors. In addition, the 2020 USEER relies on a unique supplemental survey of
30,000 business representatives across the United States. Created and conducted by BW Research and approved by the Office of Management
and Budget and U.S. Department of Energy (DOE), this survey is used to identify energy-related employment within key subsectors of the broader
industries as classified by the BLS and to assign them into their component energy and energy efficiency sectors.
E2 is a partner on the USEER, which was first released by the Department of Energy in 2016. The 2020 USEER was released on March 23, 2020
and is available at www.usenergyjobs.org.
An FAQ is also available here to answer any questions.
About E2
E2 (Environmental Entrepreneurs) is a national, nonpartisan group of business leaders, investors, and professionals from
every sector of the economy who advocate for smart policies that are good for the economy and good for the environment. E2
members have founded or funded more than 2,500 companies, created more than 600,000 jobs, and manage more than $100
billion in venture and private equity capital.
E2 releases more than a dozen clean energy employment reports annually—including Clean Jobs America—with state-specific
reports covering more than 20 states every year. Clean energy jobs have grown every year since the first national report was
released in 2016.
For additional insight into E2’s Clean Jobs America 2020 or our other annual Clean Jobs America reports, visit e2.org/reports.
THANKS TO SUPPORT FROM:
E2 wishes to express its appreciation to the National Association of State Energy Officials (NASEO), the Energy Futures Initiative (EFI) and
BW Research Partnership (“BWRP”) who made this report possible by producing the USEER and its underlying data.
ENDNOTES
1 Unless otherwise stated, all data is from the 2020 U.S. Energy and Employment Report (USEER), March 2020, NASEO and EFI. All employment findings in USEER is based on survey and data analysis
collected from Q4 2019 prior to any onset of the COVID-19 crisis. See Pages 201-206 for methodology questions, available at www.usenergyjobs.org.
2 https://www.bls.gov/oes/tables.htm.
3 BW Research Partnership: Clean Energy Employment Initial Impacts from the COVID-19 Economic Crisis from, March 2020, available at www.e2.org/reports/clean-jobs-covid-economic-crisis-march-2020.
4 https://obamawhitehouse.archives.gov/the-press-office/2016/02/25/fact-sheet-recovery-act-made-largest-single-investment-clean-energy.
5 https://wiresgroup.com/wp-content/uploads/2019/03/Electrification_BrattleReport_WIRES_FINAL_03062019.pdf.
6 https://home.treasury.gov/policy-issues/financial-markets-financial-institutions-and-fiscal-service/1603-program-payments-for.
7 Economic Modeling Specialists, Intl. (EMSI) 2019.
8 https://www.ers.usda.gov/topics/rural-economy-population/rural-classifications/what-is-rural.
WWW.E2.ORG
@E2ORG
#CLEANJOBSAMERICA
Good for the Economy.
APRIL 2020
E2FS: 20-03-A
Good for the Environment.You can also read