Regional Sales of Multinationals in the World Cosmetics Industry
←
→
Page content transcription
If your browser does not render page correctly, please read the page content below
European Management Journal Vol. 24, Nos. 2–3, pp. 163–173, 2006
                                                                                                    Ó 2006 Elsevier Ltd. All rights reserved.
                                                                                                                              0263-2373 $32.00
                                               doi:10.1016/j.emj.2006.03.006

Regional Sales
of Multinationals
in the World Cosmetics
Industry
CHANG HOON OH, Indiana University
ALAN M. RUGMAN, Indiana University

This paper analyzes the regional characteristics and                 will be considered. Second, the presence and perfor-
strategies of multinational enterprises (MNEs) in                    mance of world cosmetics firms is examined in a
the world cosmetics and toiletries industry, based                   regional context for the first time.
on the new work by Rugman on regional strategy.
We test the proposition that MNEs may asymmetri-                     Rugman (2000, 2005) and Rugman and Verbeke
cally develop their upstream and downstream firm                     (2004) show that the largest multinational enter-
specific advantages (FSAs). We find that the down-                   prises (MNEs) utilize not a global strategy but a
stream activities of the MNEs in cosmetics are                       home region-based strategy as they go into foreign
home region based but that upstream activities                       markets. Several related studies have examined the
are more so. Further, the asymmetry of FSAs in                       regional characteristics of MNEs at the industry
the world cosmetics industry is mainly due to the                    level: the automotive sector (Rugman and Collinson,
atypical Asian entry strategies of North American                    2004); the retail sector (Rugman and Girod, 2003).
and West European cosmetics MNEs. Two case                           There are also several studies at region/country
studies confirm how variations in FSAs can affect                    level: Europe (Rugman and Collinson, 2005); Japan
regional strategy.                                                   (Rugman and Collinson, 2006). Some earlier work
Ó 2006 Elsevier Ltd. All rights reserved.                            also implicitly discusses regional strategy. In partic-
                                                                     ular, Johansson and Vahlne (1977) show that firms
Keywords: Regionalism, Regional strategy, Cos-                       select geographically and culturally similar markets
metics industry, Firm specific advantage, Avon,                      to overcome the liability of foreignness. Davidson
Gucci                                                                (1983) suggests that similarities in supply, demand,
                                                                     and uncertainty encourage foreign entry. Ohmae
                                                                     (1985) notes that MNEs can take advantage of cus-
                                                                     tomer similarities among nations, and he was the
                                                                     first to define broad regions in the triad space: North
Introduction                                                         America; Western Europe; and Japan.

In a previous article in this journal, Rugman and                    Schlie and Yip (2005) suggest that regionalization
Collinson (2004) examined the international activity                 and regional strategy could evolve as a better solu-
of the world’s largest automobile companies. They                    tion than their global counterparts because MNEs
reported that these so-called global firms in fact are               confront two pressures: total globalization barriers
all operating on a regional basis, with an average of                and competitive regionalization advantages. After
80 percent of their sales within their home region.                  analyzing the world automotive industry, they fur-
In this paper this regional lens is applied to the world             ther argue that regional strategies could be associ-
cosmetics industry. Two advances are introduced.                     ated with a more rather than less advanced stage in
First, as well as the sales of these firms, their assets             the evolution of firm’s global strategy. We do not

European Management Journal Vol. 24, Nos. 2–3, pp. 163–173, April–June 2006                                                              163
REGIONAL SALES OF MULTINATIONALS IN THE WORLD COSMETICS INDUSTRY
believe this; there are many large MNEs (LMNEs) The World Cosmetics Industry
reporting a regional strategy but they clearly do not
ever have a global strategy. However, to better test In this paper, we focus on the regional sales and local-
this it is necessary to move on from looking at sales ized operation (assets) of the world’s largest 100 cos-
data and also consider assets, as we do here. Rugman metics companies for 2003. The list of the world’s
(2005) in fact already examined the downstream largest 100 cosmetics companies and its cosmetics
activity (sales) of LMNEs. Here we extend this work sales come from the Woman’s Wear Daily (WWD)
with a comparative analysis of the upstream (assets) magazine, and the list is reported in Appendix A. 1
and downstream (sales) firm specific advantages France based L’Oréal had sales of 15.5 billion US dol-
(FSAs) of subsidiary business units. Moreover, this lars worldwide in 2003, and Procter and Gamble, Uni-
study analyzes not only LMNEs but also smaller lever, Shiseido, and Estée Lauder were next, while
MNEs in the cosmetics and toiletries (henceforth cos- Perricone MD is the smallest firm with sales of 52 mil-
metics) industry and compares their international lion US dollars worldwide in 2003. The world cosmet-
strategies. We find that the development of upstream ics market is oligopolized by a few large companies;
activities in small cosmetics MNEs lags behind the the largest company, L’Oréal, is about 300 times big-
growth of downstream activities, compared to larger ger than the 100th largest company, Perricone MD.
cosmetics MNEs. This asymmetry comes from North
American and West European MNEs’ entry strategy Table 1 reports the number and average sales of
in the Asian market. By comparing upstream and firms by nationality and by home region. The cos-
downstream FSAs in the regional context, we also metics industry is regionally based, and firms based
study and compare the strategies of Avon and Gucci. in North America and in West Europe account for
approximately 86% of sales: 43% for each region.
We proceed as follows. In the next section, we de- Firms based in Japan and South Korea also have sub-
scribe the data and review background information stantial market share at 14%. 2 West European cos-
about the world cosmetics industry. After examining metics companies have the largest portion, 50%, in
the regional characteristics of the cosmetics industry terms of number, but their average sales are the
and the asymmetry between upstream FSAs and smallest, 960 million US dollars. Firms in the largest
downstream FSAs, we review two cases of interna- five countries (USA, UK, France, Germany and
tionalization strategy. We conclude with a discussion Japan) make up 93% of sales. Except for eight Brazil-
of the contribution and managerial implication of ian, Russian, and South Korean companies all firms
this study. have their headquarters in developed countries.
Table 1 The World’s Largest 100 Cosmetics Companies
Region Home Country Number of Firms Total Global Sales Average Global Sales
America United States 35 46,753 (42.56%) 1,336
Canada 1 59 (0.05%) 59
Brazil 1 147 (0.13%) 147
Sub Total 37 46,959 (42.75%) 1,269
Europe France 16 25,082 (22.83%) 1,567
Italy 10 1,843 (1.51%) 166
Germany 9 6,599 (6.01%) 733
United Kingdom 4 10,835 (9.86%) 2,709
Switzerland 3 352 (0.32%) 117
Spain 2 1,440 (1.31%) 720
Russia 2 181 (0.16%) 91
Netherlands 1 696 (0.63%) 696
Ireland 1 206 (0.19%) 206
Sweden 1 738 (0.67%) 738
Sub Total 50 47,977 (43.67%) 960
Asia Japan 8 13,051 (11.88%) 1,631
South Korea 5 1,870 (1.70%) 374
Sub Total 13 14,921 (13.58%) 1,148
Total 100 109,857 (100.00%) 1,098
Source: Woman’s Wear Daily 2003, Millions of US $. Unilever is counted as a UK firm.
164 European Management Journal Vol. 24, Nos. 2–3, pp. 163–173, April–June 2006REGIONAL SALES OF MULTINATIONALS IN THE WORLD COSMETICS INDUSTRY
Table 2 Large and Small Cosmetics Firms because of the free-riding problem (Anderson and
Gatignon, 1986). Burt et al. (2005) explain that the
Definition Number of firms Data for beauty industry has two characteristics: high regula-
Geographic
tion and high consumer’s trust, which is built around
Dispersion
well established world wide manufacturing brands.
Sales Assets Davidson (1983) finds that scale economies can be
achieved in supplying similar markets because exist-
LMNE Sales are at 33 25 21 ing resources such as brand names, packaging, prod-
least 1 billion uct design, and pricing strategies can be readily
SMNE Sales are less 67 18 11 transferred to similar markets. Managers will also
than 1 billion prefer similar markets in order to minimize unex-
Total 100 43 32
pected response to an established marketing mix.
Sources: Geographic dispersion data for sales and assets Brand equity can be achieved by a marketing mix
come from annual reports, World Scope, and COMPUSTAT. such as place and promotion after penetrating the
Data of four companies, P&G, KAO, Pierre Fabre, Noevir, are market. In general the cosmetics industry would be
unavailable for 2003, so 2004 data are used in these cases. a home-region oriented industry to maximize FSAs
(scale economies) and LSAs (market similarities).
Based on Euromonitor’s (2003) estimation of world Seventy percent of sales occur in the home region,
market size, the largest 100 companies make up and SMNEs rely more on home-region sales than
60% of the world market. LMNEs. The value is very close with the intra-regio-
nal sales of the largest 500 companies, 71.9%. Using
We divide the largest 100 cosmetics companies into Rugman’s classification (2004, 2005) of regional mul-
LMNEs and small MNEs (SMNEs) based on their tinationals based on intra- and inter-regional sales,
sales in 2003. Sales of LMNEs are at least $1 billion we classified cosmetics MNEs; see Table 3. 4 Approx-
in 2003, while those of SMNE are less than $1 billion. imately 80% of MNEs are categorized as home-
In this way 34 companies are categorized as LMNEs region oriented in the sense of geographic dispersion
among cosmetics companies, while 66 companies are of sales. Only 16% of MNEs actively participate in at
categorized as SMNEs. Among the 34 LMNEs, 27 least one foreign triad market. The evidence is more
firms (such as L’Oréal, Shiseido, Estée Lauder, Avon) obvious when we use the geographic dispersion of
sold more than $1 billion of cosmetics products assets data. All 32 cosmetics MNEs invest more than
around the world, while seven companies (such as 50% of assets in their home region except Unilever,
Gucci, Gillette, Liz Claiborne) sold more than $1 and the average of their intra-region assets is 84%.
billion by including other product categories. 3 Using In particular SMNEs invest an average of 92.6% as-
the list from WWD, we collect geographic sales sets in the home region, and all of them are catego-
data from the annual reports, World Scope, and rized as home-region oriented MNEs in the sense
COMPUSTAT. The geographic dispersion of sales of geographic dispersion of assets.
data is available for 43 MNEs while the geographic
dispersion of assets is available for 32 MNEs. Eleven Rugman (2005) develops the regional matrix based
MNEs only report their sales data in annual reports. on the basic matrix of CSA and FSA. On the horizon-
Data availability is higher for LMNE than for SMNE; tal axis of the regional matrix is shown the regional
see Table 2. or global reach of FSAs of a firm, and on the vertical
axis of the regional is shown the regional or global
scope of the locational advantages of a firm. In Figure
1, we arrange the results of 43 cosmetics MNEs on
The Regional Nature of Multinational
the regional matrix. Among the world’s largest cos-
Enterprises in Cosmetics metics MNEs, four (LVMH, Gucci, L’Oréal and
Richemont SA) stand out as being the most global
Current studies show that world economic activities (quadrant 3) in terms of generating their revenue
are realized in the home regions of North America, across the three triads of North America, Europe,
Europe, and Japan/Asia (Rugman, 2000 and 2005; and Asia-Pacific. All are well known high-end cos-
Rugman and Verbeke, 2004). Among Rugman’s 380 metics companies located in Europe, and L’Oréal is
MNEs, six MNEs are included in the world’s largest solely a cosmetics company. 5 High brand recogni-
100 cosmetics companies. These MNEs are catego- tion and world standard products make them use
rized as one global MNE (LVMH), two bi-regional global strategy. Three firms (Unilever, Bulgari, and
MNEs (L’Oréal, Unilever), and three home-region ori- Inter Parfums) are positioned in bi-regional of quad-
ented MNEs (Henkel, Sara Lee, Procter and Gamble). rant 4. Even though total sales of Bulgari and Inter
Parfums are less than $1 billion (855 million and
Does the cosmetics industry use a global strategy? 186 million respectively) they have a significant pres-
Previous work finds that brand is important (Steenk- ence in two triads. All three firms are also Europe
amp, Batra and Alden, 2003), and that maintaining based firms. The main brand of Bulgari and Inter
the brand name needs a higher degree of control Parfums are BVLGARI and Burberry; they also have
European Management Journal Vol. 24, Nos. 2–3, pp. 163–173, April–June 2006 165REGIONAL SALES OF MULTINATIONALS IN THE WORLD COSMETICS INDUSTRY
Table 3 The Largest 100 Cosmetics Companies and their Intra-regional Sales
Panel 1. Entire World Largest 100 Cosmetics companies
Type of MNE Sales Operation (Asset)
No. of MNEs % of 43 Intra-region Sales No. of MNEs % of 32 Intra-region Assets
Global 4 9.3% 44.3% 1a 3.1% 53.0%
Bi-Regional 3 7.0% 48.4% 2a 6.3% 50.8%
Host-Region Oriented 2 4.7% 24.5% 0 0.0% –
Home-Region Oriented 34 79.0% 78.0% 29 90.6% 84.0%
Sub-Total 43 100.0% 70.3% 32 100.0% 80.8%
Insufficient Data 6 na na 17 na na
No Data 51 na na 51 na na
Total 100 100
Panel 2. Large Multinational Enterprises (sales greater than 1 billion US $)
Type of MNE Sales Operation (Asset)
No. of MNEs % of 25 Intra-region Sales No. of MNEs % of 21 Intra-region Assets
Global 4a 16.0% 44.3% 1a 4.8% 53.0%
Bi-Regional 1 4.0% 50.3% 2a 9.5% 50.7%
Host-Region Oriented 1 4.0% 33.0% 0 0.0% –
Home-Region Oriented 19 76.0% 73.4% 18 85.7% 78.5%
Sub-Total 25 100.0% 66.2% 21 100.0% 74.6%
Insufficient Data 3 na na 7 na na
No Data 5 na na 5 na na
Total 33 33
Panel 3. Small Multinational Enterprises (sales less than 1 billion US $)
Type of MNE Sales Operation (Asset)
No. of MNEs % of 18 Intra-region Sales No. of MNEs % of 11 Intra-region Assets
Global 0 0.0% – 0 0.0% –
Bi-Regional 2 11.1% 47.5% 0 0.0% –
Host-Region Oriented 1 5.6% 16.0% 0 0.0% –
Home-Region Oriented 15 83.3% 84.0% 11 100.0% 92.6%
Sub-Total 18 100.0% 76.1% 11 100.0% 92.6%
Insufficient Data 3 na na 10 na na
No Data 46 na na 46 na na
Total 67 67
Source: See sources in Table 2.
a
Indicates that a quasi global and a quasi bi-regional MNE are included for each corresponding category. Quasi global MNE means
that two host regions have more than 20 per cent of sales (assets) for each foreign region, but home region sales (assets) is slightly
more than 50 per cent. L’Oréal’s geographic dispersion of sales consists of 52%, 28% and 20% for Europe, America and Asia
respectively, and it is categorized as quasi global MNE in the sense of sales. Quasi bi-regional MNE means that only a host region
has more than 20 per cent of sales (assets), but home region sales (assets) is slightly more than 50 per cent. Avon’s geographic
dispersion of assets consists of 32%, 51% and 17% for Europe, America and Asia respectively, and it is categorized as quasi bi-
regional MNE in the sense of assets.
strong brand equity. All Asian and North American global FSAs (Rugman, 2005). Avon Company is
firms are categorized in home-oriented and host- located solely in quadrant 1.
oriented MNEs (quadrant 2).
It is important to note the existence of quadrant 1; the
The Downstream and Upstream Paths
firms in this quadrant cannot develop the comple-
mentary FSAs with a global reach that are required of Geographic Dispersion
to exploit the global scope of their locational advan-
tages. While the environment of international busi- Rugman and Verbeke (2004) suggest that an asym-
ness is becoming more global, it is very difficult for metry may exist between the MNE’s downstream
firms to transfer their successful regional FSAs into and upstream FSAs. The average sales of Rugman’s
166 European Management Journal Vol. 24, Nos. 2–3, pp. 163–173, April–June 2006REGIONAL SALES OF MULTINATIONALS IN THE WORLD COSMETICS INDUSTRY
Geographic Reach of
FSAs
Geographic Scope of Regional Global
Locational FSAs 1 3
“Myth of Globalization” Global (4/43)
Avon (L) LVMH (L)
Global Gucci (L)
L’Oréal* (L)
Richemont SA (L)
2 4
Home-Oriented (34/43) Bi-Regional (3/43)
Estée Lauder (L), Shiseido (L) Unilever (L)
Regional Elizabeth Arden (S), etc Bulgari (S)
Inter Parfums (S)
Host-Oriented (2/43)
Coty (L)
Nu-Skin (S)
Sources: see sources in Table 2.
Notes: * indicates Quasi-Global MNE; see note in Table 3.
Avon is categorized as a home-oriented MNE, but it has 48% of assets (geographic scope of
locational FSA) in foreign region and 36% of sales (geographic reach of FSAs) in foreign region. Avon can
be categorized as a quasi bi-regional in asset and a home-oriented in sales.
Figure 1 The Regional Matrix and Cosmetics MNEs
380 companies was $29.2 billion in 2001, and the this direct interface but are critical to creating an effi-
average sales of our sample is $5.8 billion in 2003. 6 cient internal production system. He further suggests
When we count only cosmetics sales of companies, and presents a re-conceptualization of Bartlett and
the average sales is $2.0 billion. The size of these cos- Ghoshal’s (1998) framework on ‘‘generic roles of na-
metics companies is much smaller than that of the tional organizations’’ in the MNE. We apply our data
largest 500 companies. to this framework and present it in Figure 2.
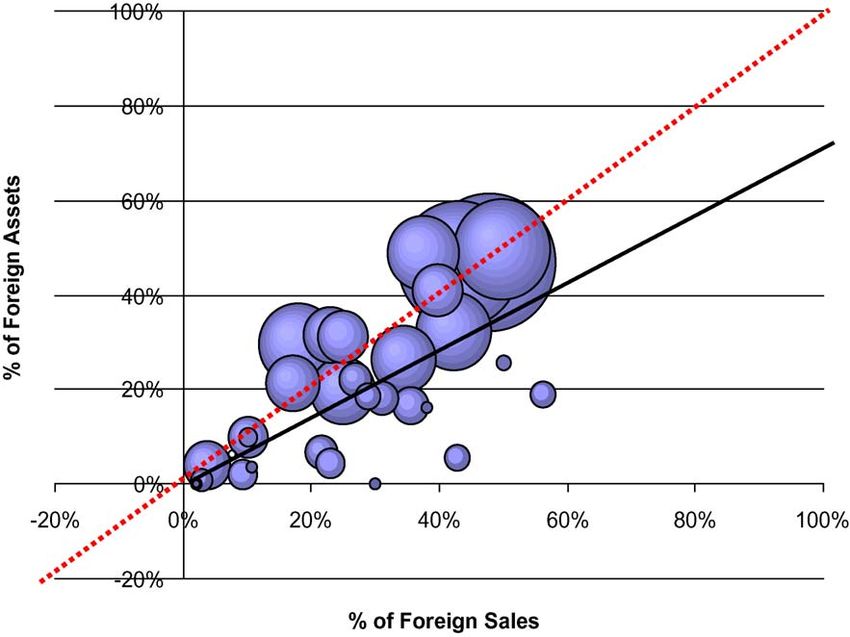
Anderson and Gatignon (1986) suggest that starting The cosmetics MNEs’ strength of geographic scope
from low-control modes, a firm is advised to exert upstream FSAs lags behind their downstream FSAs
more control for valuable brand names. Johansson except for Avon. In Figure 3 below, the dotted line is
and Vahlne (1977) point out that firms typically start the old perspective of symmetric upstream and down-
exporting to a country via an agent, later establish a stream FSAs, and the solid line is the trend line of
sales subsidiary, and eventually, in some cases, begin cosmetics MNEs. These findings contradict the hypo-
production in the host country. Therefore SMNEs uti- thetical expansion path of the largest 500 companies in
lize FSAs available to achieve a broad geographic dis- Rugman and Verbeke (2004), but they note that the
tribution of sales and then focus on FSAs to achieve exploitations of upstream and downstream FSAs are
sourcing and production for economies of scales. different with regard to firm specific and industry spe-
From the organizational capability perspective, MNEs cific characteristics. The size of the MNEs in our sam-
change to high investment mode after reducing risk ple is much smaller than that of the largest 500
through attaining market information and achieving companies, and as noted earlier the cosmetics indus-
high brand recognition in the host market. However, try has unique characteristics. When we consider the
it does not mean that the largest 500 MNEs show the size of the MNEs in the sample, we may expect that
same pattern as cosmetics MNEs. The largest 500 the development of upstream FSAs is faster than that
MNEs enjoy a high capability in exploiting upstream of downstream FSAs for the largest 500 companies.
activities compared to downstream activities. The
largest MNEs that have extensive international experi- North American and European cosmetics MNEs’
ence can exploit their FSAs of production and sourc- sales in their home region are approximately 60%,
ing in the host market more efficiently than SMNEs. and their sales in the two foreign triads are around
20% each on average. Asian cosmetics MNEs are
Rugman (2005) defines downstream and upstream more home region oriented; their sales are more than
FSAs. Downstream FSAs, or customer end FSAs, refer 90% in the home region and are less than 5% each
to knowledge strengths deployed in activities with a of the two foreign triads (see Panel A in Table 4).
direct interface with the customers; they are required However, we cannot find any preference of down-
to achieve successful market penetration. In contrast, stream activities between the two foreign triads.
upstream FSAs are deployed in activities that lack Each market is equally important in developing
European Management Journal Vol. 24, Nos. 2–3, pp. 163–173, April–June 2006 167REGIONAL SALES OF MULTINATIONALS IN THE WORLD COSMETICS INDUSTRY
Geographic Scope of SBU FSAs
1 country 1 triad region 2 triad regions All triad regions
21/38 (55%) 13/38 (34%) 4/38 (11%)
Shiseido, Unilever, Gucci
NA Elizabeth Arden, Estée Lauder, L’Oréal
Down-stream
Kao, Avon Avon, Etc.
FSAs
Etc. Inter Parfums,
Etc.
FSAs
Type 20/30 (67%) 9/30 (30%) 1/30 (3%)
Gucci, Unilever, L’Oréal
NA Shiseido, Estée Lauder,
Upstream
Elizabeth Arden, Avon,
FSAs
Kao Inter Parfums
Etc. Etc.
Sources: see sources in Table 2.
Note. Number of geographic scope is counted when sales in the region are larger than 20 % of total sales.
Figure 2 Generic Roles of Strategic Business Units (SBUs) in Cosmetics MNEs
Figure 3 Asymmetric Path of Geographic Distribution
downstream FSAs. However, we observe the asym- North American and European MNEs’(FDI) foreign
metric preference of developing upstream FSAs in direct investment in the Asian region is market seek-
foreign regions. Panel B in Table 4 shows that Euro- ing FDI, whereas their FDI in the other regions of the
pean cosmetics MNEs invest 20% of assets in the triad is well balanced among the market seeking, re-
North American market, and North American cos- source seeking, and strategic asset seeking motives
metics MNEs invest 30% of assets in the European for FDI, in terms of Dunning (1993). Even though
market. Both North American and European cosmet- cosmetics MNEs from the West have a substantial
ics MNEs invest less than 10% of their assets in the portion of sales in the Asian market, they do not ac-
Asian market. Asian cosmetics MNEs invest more tively exploit upstream FSAs in the market. The
than 5% in each foreign triad, which is slightly higher world’s leading MNEs have increased their produc-
than their sales in each region. tion capabilities in fast-growing parts of developing
168 European Management Journal Vol. 24, Nos. 2–3, pp. 163–173, April–June 2006REGIONAL SALES OF MULTINATIONALS IN THE WORLD COSMETICS INDUSTRY
Table 4 Geographic Dispersion of Sales and Table 5 Regional Activities of Avon
Assets by Home Region
Avon Sales Operating Total Capital
Home Region Triad Region (2003) Profits Assets Expenditures
Americas Asia Europe Americas 0.6264 0.6390 0.5123 0.5956
Europe 0.2373 0.2407 0.3185 0.3131
Panel A. Geographic Dispersion of Sales Asia 0.1363 0.1203 0.1692 0.0913
Americas 58.80% 17.63% 23.57%
Asia 3.46% 92.42% 4.12% Category Home- Home- Quasi Quasi
Europe 21.32% 17.19% 61.49% Region Region bi-regional bi-regional
Total 30.18% 30.77% 39.05% Source: Annual report 2003.
Panel B. Geographic Dispersion of Assets
Americas 70.37% 8.86% 20.77%
Asia 6.25% 87.05% 6.70% of assets (geographic scope of locational FSA) and
Europe 29.64% 5.12% 65.24% 36% of sales (geographic reach of FSAs) in foreign re-
Total 35.43% 23.35% 41.12% gions. Avon can be categorized as quasi bi-regional
in assets and home oriented in sales. Figure 2 shows
Source: See sources in Table 2.
that Avon’s geographic dispersion of upstream FSAs
is spread over two triad regions, while its geographic
dispersion of downstream FSAs is developed in only
countries (Nolan and Zhang 2003), but the leading one triad.
cosmetics MNEs have not yet participated in this
trend. The evidence of this section makes us con- Even though Avon made more than 60% of sales and
clude that an asymmetry between upstream and profits in its home region (North America), it actively
downstream FSAs in the world cosmetics industry exploits upstream FSAs in two foreign regions. After
exists for the Asian strategy of North American and starting its business in New York in 1886, Avon
European cosmetics MNEs. North American and aggressively expanded its geographic sales channels;
European cosmetics MNEs need to develop up- see Table 5. Avon established its first cross-border
stream FSAs in the Asian market. presence in Canada in 1914, and expanded its busi-
ness into Puerto Rico and Venezuela in 1954 and
Mexico in 1958, etc. The first business in a foreign
triad was in the United Kingdom and Germany in
Two Cases: Avon and Gucci 1959, and it also expanded its business in Europe:
Italy, Spain, and France in 1966. The Asian-Pacific re-
As explained in the earlier section, cosmetics MNEs gion was its last destination among three triads; it en-
develop more downstream FSAs than upstream tered the Australian and Japanese markets in 1963
FSAs in the foreign region. Schlie and Yip (2005) and in 1969 respectively. Currently, Avon does busi-
argue that the globalization (internationalization) ness in more than 120 countries and has continued its
process inevitably leads to different patterns of geographic expansion. Avon has entered 34 new
development in various countries or regions of the markets since 1990.
world, or varying degrees of globalization, which
in turn give rise to distinct regionalization trends. Anderson and Gatignon (1986) find that a higher
By carefully looking at Figure 2 we find two special degree of control is more efficient for technically
cases of internationalization strategy in the world’s sophisticated products and process, which tend to
largest cosmetics MNEs. Avon used a different inter- have higher proprietary content than unsophisti-
nationalization strategy from the general cosmetics cated products. Direct sales methods require high
MNEs. Gucci shows higher asymmetry than other tacit knowledge and local responsiveness, and the
large cosmetics MNEs. Avon and Gucci are well- local responsiveness is harder to exploit than sourc-
known MNEs over the world. Business Week (http: ing or production advantages. As a direct sales com-
//bwnt.businessweek.com/brand/2003/index.asp) pany, Avon needs to exploit downstream FSAs and
ranked brand values for Gucci and Avon as 53rd and local responsiveness, but it could not attain a com-
57th respectively for 2003. 7 In this section we explain parative advantage in downstream FSAs. Thus Avon
why two similar MNEs develop different interna- exploits upstream FSAs as a supplement to its lack of
tionalization strategies. downstream FSAs in host regions.
Avon: The Myth of Globalization Gucci: from Global to Regional
Avon, the world’s largest direct sales cosmetics com- Gucci was founded in Italy in 1921. Gucci opened its
pany, is positioned in quadrant 1 in Figure 1. Avon is first international store in New York in 1953, and in
categorized as a home-oriented MNE, but it has 48% 1961 opened its London store, the first European
European Management Journal Vol. 24, Nos. 2–3, pp. 163–173, April–June 2006 169REGIONAL SALES OF MULTINATIONALS IN THE WORLD COSMETICS INDUSTRY
Table 6 Regional Sales and Assets of Gucci
Year Sales Assets
Americas Asia Europe Americas Asia Europe
1996 0.33 0.45 0.22 0.17 0.15 0.68
1997 0.30 0.45 0.25 0.18 0.14 0.68
1998 0.29 0.41 0.30 0.16 0.17 0.67
1999 0.29 0.40 0.31 0.07 0.07 0.86
2000 0.25 0.33 0.42 0.09 0.07 0.84
2001 0.22 0.35 0.43 0.10 0.07 0.83
2002 0.22 0.34 0.44 0.11 0.07 0.82
2003 0.22 0.33 0.45 0.10 0.09 0.81
store outside Italy. 8 With this early expansion into advantages (FSAs) as well as the regional character-
the foreign triad region its sales are quite balanced istics of multinationals. Evidence from the largest
over the triad regions. Gucci’s regional sales in Asia one hundred cosmetics companies, in general,
are higher than its regional sales in Europe and supports the regional nature of MNEs (Rugman
America before 2000. Not only Gucci but also other and Verbeke, 2004). Cosmetics MNEs are home
European luxury goods retailers (LVMH and Riche- region oriented both in the geographic scope of up-
mont S.A.) also have 29% and 37% of sales in the stream FSAs and of downstream FSAs. However,
Asian region. 9 Compared to geographic dispersion they develop a world distribution of sales across
of sales, Gucci’s assets are concentrated in the home downstream activities more efficiently than for geo-
region. Gucci has invested more than 70% of assets in graphic upstream FSAs such as those derived from
the home region. As one of the most famous luxury supply chain sourcing and production. In general,
goods retailers, Gucci’s comparative advantage we find no evidence of a global supply chain for
comes from the standardized, high quality products cosmetics MNEs; it is regional. The development of
and the strong relationship with its supply channel. upstream activities in small cosmetics MNEs lags
Therefore Gucci has maintained its upstream FSAs behind the growth of downstream activities, com-
in the home region. pared to larger cosmetics MNEs.
However, Gucci has recently changed its interna- We further investigate that the asymmetry of the
tional strategy. Gucci’s home region sales in 2003 world cosmetics industry comes from the entry strat-
are almost double those in 1996, and its geographic egy of North American and European based cosmet-
dispersion of assets is highly focused on the home re- ics MNEs in the Asian market. Both North American
gion; see Table 6. Steenkamp, Batra and Alden (2003) and European cosmetics MNEs actively exploit
show that Korean and US consumers have almost the downstream FSAs in the Asian region (not upstream
same awareness of global brands. Therefore we can FSAs). They balance the two FSAs in the other triad
expect that global luxury brands will have no addi- regions. Two interesting case studies arise in the real
tional difficulties in penetrating the Asian market world cosmetics sector. Avon develops upstream
compared with the North American market. But FSAs more than downstream FSAs in foreign triads,
big changes happened during 1999–2001. Gucci ac- while Gucci is concentrating on developing down-
quired several European based luxury goods firms stream FSAs in foreign triads. These two MNEs have
during this period. Moreover, in 1999 it made a stra- to balance upstream FSAs and downstream FSAs in
tegic alliance with a large French based retailer, Pina- foreign regions as well as in their home region of
ult-Printemps-Redoute S.A. Through this acquisition the triad.
and alliance Gucci increased the ratio of its home re-
gion sales and assets. Now Gucci has a home regio- An MNE may develop an internationalization strat-
nal strategy based on a strategic resource seeking egy to reach maximum efficiency and profits based
international strategy. However, Gucci still needs to on its capability of utilizing upstream and down-
achieve a balance between upstream and down- stream FSAs. Differences in country specific advanta-
stream FSAs both in the home region and in the for- ges and firm specific advantage affect an MNE’s
eign regions. strategic choice in the market. However MNEs
should balance upstream and downstream FSAs.
They cannot obtain sustainable competitive advan-
tage when they focus only on what they do well.
Conclusions Asian countries should provide favorable investment
conditions to attract foreign direct investment from
In this study, we have analyzed the asymmetry be- the MNEs. Otherwise, the Asian region will not be
tween upstream and downstream firm specific an area where MNEs want to invest.
170 European Management Journal Vol. 24, Nos. 2–3, pp. 163–173, April–June 2006REGIONAL SALES OF MULTINATIONALS IN THE WORLD COSMETICS INDUSTRY
Appendix A
List of Largest 100 Cosmetics Companies and their Home-region Sales and Assets
Company Home Home Sales in Sales Assets
Country Region million
US$ % intra Category % intra Category
regional regional
L’Oreal Group France Europe 15,500 52.1 D(Q) 53.0 D(Q)
P&G USA America 13,000 57.0 A 53.6 A
Unilever PLC GB Europe 8,070 50.3 C 50.3 C
Shiseido CO.LTD Japan Asia 5,270 82.1 A 70.3 A
Estee Lauder USA America 5,100 57.7 A 67.8 A
Cosmetics Inc.
Avon Products Inc. USA America 4,490 62.6 A 51.2 C(Q)
Beiersdorf AG Germany Europe 3,790 75.1 A 80.1 A
Johnson & Johnson USA America 3,750 65.7 A 73.8 A
Alberto Culver Co. USA America 2,750 77.1* A 68.6* A
Kao Corp. Japan Asia 2,750 82.8 A 78.7 A
Limited Brands US America 2,600 na na
LVMH Louis Vuitton France Europe 2,470 38.0 D na
Chanel France Europe 2,240 na na
Colgate Palmolive US America 2,200 60.2 A 59.0 A
Henkel KGAA Germany Europe 2,140 75.0 A 68.9 A
The Boots Company PLC GB Europe 2,030 96.4* A 96.0* A
Mary Kay Inc. USA America 1,800 na na
Alticor Inc. USA America 1,800 na na
Yves Rocher France Europe 1,720 na na
Coty Inc. USA America 1,700 33.0 B na
Kanebo Japan Asia 1,680 na na
Kose Corp. Japan Asia 1,440 90.0* A 90.0* A
Revlon Inc. USA America 1,300 64.4* A 83.3* A
Amorepacific Corp. Korea Asia 1,090 na na
Sara Lee Corp. US America 1,080 68.8 A 81.7 A
Group Clarins France Europe 1,000 78.4 A 93.1 A
Puig Beauty and Fashion Spain Europe 990 73.0 A 77.8 A
Pola Cosmetics Inc. Japan Asia 881 na na
Gillette Co. US America 864 na na
Elizabeth Arden Inc. USA America 814 77.0 A 95.5 A
Oriflame Cosmetics Sweden Europe 738 90.8 A 98.2 A
Gucci Group (PPR) Netherlands Europe 696 43.8 D 81.1 A
Group Pierre Fabre France Europe 687 57.3* A 94.4* A
The Body Shop GB Europe 623 71.1 A 81.3 A
Nippon Menard Cosmetics Japan Asia 570 na na
Euroitalia Group Italy Europe 504 na na
LG Household and Health Korea Asia 495 97.2 A 99.2 A
Nu Skin Enterprises Inc. USA America 476 16.0 B na
Colomer Beauty and Prof. Spain Europe 450 na na
Clayton Dubilier and Rice US America 400 na na
Sisley France Europe 373 na na
Noevir Co. LTD Japan Asia 355 90.0* A 90.0* A
Markwins International US America 325 na na
DEL Laboratories US America 310 95.0* A na
Tigi USA America 250 na na
IWP Ireland Europe 206 86.9* A na
Liz Claiborne US America 200 77.9* A na
Inter Parfums GB Europe 186 50.0 C 74.2 A
Kelemata Group France Europe 181 na na
L’occitane France Europe 175 na na
(continued on next page)
European Management Journal Vol. 24, Nos. 2–3, pp. 163–173, April–June 2006 171REGIONAL SALES OF MULTINATIONALS IN THE WORLD COSMETICS INDUSTRY
Appendix A (continued)
Company Home Home Sales in Sales Assets
Country Region million
US$ % intra Category % intra Category
regional regional
Mirato SPA Italy Europe 175 90.5 A na
Guaber Group Italy Europe 170 na na
Ales Group France Europe 170 62.0 A 83.8 A
Johnson Publishing US America 170 na na
Eugene Perma France Europe 168 na na
Coreana Korea Asia 159 97.9* A 100.0* A
Diana De Shilva Italy Europe 158 na na
Bulgari Parfums Swiss Europe 155 45.0 C na
Combie INC. US America 154 na na
Micys (pupa) Italy Europe 149 na na
Maxim Marken Germany Europe 147 na na
O Boticario Brazil America 147 na na
Schering-Plough US America 146 na na
Von Berg Cosmetics US America 137 na na
Laboratoires Sarbec France Europe 130 70.0* A 100.0 A
Kalina Russia Europe 126 na na
Deborah Group Italy Europe 125 na na
Maurer + Wirtz Germany Europe 122 na na
Playtex Products US America 119 89.2* A 96.5* A
Parfums de Coeur US America 118 na na
Diamond Products US America 113 na na
Lush LTD. UK Europe 112 na na
Versace Profumi Italy Europe 110 na na
Sony Culture Ent. Japan Asia 105 na na
Paglieri Profumi Italy Europe 102 na na
Weleda AG Swiss Europe 102 na na
Doctor Babor Germany Europe 101 na na
MD Beauty US America 100 na na
Financiere Richemont SA Swiss Europe 95 43.2 D na
Collistar Italy Europe 93 na na
Tupperware US America 91 92.3 A 93.8 A
Marbert Germany Europe 84 79.1* A na
Parlux Fragrance USA America 81 64.8* A na
Jacques Bogart France Europe 80 na na
Tanning Research US America 79 na na
Artdeco Germany Europe 78 na na
Weruska & Joel SRL Italy Europe 76 na na
Fribad Germany Europe 74 na na
Hankook Korea Asia 72 98.0* A 100.0* A
Guinot Group France Europe 71 na na
Murad US America 67 na na
Mana Products US America 65 na na
Alcina Kosmetik Germany Europe 63 na na
Hermes France Europe 61 na na
Riviera Concepts Canada America 59 na na
Parfume Parlour France Europe 56 na na
Russkaya Kosmetika Russia Europe 55 na na
Charmzone Korea Asia 54 na na
Crabtree and Evelyn US America 52 na na
Perricone MD US America 52 na na
Source: See sources in Table 2.
Notes:
(a) Sales are total cosmetics sales in 2003 from WWD.
(b) A, B, C, and D represent Home-region oriented, Host-region oriented, Bi-regional, and Global multinationals respectively.
(c) * indicates portion of Home-country sales (assets) with respect to total sales (assets).
(d) (Q) indicates Quasi-; see notes in Table 4.
172 European Management Journal Vol. 24, Nos. 2–3, pp. 163–173, April–June 2006REGIONAL SALES OF MULTINATIONALS IN THE WORLD COSMETICS INDUSTRY
Notes strategy. Journal of Business Research 11(4), 439–
456.
1. WWD annually reports on the largest 100 cosmetics companies Dunning, J.H. (1993) Multinational Enterprises and the Global
based on sales. Economy. Addison-Wesley, New York.
2. We compare the sales from WWD and firms’ annual reports if Euromonitor (2003) Cosmetics and toiletries: World market
both are available. The values are almost identical in either overview. Presentation material at cosmetics trends
source excluding a few possible rounding errors. presentation, May 2003.
3. Procter and Gamble acquired Gillette in 2005. Johansson, J. and Vahlne, J. (1977) The internationalization
4. The definitions of classification are: home region (>50% of sales process of the firm: A model of knowledge develop-
in the home region); bi-regional (20% in another region); host region (>50% of sales Journal of International Business Studies 8(1), 23–32.
in another region of the triad); and global (20% in each region of the triad). We report large firms from developing countries: China’s oil and
categories of all cosmetics MNEs whose data are available in aerospace industries. European Management Journal
Appendix A. 21(3), 285–299.
5. LVMH (Moët Hennessy Louis Vuitton) group retails Christian Ohmae, K. (1985) Triad Power: the Coming Shape of Global
Dior, Guerlain, Kenzo, etc. Gucci group retails Yves Saint Competition. Free Press, New York.
Laurent, etc. Richemont SA retails jewelry and watches such as Rugman, A.M. (2000) The End of Globalization. Random
Baume and Mercier, Cartier, Piaget, Dunhill, etc, and also retails House, London/Amacom–McGraw-Hill: New York.
perfumes for those brands. Rugman, A.M. (2005) The Regional Multinationals: MNEs
6. 49 companies’ information is available for total sales in their and ‘‘Global’’ Strategic Management. Cambridge Uni-
annual reports and for cosmetics segments sales in either annual versity Press, Cambridge.
reports or WWD. Rugman, A.M. and Collinson, S. (2004) The regional nature
7. Only Gillette, LVMH and L’Oréal have higher brand values of the world’s automotive sector. European Manage-
than Avon and Gucci in the cosmetics industry. ment Journal 22(5), 471–482.
8. It opened the first Asian store in Japan in 1972. Rugman, A.M. and Collinson, S. (2005) Multinational
9. Data of regional assets for LVMH and Richemont S.A. are enterprises in the new Europe: Are they really global?
unavailable. Organizational Dynamics 34(3), 258–272.
Rugman, A.M. and Collinson, S. (2006) Japanese business is
regional. In Fratianni, Michele (eds.) Regional Economic
Integration. Elsevier: Oxford. Forthcoming.
References Rugman, A.M. and Girod, S. (2003) Retail multinationals
and globalization: the evidence is regional. European
Anderson, E. and Gatignon, H.A. (1986) Modes of foreign Management Journal 21(1), 24–37.
entry: A transaction cost analysis and propositions. Rugman, A.M. and Verbeke, A. (2004) A perspective on
Journal of International Business Studies 17(3), 1–26. regional and global strategies of multinational enter-
Bartlett, C. and Ghoshal, S. (1998) Managing Across Borders: prises. Journal of International Business Studies 35(1),
The Transnational Solution. (2nd ed.). Harvard Business 3–18.
School Press, Boston, MA. Schlie, E. and Yip, G. (2005) Regional follows global:
Burt, S., Davies, K., McAuley, A. and Sparks, L. (2005) strategy mixes in the world automotive industry.
Retail internationalisation: From formats to implants. European Management Journal 18(4), 343–354.
European Management Journal 23(2), 195–202. Steenkamp, J.-E.M., Batra, R. and Alden, D.L. (2003) How
Davidson, W.H. (1983) Market similarity and market perceived brand globalness creates brand value. Jour-
selection: implications for international marketing nal of International Business Studies 34(1), 53–63.
CHANG HOON OH, ALAN M. RUGMAN,
Kelley School of Business, Kelley School of Business,
Indiana University, Indiana University,
Bloomington, IN 47405, Bloomington, IN 47405,
USA. E-mail: chaoh@ USA. E-mail: rugman@
indiana.edu indiana.edu
Chang Hoon Oh is a Alan Rugman is the L.
Doctoral Candidate at Leslie Waters Chair of
the Kelley School of International Business at
Business, Indiana Univer- the Kelley School of Busi-
sity. Prior to this, he ness, Indiana University,
was Assistant Marketing where he is also Director of
Manager in a large electronic multinational enterprise. the Indiana University CIBER. Currently, he is Pres-
ident of the Academy of International Business.
European Management Journal Vol. 24, Nos. 2–3, pp. 163–173, April–June 2006 173You can also read