June 2021 Investor Presentation - Apria, Inc. Nasdaq: APR

Page created by Frederick Brady
 
CONTINUE READING
June 2021 Investor Presentation - Apria, Inc. Nasdaq: APR
June 2021
Investor Presentation - Apria, Inc.
Nasdaq: APR

©2021 Apria Healthcare Group Inc
June 2021 Investor Presentation - Apria, Inc. Nasdaq: APR
DISCLAIMER

This Presentation contains forward-looking statements within the meaning of Section 27A of the Securities Act of 1933, as amended, and
Section 21E of the Securities Exchange Act of 1934, as amended. You should not rely upon forward-looking statements as predictions of
future events. All statements other than statements of historical facts contained in this Presentation, including information concerning our
possible or assumed future results of operations and expenses, business strategies and plans, competitive position, business and industry
environment and potential growth opportunities, are forward-looking statements. Forward-looking statements involve known and unknown
risks, uncertainties and other factors that may cause our actual results, performance or achievements to be materially different from any
future results, performance or achievements expressed or implied by the forward-looking statements. Given these uncertainties, you should
not place undue reliance on any forward-looking statements in this Presentation. Except as required by law, we disclaim any obligation to
update any forward-looking statements for any reason after the date of this Presentation, or to update the reasons why actual results could
differ materially from those anticipated in the forward-looking statements, even if new information becomes available in the future.
Additional information regarding these and other risks and uncertainties that could cause actual results to differ materially from the
Company's expectations is included under “Risk Factors” in its Annual Report on Form 10-K for the fiscal year ended December 31, 2021 filed
with the SEC, as such factors may be updated from time to time in the Company’s periodic filings with the SEC.
You should not rely upon forward-looking statements as predictions of future events. Although Apria believes that the expectations reflected
in its forward-looking statements are reasonable, the Company cannot guarantee that the future results, performance, or events and
circumstances described in the forward-looking statements will be achieved or occur. Moreover, neither the Company, nor any other person
(including any underwriter of the Company’s securities), assumes responsibility for the accuracy and completeness of the forward-looking
statements. The Company undertakes no obligation to update any forward-looking statements for any reason after the date of this
presentation to conform these statements to actual results or to changes in our expectations, except as required by law.
This Presentation includes certain financial measures that are calculated and presented on the basis of methodologies other than in
accordance with generally accepted accounting principles in the United States of America (“GAAP”). These non-GAAP financial measures
should be considered only as supplemental to, and not as superior to, financial measures prepared in accordance with GAAP. Please refer to
the reconciliations of certain non-GAAP financial measures included in this Presentation to the most directly comparable financial measures
prepared in accordance with GAAP.

                                                                                                                                               2
 ©2021 Apria Healthcare Group Inc.
June 2021 Investor Presentation - Apria, Inc. Nasdaq: APR
APRIA Overview

©2021 Apria Healthcare Group Inc.
June 2021 Investor Presentation - Apria, Inc. Nasdaq: APR
Key Investment Highlights

                                            One of the Largest DME Operators in the U.S., with National
                                       11   Scale, Local Presence and Differentiated Capabilities

                                            Well Positioned to Capture Secular Growth Tailwinds in the
                                       21   Home-Based Care Setting

                                            Expansive Offering with Exposure to Attractive Product
                                       31   Markets

                                            Strong Relationships with Payors and Referral Sources
                                       41   Developed with Differentiated Sales Model

                                       51   Leadership in Clinical Delivery

                                       61   Leading Revenue Cycle Management

                                       71   Strong and Experienced Management Team

                                                                                                          4
©2021 Apria Healthcare Group Inc.
June 2021 Investor Presentation - Apria, Inc. Nasdaq: APR
Introduction to Apria
• A leading provider of integrated home healthcare equipment and related services in the United
  States

• Offers a comprehensive range of products and services for in-home care and delivery across 3 core                                                                              Therapies
  service lines: Home Respiratory, Obstructive Sleep Apnea, and Negative Pressure Wound Therapy

• Supplies a wide range of home medical equipment, other respiratory services and other products to                                                                           HOME
  help improve the quality of life for patients with home care needs                                                                                                       RESPIRATORY

• Provides home healthcare therapies that require high-touch service, including providing a bridge
  from the acute care setting to the home

       -      Expansive network of branches, delivery technicians and respiratory therapists                                                                               OBSTRUCTIVE
                                                                                                                                                                           SLEEP APNEA
       -      Variety of clinical and administrative support services and related products and supplies

• Expertise in fee-for-service as well as capitation arrangements; has a capitated arrangement with the
  largest west coast integrated healthcare system, Kaiser Permanente
                                                                                                                                                                             WOUND
• Well-positioned for future growth through favorable industry dynamics, transition to value-based                                                                            CARE
  care, expansion of products and service offerings, leveraging in-home patient interactions and driving
  volume growth through e-commerce

                                      ~$1.1bn                                              ~18%                                              ~6,500                                      275
  Key                                  Revenue                                   Adj. EBITDA Margin(3)                                        Employees                              Branches
Stats(2)                                                       90%                                                          6%                                         2.4mm
                                       US Population We Are Able to Reach                                    DME Industry Growth(1)                                  Annual Deliveries

 (1)       CMS Projections for DME spend from 2018 through 2028.
 (2)       For the year ended December 31, 2020 except as otherwise noted.
 (3)       Represents the average across 2019 and 2020 period. Adjusted EBITDA and EBITDA Margin represents a non-GAAP measure, see Appendix for a reconciliation.

                                                                                                                                                                                                5
  ©2021 Apria Healthcare Group Inc.
June 2021 Investor Presentation - Apria, Inc. Nasdaq: APR
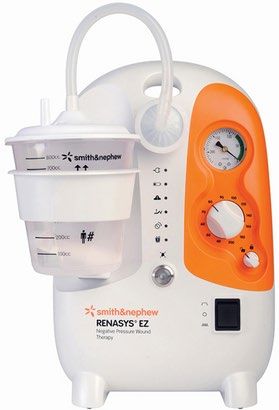
Business Updates Since IPO
• CMS permanently removes Budget Neutrality and provides oxygen rate increase
              - In April, the Centers for Medicare & Medicaid Services (CMS) increased the oxygen
                reimbursement rates by an average of ~10% and ~5% for CBA and non-CBA areas, respectively
              - Due to the Consolidated Appropriations Act of 2021 eliminating budget neutrality requirements

• COVID-related
              - On April 16th, CMS extended the Public Health Emergency (PHE) through July, will be updated in
                90 day increments
              - CMS suspended sequestration payment adjustment through December 31, 2021

• Additions to Management and the Board
              - Appointed Michael-Bryant Hicks as General Counsel
              - Appointed Susannah Gray, former CFO of Royalty Pharma and Terri Kline, former EVP of Henry
                Ford Health System, to the Company’s Board of Directors
              - Gray and Kline will serve on the Board’s Audit Committee

• Financial
              - Q1 2021 Summary
                          • Net revenue of $275.3 million, up 2% YOY
                          • Adjusted EBITDA of $48.3 million, up 15% YOY
                          • Adjusted EBITDA less Patient Equipment Capex of $24.7 million, up 41% YOY

Source: Company filings and press releases.
                                                                                                                 6
 ©2021 Apria Healthcare Group Inc.
June 2021 Investor Presentation - Apria, Inc. Nasdaq: APR
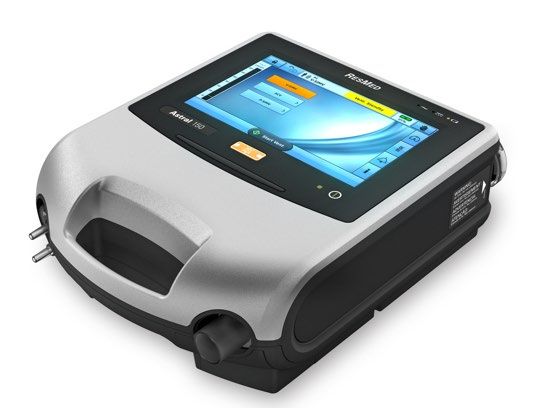
What is DME and How is it Vital to Home Care?

The Durable Medical Equipment (“DME”) industry allows patients to receive treatment of chronic illnesses in their
preferred home setting

 Overview of DME                                                                          DME is Vital to Home Care
• Critical medical equipment used in the home to enable
                                                                                                Allows patients with complicated healthcare
  patients to be home with a better quality of life
                                                                                                needs to transition to a preferred home setting
• Reimbursed by healthcare insurance including Medicare

• Primarily serve patients with need for respiratory, sleep and
  mobility equipment including oxygen equipment, CPAP                                           Provides for greater patient independence and
                                                                                                better outcomes
  equipment, wound care equipment, wheelchairs, hospital
  beds, bathroom aids, and other home medical equipment

• Strategic entry point into the patient home, where care
                                                                                                Serves a large and growing demand for
  provision continues to grow                                                                   treatment of chronic illnesses

                                                                                                Strategic entry into the patient home enables
                                                                                                trust and patient relationships

                                         Oxygen Concentrator
CPAP Machine & Mask                                                  Wound Care Therapy

                                                                                                Harnesses continual technological evolution for
                                                                                                better care in the home

                                    Wheelchair            Rolling Walker

                                                                                                                                                  7
©2021 Apria Healthcare Group Inc.
June 2021 Investor Presentation - Apria, Inc. Nasdaq: APR
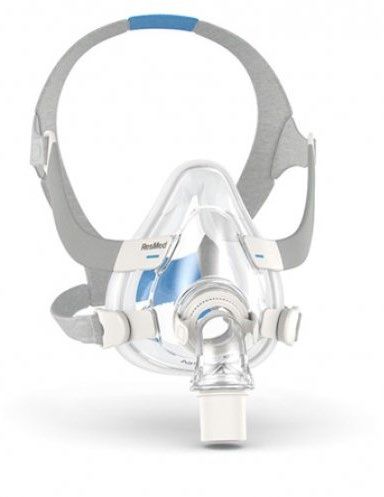
Highly Favorable Industry Dynamics
We believe Apria is well positioned to capture favorable industry trends, including: increasing prevalence of chronic disease, rapid
technological advancements, and a growing aging population, which are the leading factors propelling the overall demand for durable
medical equipment

Durable Medical Equipment Expenditures: Historic & Projected (CMS)
($ in billions)

                                                                                                                                                                 $93   $98
                                                                                                                                                     $83   $88
                                                                                                                                         $74   $78
                                                                                                                      $66          $70
                                                                                                 $58        $62
                                                        $49      $51        $52       $55
               $42            $44    $45        $47
  $40

 2010         2011          2012     2013       2014   2015     2016       2017       2018      2019E 2020E 2021E 2022E 2023E 2024E 2025E 2026E 2027E 2028E

                                            •   United States population aged 65 and over will grow substantially from 15.2% of the population in 2016 to 20.6% of the
      Aging Population                          population by 2030
                                            •   Increasing obesity rates and clinical consequences of the high prevalence of smoking from earlier decades will drive
    Rising Incidence Of                         higher diagnosis rates for a number of chronic conditions
     Chronic Diseases
                                            •   Certain chronic diseases currently under-diagnosed
                                            •   Home healthcare increasingly sought out as an attractive, cost-effective, and clinically appropriate alternative to
 Continued Shift Toward                         facility-based care
   Home Healthcare
                                            •   Pandemic environment further emphasized the need for homecare as a lower risk setting for many patients

 Preference For In-home                     •   Improved technology has resulted in a wider variety of treatments being administered in patient homes
          Care                              •   Patients prefer the convenience and independence of in-home care
    Highly Fragmented                       •   Between 2012 and 2018, the overall number of Durable Medical Equipment, Prosthetics, Orthotics and Supplies
          Market                                (“DMEPOS”) suppliers that bill Medicare more than $10 million annually fell from 73 to 57

Sources: CMS, United States Census Bureau, Medicare Payment Advisory Commission, HME News, and Henry J. Kaiser Family Foundation

                                                                                                                                                                             8
 ©2021 Apria Healthcare Group Inc.
June 2021 Investor Presentation - Apria, Inc. Nasdaq: APR
Apria’s Market Opportunity is Large and Growing
Apria is aligned with a number of large and growing markets, which are all benefitting from increased shift to in-
home care

                                                                        Market Size and Growth Estimates

 1      Respiratory Devices                                                                                                          Market Size ($B)                Market Growth (%)
        •      COPD patient population continues to grow as average age increases
        •      Oxygen therapy is a feeder into non-invasive ventilation as the patient
               disease state progresses                                                                                                    $6.2B(1)                      6.3%(1)
        •      Rising prevalence of chronic respiratory diseases

 2      Obstructive Sleep Apnea
        •      80% of moderate and severe sleep-disordered breathing cases remain
               undiagnosed                                                                                                                 $2.2B(2)                      7.6%(2)
        •      1 in 15 adults has moderate to severe obstructive sleep apnea, while 1 in 10
               adults has diabetes (prevalence similar to asthma)

 3      NPWT (Wound Therapy)
        •      Aging population increases size of addressable market                                                                       $2.1B(3)                      5.2%(3)
        •      New product development and research for treatment best practice

Source: Industry research
(1) Represents estimated market size of Respiratory Care Devices Market in North America as of 2018, with estimated compound annual growth from 2018 through 2025.
(2) Represents estimated market size of Sleep Apnea Devices Market in North America as of 2018, with estimated compound annual growth from 2018 through 2025.
(3) Represents estimated market size of NPWT Devices Market globally as of 2018, with estimated compound annual growth from 2018 through 2023.

                                                                                                                                                                                     9
 ©2021 Apria Healthcare Group Inc.
June 2021 Investor Presentation - Apria, Inc. Nasdaq: APR
Apria’s Value Proposition

We offer a compelling value proposition for Patients, Providers and Payors

                        PATIENTS                            PROVIDERS                             PAYORS

    Committed to improving                           Aim to be a trusted advocate      Seek to effectively manage the
     experience and clinical                        and provider of patient clinical   transition from the acute care
 outcome for each patient we                          needs in patients’ homes,          setting to a low-cost home
    serve. Patients generally                       while fostering lasting doctor-     setting with a high reliability
  prefer the convenience and                            patient relationships          of clinical support and quality
   typical cost advantages of                                                                equipment to lower
     home healthcare over                                                                     readmission rates
        institutional care

                                    Provide reliable, consistent service with 24/7/365 availability

                                                                                                                      10
©2021 Apria Healthcare Group Inc.
Strategic Entry Point Direct to Patients In-home

Through a diversity of touch points with delivery technicians, respiratory therapists, and customer service personnel
Apria’s platform provides a direct entry point into the home with a range of strategic opportunities

• Number of home encounters, largely through delivery technicians and respiratory therapists,
  provides a bridge between acute care setting to home healthcare setting
    -      ~2 million unique patients serviced in 2020                                             Hospital        Physician Office
    -      ~2.4 million deliveries made in 2020
    -      Over 735,000 clinician interactions in 2020
    -      Approximately 275 branches with ability to reach more than 90% of the U.S. population
• Apria’s platform and operations provide a direct entry point into the home with strategic
  ramifications across a range of applications for one of the sicker and more costly patient
  populations
    -      Population health
    -      Nursing and other homecare services
    -      Chronic disease management
    -      Remote patient monitoring
• Apria’s infrastructure is scalable and we believe can support the addition of new products
  and services with minimal incremental investment in sales and distribution or other fixed
  costs                                                                                                       Patient Home

                                                                                                                                11
©2021 Apria Healthcare Group Inc.
National Scale With Differentiated Capabilities
As one of the leading national platforms with a substantial urban presence, Apria has differentiated capabilities with
cost advantages and strategic / commercial implications
             National Platform                       Managed Contracts                   Leading RCM Expertise         Tech-Enabled Infrastructure

                                          «˜

        BROAD NATIONAL SCALE                   HIGH COMMERCIAL PAYOR MIX                 REVENUE MANAGEMENT                      TECHNOLOGY
•     Over 275 branches with                   •   Over 1,600 payor contracts        •   Centralized billing       •    Electronic prescribing
      ability to reach more than               •   ~78% of revenue from              •   Core competency in        •    Telehealth platform
      90% of the U.S. population                   Commercial payors(1)                  commercial and Medicare   •    Robotics Process Automation
•     National sales force                                                               billing
                                               •   Expertise in fee-for-service as
                                                                                                                   •    Workflow automation
•     Ability to serve most U.S.                   well as capitation                •   Automated insurance
      hospital facilities                                                                eligibility validation    •    Patient eSign
                                               •   Capitated arrangement with
•     National single-source deals                 the largest west coast            •   Online payment portal     •    Customer relationship
      with integrated health                       integrated healthcare system,                                        management
      systems                                      Kaiser Permanente                                               •    Retail eCommerce
•     Robust logistics platform                                                                                    •    Data Analytics /KPIs
•     High quality clinical                                                                                        •    Driver routing and dispatch
      capabilities

(1)   For the year ended December 31, 2020.

                                                                                                                                                      12
 ©2021 Apria Healthcare Group Inc.
Expansive Offering in Attractive Product Markets
Apria is contracted with nearly all insurance companies and managed care organizations to provide a comprehensive
range of services for in-home care and delivery

                                                                        Obstructive Sleep Apnea         Negative Pressure Wound            Home Medical Equipment
                                     Home Respiratory Therapy
                                                                              Treatment                         Therapy                      and Other Services

     2020 Revenue                              $454mm                            $454mm                            $43mm                             $158mm

 % of Total Revenue                              41%                               41%                               4%                                14%

                                     Home respiratory therapies,      One of the largest providers    Equipment, supplies and           Home medical equipment
                                      including complex                 of OSA therapy devices and       services to facilitate wound
Business Description                  respiratory treatment             services in the U.S.             dressing and healing at
                                                                                                         home, across all severities of
                                                                                                         wounds
                                     Oxygen, nebulizers, unit         CPAP, BiPAP, masks &            Pumps, dressings & supplies       Beds, wheelchairs & aids for
                                      dose medications &                supplies                                                            activities of daily living
                                      ventilators                      Fully-integrated sleep
 Products / Services
                                     Noninvasive ventilation (NIV)     management program

                                     COPD, CHF and acute              Obstructive Sleep Apnea         Acute and chronic complex         Stroke, inability to ambulate
 Diagnosis Examples                   respiratory distress                                               wounds

                                                                                                                                                                            13
©2021 Apria Healthcare Group Inc.
Strong Payor and Referral Source Relationships
                                Key Statistics and Value Proposition                                       Illustrative Clients

•       Apria offers Payors access to an extensive national footprint,
        national logistics systems, respiratory clinical expertise,
        competitive pricing, alternative payment arrangements,
        including fee-for-service and capitation for defined patient
        populations, and our ability to connect electronically with
        Payors’ systems
•       Apria has actively worked to improve its payor mix, with
        Commercial Payors accounting for ~78% of 2020 revenues
•       The top Payor (Kaiser Permanente) accounted for 23% of
        revenue in 2020

                                               Payor Mix                                                  Payor Concentration

                                                                                                  All Other
                                                             Medicare                              Payors                         #1 Payor
                                                              21%              Government           23%                             23%
                                                                                  22%

                                                                       Medicaid
                                                                         1%

                                          Commercial (1)
                                             78%
                                                                                            #2 Medicare
                                                                                               21%
                                                                                                                                  #3 - #8 Payors
                                                                                                                                       33%

(1)     Managed care payors are included in Commercial segment of Payor Mix.
Note: All numbers reflected on page represent 2020 data.
                                                                                                                                                   14
      ©2021 Apria Healthcare Group Inc.
Leader in Clinical Delivery
Apria has differentiated clinical expertise, leveraging protocols and data to drive optimal outcomes across its
product lines

                                            COPD                                         Obstructive Sleep Apnea (OSA)
•     From nebulizers to Oxygen to NIV, seamless product offering         •   Apria’s sleep therapy program is designed to provide patients
      along the COPD continuum                                                with the convenient options they want and the tools they need
•     Apria’s patient centric clinical program is driven by Respiratory       to succeed
      Therapists personally involved in patient follow-up to address      •   Premium Care SleepTM
      issues and help improve therapy compliance
                                                                              -   Fully-integrated sleep management program designed to
•     Apria provides comprehensive care for COPD patients                         conveniently provide OSA patients with the tools they need
      throughout all stages of the disease from mild to severe or very            to improve their sleep
      severe
                                                                              -   Monitors the OSA treatment compliance of almost 168,000
                                                                                  sleep patients on a nightly basis during the critical first 90
                                                                                  days of their treatment and proactively reach out to
                                                                                  patients who may need help to improve their compliance
                                                                                  through clinical intervention and other support from Apria

                                        Select Products                                                Select Products

     Battery Powered                    Portable Oxygen     Home                  Bilevel Positive Airway
                                                                                                                           CPAP Mask
        Nebulizer                        Concentrator     Ventilator                  Pressure Device

                                                                                                                                                   15
    ©2021 Apria Healthcare Group Inc.
Strong and Experienced Management Team

  Experienced management team who has guided the company through recent industry transition and positioned the
  company for growth
                      Company Officer                                  Years at Apria                   Selected Experience¹

                    Daniel Starck
                                                                           23 Years2
                    Chief Executive Officer

                    Debra Morris
                                                                             8 Years
                    EVP, Chief Financial Officer

                    Michael-Bryant Hicks
                                                                             1 Year
                    EVP, General Counsel & Secretary

                    Angela Fyfe
                                                                             5 Years
                    EVP, Enterprise Services

                    Robert Walker
                                                                            12 Years
                    EVP, Managed Care

                    Mark Litkovitz
                                                                            12 Years
                    EVP, Chief Information Officer

                    Celina Scally
                    Chief Human Resources Officer,                          31 Years
                    SVP

(1)     Includes individuals who have returned to Apria.
(2)     Dan was with Apria for 14 years prior to joining Corvel in 2006, then rejoined Apria in 2012.

                                                                                                                               16
      ©2021 Apria Healthcare Group Inc.
Fragmented HME Market Offers Growth Opportunity

                      Medicare HME Providers(1)                                                            Competitive Landscape

                  8,837

                                                     6,152

              July 2013                          April 2020

     • Highly fragmented industry in consolidation phase driven by CMS competitive bid program
     • National competitors are gaining share primarily through acquisitions
     • Medicare competitive bidding results provide for rate stabilization and opportunity for consolidation of smaller and regional providers
     • Illustrative Acquisition Criteria:
                   • Size:
Growth Strategy
 Apria has a range of highly executable growth strategies targeting new and existing markets

                                                                                    Grow eCommerce through a
                                                                                    Patient-centric Approach
                                                                                    ‒ Service existing patients with
                                                                                       new offerings and also serves
                                           Strategic Acquisitions                      as an additional acquisition
                                           ‒ Continue to evaluate such                 channel for new patients
                                              opportunities through a               ‒ Direct-to-patient marketing
                                              disciplined approach, seeking            focused on service and clinical
                                              complementary acquisitions               support
Maintain Leadership in Existing            ‒ Various markets we
Markets                                       participate in remain highly
‒ National platform that is                   fragmented and ripe for
  difficult to replicate                      consolidation
‒ Actively working to increase                                                                                             5
  the diagnosis and treatment of
  OSA through collaboration with                                                                4
  primary care physicians
‒ Leverage these strengths to
  maintain share and capture
                                                                      3
  market growth

                                                2                                                                 Enable the Transition to Value-based
                                                                                                                  Healthcare
                                                                                                                  ‒ Ability to transition patients from
                                                                                                                    the acute care setting to the
                                                            Expand Product and Service Offerings                    home, as well as to support the
                                       1                    ‒ Continued focus on expanding new                      prevention of unnecessary
                                                               product lines and services both                      readmissions
                                                               organically and through acquisitions               ‒ Demonstrated expertise in non-
                                                            ‒ Diabetes and the provision of diabetic                traditional payment models, such
                                                               supplies represents a compelling                     as capitation arrangements
                                                               opportunity, as diabetic patients often
                                                               suffer from many co-morbidities,
                                                               including OSA and respiratory which
                                                               we already treat

                                                                                                                                                          18
   ©2021 Apria Healthcare Group Inc.
Historical Financial Overview

©2021 Apria Healthcare Group Inc.
Q1 ’21 Update

 Apria’s first quarter 2021 results were ahead of expectations building on momentum from 2020

                                        Commentary                                                                                              Net Revenue
                                                                                                            (in $mm)
• First quarter 2021 results were ahead of expectations
  on all three key metrics, building on momentum from                                                                              $269
                                                                                                                                                                 $275
  2020 and establishing a solid foundation for future
  growth

                                                                                                                                 Q1 2020                       Q1 2021

                                      Adjusted EBITDA(1)                                                                       Adj. EBITDA – Patient Equipment Capex(1)
(in $mm)                                                                                                    (in $mm)
                                                                       $48                                                                                        $25

                             $42                                                                                                     $18

                         Q1 2020                                    Q1 2021                                                       Q1 2020                       Q1 2021

 % Margin                    15.6%                                    17.5%                                   % Margin               6.5%                         9.0%

  (1)   Adjusted EBITDA and Adjusted EBITDA – Patient Equipment Capex are non-GAAP measures. See Appendix for a reconciliation to net income.
                                                                                                                                                                          20
  ©2021 Apria Healthcare Group Inc.
Apria Historical Financial Performance

              Apria has consistently demonstrated volume growth and margin expansion by focusing on product and payor mix and
              operating efficiency

                                                    Net Revenue(1)                                                                                          Adjusted EBITDA(3)
          ($ in millions)

                          $1,079                           $1,089                            $1,109
                                                                                                                                                                                                        $227

                                                                                                                                                                       $174
                                                                                                                                      $156

                            2018                            2019                              2020                                    2018                             2019                            2020
                                                                                                                                                                                          (3)
Total                         4.7%                           0.9%                              1.8%                                                   Adjusted EBITDA Margin

Core(2)                       5.7%                           3.6%                              3.8%                                   14.4%                           16.0%                            20.5%

          •     Core(2) business of Home Respiratory, Obstructive Sleep                                                      •     Margin improvement from focus on payor and product mix,
                Apnea, and Negative Pressure Wound Therapy continue to                                                             continued process improvement and resultant reduced costs, and
                grow                                                                                                               strategic initiatives including Project Simplify
          •     Strong growth in 2020 primarily due to increased volume of                                                   •     2020 reflects higher rates, lower administrative burden and lower
                home respiratory patients and growth in sleep supplies                                                             cost structure resulting from Project Simplify, and reduction of
                                                                                                                                   variable costs during COVID
                                                                                                                             •     2020 Adjusted EBITDA up 30.4% YoY

              (1)   Net revenue for 2018 restated for the impact of adopting Topic 842. See appendix for net revenue reconciliation.
              (2)   Core includes the Home Respiratory Therapy, OSA Treatment, and NPWT service lines.
              (3)   Adjusted EBITDA and Adjusted EBITDA Margin are non-GAAP measures. Adjusted EBITDA margins are calculated based on restated net revenues. See Appendix for a reconciliation to net income.
                                                                                                                                                                                                                21
              ©2021 Apria Healthcare Group Inc.
Historical Net Revenue by Service Line
   Apria’s strategy has been to focus payor mix on higher priced managed care business, drive OSA and sleep resupply
   growth, grow NIV, and further establish its eCommerce presence while strategically de-emphasizing non-core,
   unprofitable businesses
 (in $mm)                               $1,079                      $1,089                             $1,109

                                                                     $173                               $158
                                        $195
                                                                                    $42                                $43
                                                  $40

                                                                     $439                               $454
                                        $421

                                                                                                                                           $269                         $275
                                        $423                         $436                               $454                                $40          $10             $37      $10
                                                                                                                                           $109                         $114
                                                                                                                                           $110                         $114
                                        2018                         2019                               2020                     Three Months Ended            Three Months Ended
                                                                                                                                       Mar. 31,                      Mar. 31,
                                                                                                                                        2020                          2021

                                          Home Respiratory Therapy              Obstructive Sleep Apnea                   NPWT              Other Equipment and Services

                                                                                                                                                                               Three Months Ended
                                                                                                          Year Ended December 31,
                                                                                                                                                                                    March 31,

% Net Revenue Growth                                                             2019                                  2020                            ‘18 - ’20 CAGR                   2021

Home Respiratory Therapy                                                              3%                                    4%                                 4%                         4%

Obstructive Sleep Apnea                                                               4%                                    4%                                 4%                         4%

NPWT                                                                                  5%                                    2%                                 3%                         0%

Core Products                                                                         4%                                    4%                                 4%                         4%

Other Equipment and Services                                                       (11)%                                  (9)%                              (10)%                        (8)%

Total                                                                                 1%                                    2%                                 1%                         2%

   Note: Net revenue for 2018 has been restated for the impact of adopting Topic 842 for comparability. See appendix for net revenue reconciliation.

                                                                                                                                                                                                    22
    ©2021 Apria Healthcare Group Inc.
Patient Equipment Capex Overview
                                 Patient Equipment Capex                                                                         Adj. EBITDA – Patient Equipment Capex
(in $mm)                                                                                                          (in $mm)

               $110
                                                 $93                             $93

                2018                            2019                            2020
                    Patient Equipment Capex % of Net Revenue                                                    Adj. EBITDA – Patient Equipment Capex % of Net Revenue
                10%                              9%                               8%                                           4%                                7%                               12%

 • Home Respiratory Therapy and Obstructive Sleep Apnea comprise the majority of Patient Equipment Capex mix
 • Investment in sleep units (i.e., CPAP) enables related growth in less capital-intensive sleep supplies
 • Strong improvement in Adj. EBITDA less PSE Capex driven by implementation of strategic initiatives, like Project Simplify,
   coupled with lower levels of capital expenditures beginning in 2019 due to the effective management of asset utilization
   and capex spend

   Note:       Net revenue for 2018 has been restated for the impact of adopting Topic 842 for comparability. Patient Equipment Capex margins are calculated based on restated net revenues. See appendix for net revenue
               reconciliation
                                                                                                                                                                                                                     23
   ©2021 Apria Healthcare Group Inc.
Conclusion

©2021 Apria Healthcare Group Inc.
Conclusion

Apria is a leading national provider well positioned for growth in the attractive home healthcare market

                                    Leading Market Position in a Consolidating Fragmented Market
                                     Aging population, shift to lowest cost care setting, greater access to insurance coverage, and rising
Favorable Market With Volume          incidence of chronic diseases
Growth Tailwinds
                                     U.S. DME market is expected to grow at a 6% CAGR between 2019 and 2028 by CMS
                                     Nationwide footprint able to reach 90% of the U.S. population, with local market expertise
National Scale with Local
Presence                             Leveragable centralized infrastructure for adjacent healthcare products and other services offered at
                                      home; one of the largest urban platforms nationally

                                     High quality, clinically appropriate care across a broad spectrum of services and treatments
Expansive Product Offering           Ability to offer other products and services with what we believe is minimal incremental investment in
                                      sales, distribution, and other fixed costs

Strategic Entry Point Into the       Applicable across (1) population health, (2) nursing and other homecare services, (3) chronic disease
Home                                  management, and (4) remote patient monitoring

Strong Long-term Relationships       Deep and long-standing relationships with all national and regional insurers as well as Medicare
with Payors and Referral
Sources                              Flexibility in payment arrangements and ability to offer geographical reach

                                     Convenient method of distribution to existing patients, as well as additional acquisition channel for new
Patient-centric e-Commerce            patients
Platform                             Primarily focused on lower capital intensive supplies and accessories, enabling attractive opportunity
                                      for higher cash flow generation

Experienced Management               Led by an experienced team with a track record of delivering results
Team

                                                                                                                                                  25
©2021 Apria Healthcare Group Inc.
Appendix

©2021 Apria Healthcare Group Inc.
Reconciliation of Adjusted EBITDA
(in $mm)                                                                                                                               Year Ended December 31,                                                         Three Months Ended March 31,

                                                                                                                     2018                             2019                              2020                             2020                             2021
 Net Income                                                                                                           $13                               $16                              $46                               $6                                $5
 Interest Expense, net and Other                                                                                        0                                 4                                6                                1                                 3
 Income Tax                                                                                                             7                                 8                               19                                2                                 4
 Depreciation and Amortization                                                                                        125                               112                              115                               29                                30
 EBITDA                                                                                                              $145                             $139                              $186                              $39                               $41
 Strategic Transformation Initiatives:                                                                                  2                                13                                3                                1                                 0
      Simplify(1)                                                                                                       --                               12                                1                                0                                --
                                   (2)
      Financial systems                                                                                                 --                               --                                2                                1                                 0
                                 (3)
      Other initiatives                                                                                                 2                                 1                                0                                0                                --
 Stock-based compensation one-time award at IPO(4)                                                                      --                               --                                --                               --                                2
 Stock-based compensation(5)                                                                                            2                                 9                                5                                1                                 1
 Legal Settlements(6)                                                                                                   --                               12                               29                                2                                 2
                         (7)
 Offering Costs                                                                                                         6                                 1                                3                                --                                3
 Adjusted EBITDA                                                                                                     $156                             $174                              $227                              $42                               $48
 Patient Equipment Capex                                                                                             (110)                             (93)                              (93)                             (24)                             (24)
 Adjusted EBITDA less Patient Equipment Capex                                                                         $46                               $81                             $134                              $18                               $25

Note: Dashed out (“—”) figures indicate an N/A adjustment, while “0” figures indicate an adjustment of less than $500,000.
1.    Simplify represents one-time advisory fees and implementation costs associated with a key 2019 business transformation initiative focused on shifting to a patient-centric platform and optimizing end-to-end customer service.
2.    Costs associated with the implementation of a new financial system.
3.    Other initiative includes one-time third-party logistics advisory costs associated with a 24-month initiative launched in January 2018 designed to modify the branch network in order to reduce branch operating costs while maintaining or improving patient service
      levels, one-time costs associated with customer service initiatives, one-time costs associated with implementation of an electronic sales, service and rental agreement and one-time costs associated with developing and launching our e-commerce platform.
4.    The Company’s initial public offering (“IPO”) resulted in a one-time restricted stock (“RSU”) grant to the Company’s Chief Financial Officer (“CFO”). The RSUs vest in tranches and are classified as liability awards since each tranche of RSUs can be settled in either
      cash or shares of our common stock at the CFO’s election. The first tranche of RSUs vested upon completion of the IPO and was settled in cash. Compensation expense for the remaining tranches is recognized over the requisite service period subject to continued
      employment and adjusted each reporting period for changes in the fair value pro-rated for the portion of the requisite service period rendered until settlement.
5.    Stock-based compensation has historically been granted to certain of our employees in the form of profit interest units of our parent and stock appreciation rights. For time-based vesting awards, we recognize a non-cash compensation expense based on the fair
      value of the awards determined at the date of grant over the requisite service period. Stock compensation also includes expense related to the Company’s long-term incentive plan which will be settled in stock.
6.    In 2021, the amount represents the final settlement amount of a claim brought under the Private Attorneys General Act of California. Represents the increase in the settlement amount in relation to a series of civil investigative demands from the United States
      Attorney’s Office for the Southern District of New York offset by a one-time unrelated $3.0 million recovery in 2020.
7.    Offering costs represent one-time costs relating to preparation for our IPO and accelerated implementation of new accounting standards. As the Company did not receive any proceeds from the offering, these costs were expensed as incurred in selling, distribution
      and administrative expenses in the consolidated statements of income.

                                                                                                                                                                                                                                                                               27
      ©2021 Apria Healthcare Group Inc.
Reconciliation of Net Revenue
(in $mm)                                                                                                     Year Ended December 31,            Three Months Ended March 31,

                                                                                               2018                  2019              2020      2020               2021

Net Revenue                                                                                   $1,111                $1,089             $1,109    $269               $275

Less: Provision for Doubtful Accounts                                                            32                    --                --        --                 --

Net Revenue (on a comparable basis)                                                           $1,079                $1,089             $1,109    $269               $275

 Note: Dashed out (“—”) figures indicate an N/A adjustment, as Topic 842 was adopted effective January 1, 2019.

                                                                                                                                                                               28
    ©2021 Apria Healthcare Group Inc.
History of Apria
                                                                                                                              The Strategic Transformation
                                                                                                                                       Since 2012
2019: Launched Project Simplify: Initiatives to transform
Apria’s Order to Billing Process, Order Fulfillment
Strategy, and Organizational Structure
                                                                                                                         •   New Management Team
2014: Launched non-invasive ventilation (“NIV”)                                                                          •   Changed Payor and Product mix
as part of complex respiratory program                                                                                   •   Launched NIV (2014)
                                                                                                                         •   Implemented new patient
2013: Announced the sale of Coram to CVS                                                                                     monitoring and data collection
Caremark                                                                                            2019                     technology
                                                                                        2014                             •   Improved sales productivity
                                                                             2013                                        •   Formed strategic relationships with
                                                                 2011
                                                                                                                             suppliers
                                                                                                                         •   Streamlined management structure
                                                      2008                                                               •   Consolidated branch network &
                                                                                                                             operations
                                                                                2011: Strategy identified to separate
                                            2007                                Apria into two operating companies –     •   Built scalable data analytics and
                                                                                Respiratory and Infusion                     forecasting infrastructure
                                                                                                                         •   Centralized Billing, Collections and
                                                                   2008: Announced the sale of Apria to the Blackstone       Customer Qualification
                                  1995
                                                                   Group
                                                                                                                         •   Executed on 100+ operational
                                                                                                                             improvements
                                                      2007: Announced the acquisition of Coram for $350 million, a
                                                                                                                         •   Reinforced “ONE Apria” culture to
                                                      privately held provider of home infusion and specialty
                                                      pharmaceutical services
                                                                                                                             improve collaboration and focus
                                                                                                                         •   Re-evaluated local, regional, and
                                                                                                                             centralized activities to improve
                                            1995: Apria created following the merger of Homedco Group with Abbey
                                            Healthcare Group
                                                                                                                             accountability and effectiveness

                                                                                                                                                                    29
        ©2021 Apria Healthcare Group Inc.
Improving the Quality of
     Life for our Patients at Home

©2021 Apria Healthcare Group Inc.
You can also read