ANNUAL ANALYST MEET - JUNE 2018 - Zee Learn
←
→
Page content transcription
If your browser does not render page correctly, please read the page content below
ANNUAL ANALYST MEET - JUNE 2018
Disclaimer
This presentation does not constitute or form part of, and should not be construed as, any offer or invitation to sell or issue, or any solicitation or any offer to purchase
or subscriber for, any securities to any person in any jurisdiction to whom or in which such offer or solicitation is unlawful. The presentation, or the fact of its
distribution, shall not form the basis of, or be relied on in connection with or act as any inducement to enter into, any contract, commitment or investment decision
whatsoever relating to any securities.

The presentation and any other information made available orally or in writing at the presentation is confidential and should not be distributed, published, copied or
reproduced (in whole or in part) or disclosed by its recipients to any other person for any purpose, at any time or in any form other than with the prior written consent
of the Company.

The information contained in this presentation, unless otherwise specified, is only current as of the date of the presentation. Unless otherwise stated in this document,
the information contained herein is based on management’s information and estimates and past performance is not indicative of future results. The information
contained herein or any information made available orally or in writing at the presentation is subject to changes without notice. The information contained in this
presentation has not been independently verified. No reliance may be placed by any person for any purpose whatsoever on the information or opinions contained or
expressed in the presentation or on the completeness, accuracy or fairness of such information or opinions. Recipients of the presentation should conduct their own
investigation, evaluation and analysis of the business, data and property described in this presentation.

This presentation including the forward looking statements / projections of MT Educare Ltd are prepared on the basis of information and data provided by the
management of MT Educare Ltd. By their nature, forward looking statements involve risks and uncertainties because they relate to events and depend on
circumstances that may or may not occur in the future and may be beyond the Company’s ability to control or predict. Forward-looking statements are not guarantees
of future performance. No representation is made that any of these statements or forecasts for Zee Learn / MT Educare will come to pass or that any forecast result will
be achieved as these are prepared as per the estimates of management of Zee Learn and MT Educare. Recipients of this presentation are advised to carry on their own
research and analysis and are cautioned while exercising their reliance on these forward-looking statements.

This presentation is not directed to, or intended for distribution to or use by, any person or entity that is a citizen or residential located in any locality, state, country or
other jurisdiction where such distribution, publication, availability or use would be contrary to the law or regulation of, or which would require registration of licensing
within, such jurisdiction.

By accepting or accessing this presentation or attending any presentation or delivery of this presentation you agree to be bound by the foregoing limitations and
conditions and, in particular, will be taken to have represented, warranted and undertaken that you have read and agree to comply with the contents of this notice.


From Mumbai, Ahmedabad,
                              Pune, Jaipur, Bengaluru and
                              Indore.

Zee Living                      Shirpur Gold Refinery
Guide to natural living and     Asias largest gold refinery
wellness.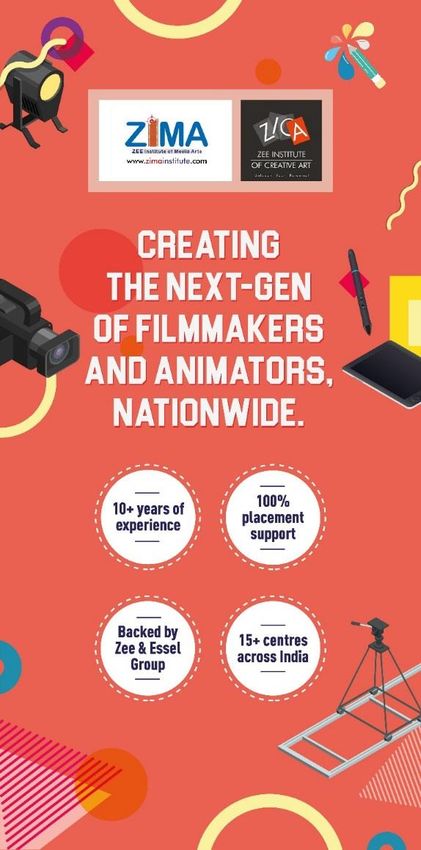
Sector
         Overview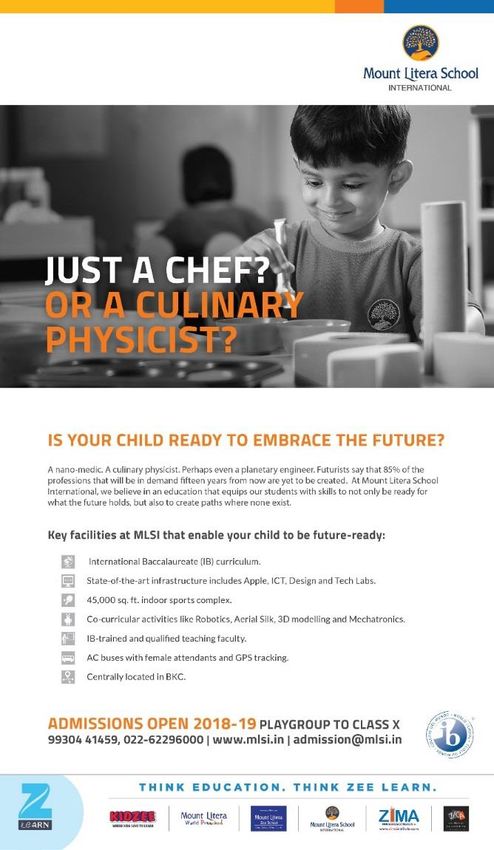
Sector Overview: Indian Education

                                                         EDUCATION SPEND 2020
                                                     E Learning, 3%
                                                                         Stationery, 3%
                        Test Preparation, 10%
                                                                                Others, 1%

               Tutoring, 11%
                                                                                                                                       K12, 48%

       Teacher Training, 1%

            Vocational Training, 2%

                         Higher Education, 18%

                                                                            Preschool, 3%
                              Public and Private spends on education – US$ 100 bn; set to grow to US$ 180 bn by 2020.
                                     Private spends on education – US$ 45 bn; set to grow to US$ 90 bn by 2020

                                                                                       Source: Anand Rathi Research, 2012, Indian Brand Equity Foundation 2015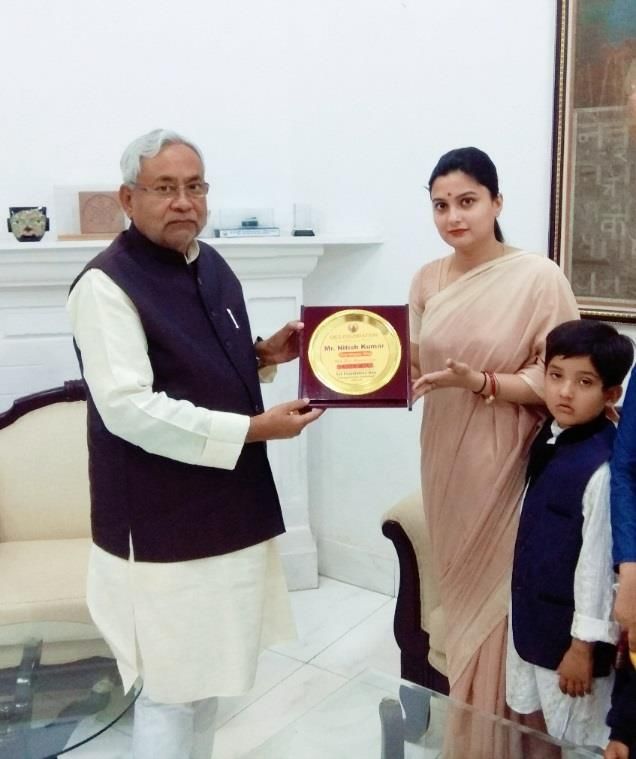
Indian Education Sector
  India’s education sector is expected to reach US$ 180 bn by 2020.

   – Growing in double digits over the last 5 years; Expected to grow by CAGR of 16% till 2020.

   – Age Bracket 0-34 has c. 60% of total population of the country. Current 0.8 Bn people in this segment to become 1.2 Bn by
      2030.

   – Second largest market for e-learning after the US. Online education users expected to reach 9.6 million by 2021 from 1.6
      million in 2016.

   – Digital education expected to grow at CAGR 50%+ for next 3-5 years

   – Indians have high focus on Education. Average urban spend on education is about 9% of the total household income (2012).

   – With median income elasticity of demand for education nearly 2, a 1% rise in per capita income leads to nearly 2% rise in
      spends on education
   – Government focus :
        • Budget outlay increased to Rs. 85,000 Cr in FY19; up by 6.7 %
        • New initiatives in Vocational, Skilling and ICT training
        • Intends to raise the spend to 6 % of GDP from the current 3.5 %

                               Fast growing Learner base. High Govt Focus. Increasing Digitization

                                                                             Source: Anand Rathi Research, 2012, Indian Brand Equity Foundation 2015
Sector Overview: Pre-school
Market
– Current Market Size: US$ 2 Bn ; Expected Market size by 2022 - US$ 5 Bn
– Expected to grow at a CAGR of 23% by 2022
– Low penetration of pre-schooling in India
Gross Enrollment Ratio of 10.9% at all India level as compared to 100% in France or Scotland
Only 1.4 mn children out of 13 mn preschool aged children currently attend a preschool
– With growing awareness among tier 2 / 3 cities, penetration rate for the pre school segment expected to rise to 25%
– Branded Pre-school segment is expected to contribute 33.83% to the total Pre-school industry in India.
Growth Drivers
– Increased propensity to spend on quality education / Rising urbanization / Demand Vs supply gap
– Increase in Consumer disposable Income / affordability
– Propensity of both parents working is on the increase
– Substantial improvement in the quality of pre-schools
– Ease of entering the segment and low investment
Huge potential. Urbanization driving growth.
Source: Anand Rathi Research, 2012, Indian Brand Equity Foundation 2015Sector Overview : K-12 Schools
Market
– Market Size for private player is US$ 13.44 Bn
– Expected Market by 2020 would be US$ 31.7 Bn; Expected CAGR 19%
– Online learning in Indian education system has changed its scenario, with its reach and economical access. For
EduTech , sector is emerging out to be a year full of innovative methods of imparting education.
– Byju’s, the mobile learning startup, is expecting a billion dollar valuation, on the back of increasing use of the app by
students. c. 400,000 students are using the app currently, ranging from K-12 students to students preparing for
competitive exams.
Growth Drivers
– With growing awareness private Indian players are collaborating with International brands to provide International
standard quality education.
– Increased propensity to spend on quality education / Rising urbanization / Demand Vs supply gap / Increase in
Consumer disposable Income /affordability
– Private sector growth at a faster pace as they are perceived to be better than Govt schools
Biggest segment. Private sector growing faster.
Source: Anand Rathi Research, 2012, Indian Brand Equity Foundation 2015Sector Overview : Vocational Education / Skill development
Market Size
• 2014 Market Size US$ 1.35 Bn
• Estimated market size in 2020 – US$ 5.1 Bn
Growth Drivers
– Inefficient public education system lacking employability skills based education
– At present, only 10% of the Indian workforce is receiving skill enhancement training as compared to 96% in
Korea and 80% in Japan.
– Demand for skilled workforce increasing with growth in service sector
– GOI has estimated 20 sectors that face a skilled manpower shortage of 347 mn people over the next 10 years
– GOI plans to make skill certification mandatory for public sector jobs soon.
– Private equity players have become bullish on the fast growing education sector including vocational and
supplementary training
– With rising internet penetration, vocational training companies are selecting the online channel to offer
courses reach nationally.
Huge Govt push. Ensuring Education with Employability.
Source: Anand Rathi Research, 2012, Indian Brand Equity Foundation 2015Sector Overview : Test Preparation and Tutoring
Market Size
• Test preparation market size – 2012 Estimates ranging from US$ 3.75 Bn to US$ 4.8 Bn
• Estimated market size in 2020 – US$ 11.27 Bn
• Tutoring market size – US$ 3.1 Bn (2012)
• Estimated market size in 2020 – US$ 9 Bn
Growth Drivers
– Low capital requirement
– High margins
– High usage amongst target audience
– Highly competitive education landscape
Increasing competition driving growth
Source: Anand Rathi Research, 2012, Indian Brand Equity Foundation 2015Sector Overview : Teacher Training / ICT / Education Process Outsourcing (EPO)
Market Size
– Current Market Size of teacher training is Negligible
– Expected Market by 2020 ~ US$ 406 Mn
– Of c.4 million classrooms in India, only 0.15Mn are ICT enabled.
– World wide Education Process Outsourcing (EPO)market size is estimated to be US$ 12 Bn in a few years.
Growth Drivers
– Teacher Training - Growing unmet need of good quality teachers by Private schools. Government and private
schools require 6.0mn more teachers by 2020.
– ICT - Large Government initiatives to introduce ICT in government schools.
– EPO - The shortfall in quality Mathematics, English and Science home tutors in the United States, Canada,
the Middle-East, North Africa, Australia and New Zealand and the abundant number available in India
Source: Anand Rathi Research, 2012, Indian Brand Equity Foundation 2015Sector Overview : Training & Manpower
Market Size
– Rs.20,000 Cr Market, with 2% penetration of the possible employable size in India. Projected to touch Rs. 60,000 Cr by
2018.
– Sectors with high demand for skilled manpower
• construction, retail, beauty & wellness, textile, tourism & hospitality, Banking & Financial Services Institutions.
– Over a period of next 5 years, flexi-staffing industry expected to grow at 25-30% CAGR
– While USA and EU are matured markets globally, China & India coming up as the fastest growing markets.
Growth Drivers
– Focus on keeping cost base low & increase efficiency to manage scale.
– Flexibility requirement for Project linked hiring
– Different strategy for secondary manpower encompassing speed of recruitment, quick backfill and offloading HR /
admin complexities
– Improving productivity of the organization
Huge potential. Corporates want to focus on their core business.
Source: Anand Rathi Research, 2012, Indian Brand Equity Foundation 2015About
Zee LearnZee Learn Ltd: Evolution / Journey
2018
2017 Entered into Manpower &
Training vertical through
2014 ‘Liberium’
Company owned company
2012 operated Kidzee centers /K-
12 schools
2011
2010
2008
2006
2004
2003
1994Zee Learn – A diversified entity
Asia’s largest preschool An international
- 1800+ centers standard pre-school
- 135,000 + kids at Mumbai
-700+ cities
India’s fastest growing An IB school of global
network standards at BKC Mumbai
- 120 + schools
- 52,000 + kids
- across 110+ cities
ZICA is the nation’s first Courses in Film Making,
full-fledged Classical Television, Music,
and Digital Animation Radio, Journalism with
Training Academy with centers in Mumbai,
18 centers across India Noida and Jaipur
Innovative workforce Inculcating reading,
solutions for business musical, mathematical,
requirements of analytical and
organizations. technology skills to give
a child the smart edge.
Students ~250,000 Cities ~750+ Centers / Schools ~2000+Investment Rationale in MT Educare
A strong brand name in coaching vertical with a wide reach
A scalable and sustainable model with minimum capex – asset light
Includes a modular digital offering (“Robomate”) with strong student pull – Robomate enhances the product offering and
facilitates the student’s grasp of content and concepts
All downsides factored in:
The Company has already taken a financial hit due to technology infusion (introduction of Robomate)
The company is now poised to ride the upside of the strategic moves, making it a solid turnaround story
One time adjustment of ~ Rs. 169 Cr in FY18 :
• On conservative basis and to align with Ind AS towards delayed receivables and some loans and advances
given to Trusts
• Govt receivables have a long recovery cycle but low risk of bad debts / non recovery & therefore some part
of the same may be received in future upon completion of Govt. Projects.
Synergies with Zee LearnBusiness Synergies
Zee Learn Limited
– Access to high level digitalised content (through ROBOMATE) for standard IX – XII of MT for Zee Learn’s students
– K-12 students of MLZS will have access to quality test prep for professional courses
– Entry into the Government business of skill development
– Access to trained manpower pool through MT Educare’s Government vocational business.
MT Educare Ltd
– Zee Learn’s Mount Litera Zee School students of standard IX – XII will be potential target for MT
– Geographical expansion opportunity by utilizing presence of Zee Learn pan India in 700 cities
– MT can expand through franchising by approaching ~2,000 franchise partners of Zee Learn
– People trained by MT Educare for Government vocational may be placed via Librium (Training and Manpower subsidiary of ZLL)
into corporates’.
– Access to Essel / ZEE Group’s management and financial strength.
Combined
– Senior management and operating cost synergies
– Best practises of ZLL can be implemented to increase the efficiencies in MT EducareConsolidated Brands
Footprint
Life cycleCombined Strong Established Brands
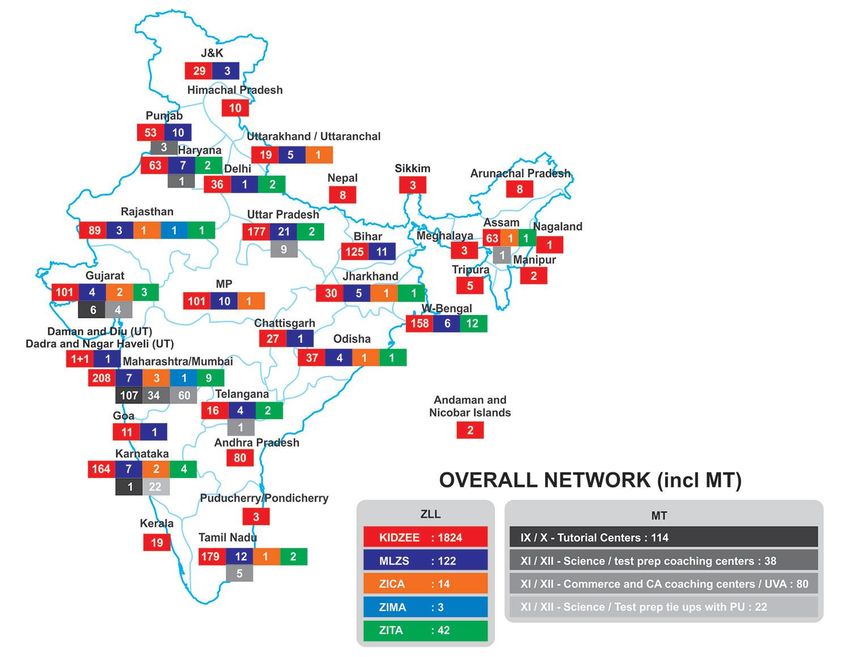
Combined Network Strength – Zee Learn and MT Educare
Addressing the full Student Life Cycle
 Pre School (2 - 6 yrs) (Asia’s
  largest chain with 1800 schools in
              700+ cities)

                K-12
            (7 – 16 yrs)
(Fastest growing K-12 school chain - 115     Tutorial (8-
          schools in 90 cities)
                                               18 yrs)
                                           (Coaching for school
                                                                      Test Prep.
                                                children)
                                                                     (14-24 yrs)
                                                                     (Test prep. for       Vocational                Vocational
                                                                  professional courses)   B to G (16 -24               B to C
                                                                                               yrs)                   (16-24 yrs)
University (17-24 yrs)
   (Prestigious UGC approved Private
     state university in North India)                                                       (Leading player in
                                                                                                                     (Leading player in
         # Not part of Zee Learn                                                           providing vocational
                                                                                                                    providing vocational
                                                                                          training through govt.
                                                                                                                     training in media/
                                                                                                entities)          journalism/animation
  Training and Manpower (24
                                                                                                                        /graphics)
             + yrs)
   (Innovative workforce solutions for
        business requirements of
             organizations.
Zee Learn Ltd: Overview
– Revenue grown at a CAGR of 22% from FY13 to FY18 i.e. Rs.101 Cr to Rs. 269 Cr (consolidated)
– Consolidated EBITDA for FY18 at Rs.102 Cr, surpassed FY13 consolidated Revenue of FY13 of Rs.101 Cr.
– Largest pre school chain in India with 1,800+ operational centers
– Kidzee (Pre-School) business growing at a CAGR of 20% from FY13 till FY18
– MLZS with 120+ operational schools is one of the fastest growing school chains
– MLZS (K-12) business growing at a CAGR of 13% from FY13 till FY18
– Zee Learn has presence in more than 700 cities in India which constitute 25% of the cities of the country
With its brands well established and widely accepted, ZLL is all set to capitalise on the growth of the education sector and tap the huge
opportunityZee Learn Ltd: Business Indicators
Number of Kidzee Franchisee Centers Revenue - Kidzee ( Rs.in Mn)
2000 1,400 1,318
1813
1800 1725
1563 1,200 1,125
1600 1,009
1347 1,000
1400 872
1173
1200 800
667
1000 908
600 532
800
600 400
400
200
200
0 -
FY13 FY14 FY15 FY16 FY17 FY18 FY13 FY14 FY15 FY16 FY17 FY18
CAGR 15% CAGR 20%
Number of MLZS Schools Revenue - MLZS ( Rs.in Mn)
140 450
117 372 385
400
120 110
334
98 350
100 89
81 300
80 234
250 208 215
61
60 200
150
40
100
20 50
0 -
FY13 FY14 FY15 FY16 FY17 FY18 FY13 FY14 FY15 FY16 FY17 FY18
CAGR 14% CAGR 13%Zee Learn Ltd: Business segments and strengths
Business Services Strengths Competition
model
• Franchise • Pedagogy , Curriculum & Content • R & D team of 60+ members with constant • Euro Kids (c. 900
• COCO • Teacher Training focus on pedagogy , curriculum design, centres)
• Marketing & Academic Centre audits content creation • Bachpan (c. 1000
KIDZEE • Parenting Programs & Seminars • Flexible pedagogy iLLUME to observe centres)
children on pre-defined parameters and
identify the preferred learning sty le
• Franchise • Curriculum - Blended Learning Designs • State-of-the-art infrastructure • DPS (c. 210
• School integrated w ith digital content •Contemporary learning & teaching methods centres)
Management • Teacher Training •Well-researched proprietary content • Ryan
MLZS Contract • Marketing & Academic audits •Dev eloped an Integrated education model International (c.
• Parenting Programs & Seminars 'Litera Octave which facilitates deeper 120 centres)
• Affiliation with CBSE Board concept understanding
• Franchise • Assists in Placements •Arena (c. 300+
• COCO • Faculty training centres)
ZICA • 2D/3D animation trainings • Frame Box(c.
• Marketing support •Mix of degrees, diplomas and C.85 centres)
certificate courses
• Plethora of options for both fresh
•Assists in Placements graduates and professionals •Digital Academy
• COCO • Faculty training •Whistling woods
ZIMA • Marketing support
• Diploma courses in Direction,
Acting, Sound, Editing, etcZee Learn’s Strategic Growth Levers for existing businesses
Best In Class Student Best In Class Product
Largest Foot Print experience Portfolio
• Average new signups c.350 Pre- • Content is developed on our belief • This helps in Increasing share of
Schools and c.16 K-12 YoY that every child is unique & wallet per customer by leveraging
• Business model allows: different children learn differently. existing relationships with business
-Faster scale up of operations • Developed digital content in house partners resulting in higher
-Increased geographical and activity based learning Revenue per center/school.
penetration (currently present program that provides multiple • Partnerships for creating or sourcing
in about 20% cities across pathways to learn for children. differentiated Best In Class products
India • Integrated Parenting Curriculum from across the world strongly
-Enhanced control on the empowers parents to facilitate aligned with Indian Curriculum.
service delivery levels for child development in the right
desired outcomes mannerGrowth Opportunities for Zee Learn
Kidzee
– Average enrollment per Kidzee centre is c.75, against full capacity of c.150 per centre (one and half shift)
– With Kidzee as the largest Preschool chain in India spread c.700 cities, ZLL is quite poised to tap on this opportunity
MLZS
– Average enrollment per MLZS is c.550, against full capacity of c.1000 per school
– With MLZS amongst the fastest growing brand in K-12 segment with its footprint in c.110 cities, we are present to make a
major impact in this field
Vocational
– B2C - Making students job ready for fields like Media, Education, wellness, gems & jewellery
– B2B - Training existing and potential employees of client organizations in fields like – banking, retail, telecom etc.
Teacher Training / ICT / EPO
– Establish teacher training colleges and institutes
– Plans to bid for government schools for providing Information and Communication Technology (ICT) education platform
– Plans to enter EPO segment by providing solutions for process outsourcing and remote tutoring and class room support to
overseas students
29Zee Learn
SubsidiariesDigital Ventures Pvt. Ltd- 100% subsidiary
DVPL is engaged in owning, developing and leasing the school infrastructure and ancillary assets required in educational business
Sr. Locations Area Peak Student School Status for Facilities
No. Capacity Academic Year 2018
1 Bhatinda Spread across 8 acres - appx. c.1800 Upto Class 10 Multipurpose Hall, Sports ground, Science Lab, Computer Lab, Art and Music rooms,
1,33,000 sq.ft. built up swimming pool, tennis court
Land taken on long term lease
2 Nagpur Spread across 7.8 acres - appx. c.1800 Upto Class 10 Multipurpose Hall, Sports ground, Science Lab, Computer Lab, Art and Music rooms,
1,25,000 sq.ft. built up swimming pool, tennis court
Land taken on long term lease
3 Patiala Spread across 5.73 acres - appx. c.1800 Upto Class 10 Multipurpose Hall, Sports ground, Science Lab, Computer Lab, Art and Music rooms,
1,25,000 sq.ft. built up swimming pool, tennis court
Land taken on long term lease
4 Karnal Spread across 5.48 acres - appx. c.1800 Class 10 affiliation Multipurpose Hall, Sports ground, Science Lab, Computer Lab, Art and Music rooms,
1,25,000 sq.ft. built up applied swimming pool, tennis court
Land taken on long term lease
5 Goa Spread across 5 acres appx. c.1800 Upto Class 12 Multipurpose Hall, Sports ground, Science Lab, Computer Lab, Art and Music rooms,
1,35,000 sq.ft. built up swimming pool, tennis court
Own Land
6 Mumbai Spread across 1.45 acres – appx. 274,000 c.1376 Upto Class 10 Basket ball court, badminton court, yoga room, gymnastics room, squash court, table
Sq ft. built up tennis room, mini soccer field and outdoor play area, wifi campus, multi-media library,
Land taken on long term lease PYP and MYP music and activity room, ICT and science lab, preview theater, ergonomically designed
approved (Candidate furniture, state of art class rooms, ipad/tablet enabled class room lectures
school for DP)
All schools are affiliated/in process with CBSE except for Mumbai school which is affiliated to International Baccalaureate (IB)
31Liberium – A new initiative
Why How What
Pre-industry Training
Abundance of employment Prospective employees need ZLL is creating an ecosystem
Ongoing Mentoring
seekers, but lack of job relevant training to be around training jobseekers to
Correct Selection
employability. Employers specially skilled & become make them employable while
Deployment
today need job ready productive to the employers providing fit to purpose solutions
Upscaling
employees. they work for. to employers.
Purpose Human Resource solutions and allied services | Train & Deploy models | Value added services
• Business to business model to cater to corporates
• People management initiative
• Train jobseekers to make them job ready
• Help corporates in sourcing talent, deployment, skilling
• Managing the entire life cycle of their contingent workforce on a fit to purpose model
Segment Leader: Team Lease - A listed company : 1.6 lakhs headcount; FY18: Revenue ₹3,441 Cr; PAT ₹73 Cr (PAT : 2.1%)
Sectors with high demand for skilled manpower – Construction, retail, beauty & wellness, textile, tourism & hospitality, banking & financial
servicesFinancial
HighlightsFinancial Overview : FY 2018
Consol EBITDA crosses Rs.1000 Mn for the first time in FY18
Consol EBITDA for FY18 at Rs. 1021 Mn surpassed FY13 Consol Revenue of Rs. 1008 Mn.
FY18 Consol Revenue up by 49% and PBT up by 133% over FY17
Highlights of Q4 FY18 performance on consolidated basis:
• Operating Revenue for Q4 FY18 at Rs. 898 Mn up by 34% from Rs. 669 Mn
• Operating EBITDA for Q4 FY18 at Rs. 361 Mn up by 81% from Rs. 199 Mn
• PBT for Q4 FY18 at Rs. 277 Mn up by 102% from Rs. 137 Mn
Highlights of FY18 performance on consolidated basis:
• Operating Revenue for FY18 at Rs. 2688 Mn up by 49% from Rs. 1805 Mn
• Operating EBITDA for FY18 at Rs. 1021 Mn up by 73% from Rs. 591 Mn
• PBT for FY18 at Rs. 756 Mn up by 133% from Rs. 324 Mn
• PAT for FY18 at Rs. 493 Mn up by 47% from Rs. 335 Mn
Other Financial Highlights of FY18 :
• Revenue grew with a CAGR of 22% and EBIDTA by 70% from 2014 till 2018.
• Consolidated Debts as at 2018 are Rs.2573.70 Mn
• Free Cash Flow improved from Rs.47.60 Mn in FY15 to Rs.649.84 Mn in 2018.Financial Performance
Rs.Mn
3,000
2,688
2,500
2,000 1,805
1,513
1,500 1,213 1,278
1,008 1,022
1,000
686
431
500 305
(78) 122
-
Fy13 Fy14 Fy15 Fy16 Fy17 Fy18
(500)
Revenue EBIDTA
Over last 4 years - 22 % CAGR in Topline and 70 % CAGR in EBITDA
High Operating Leverage at playRevenue –FY 2018
Manpower (Figures in graph in Rs. Mn)
and
Recruitment
(529)
20%
Preschool
Lease Rentals (1,319)
(296) 49%
11%
Vocational
(39)
1%
K12 (385)
19%
Total Revenue: Rs. 2,688 mnFinancial Results – Consolidated (Q4 FY 2018)
Rs in Mn
Consolidated
Particulars Q4 FY 2018 Q4 FY 2017 Q by Q Growth FY 2018 FY 2017 FY by FY Growth
Revenue from Educational Services / Activities 675.6 599.5 13% 1,863.4 1,604.8 16%
Revenue from Construction / Leasing Activity (For Education) 86.5 69.1 25% 295.7 200.1 48%
Manpower & Training Activity 135.7 - 529.3 -
Total Revenue 897.7 668.6 34% 2,688.4 1,804.9 49%
Total Direct Expenses 189.4 139.6 36% 450.7 353.8 27%
Gross Margin 708.4 528.9 34% 2,237.7 1,451.1 54%
Personnel Cost 201.9 49.4 309% 782.9 293.9 166%
Administrative Cost 92.2 202.2 -54% 271.6 369.3 -26%
Selling and Marketing Cost 53.7 77.9 -31% 162.4 196.6 -17%
Total 347.8 329.5 6% 1,216.9 859.8 42%
EBITDA 360.6 199.4 81% 1,020.8 591.3 73%
EBITDA % 40% 30% 38% 33%
Other Income 9.8 11.3 -2% 37.0 37.9 -2%
Interest Cost 66.4 54.6 -2% 191.1 207.2 -2%
Depreciation 26.8 19.0 -2% 111.2 98.0 -2%
PBT 277.2 137.2 102% 755.6 324.1 133%
PBT % 31% 21% 28% 18%
Tax 102.9 -36.1 -2% 262.8 -11.0 -2%
PAT 174.3 173.2 1% 492.8 335.2 47%
PAT % 19% 26% 18% 19%
For FY18, Consolidated Revenue up by 49% at Rs.2688.4 Mn, EBITDA up by 73% at Rs.1020.8, PAT up by 47% at Rs.492.8 Mn
For Q4 FY18, Consolidated Revenue up by 34% at Rs.897.7 Mn, EBITDA up by 81% at Rs.360.6.
37Consolidated P&L – March 2018
Rs. in Mn
Consolidated P&L – March 2018
IND AS / Con
Particulars ZLL DVPL AEPL Liberium Adj Consol
Revenue from Operations 1,863 296 535 (6) 2,688
Total Revenue 1,863 296 - 535 (6) 2,688
Total Direct Expenses 451 - 451
Gross Margin 1,413 296 - 535 (6) 2,238
Personnel Cost 287 4 502 (6) 788
Admn, Selling and Marketing Cost 404 27 0 12 (14) 429
Total 691 31 0 515 (20) 1,217
EBITDA 722 265 (0) 20 14 1,021
EBITDA % 39% 90% 4% -245% 38%
Other Income 157 17 0 (137) 37
Interest Cost 134 181 0 0 (123) 191
Depreciation 31 80 - - 111
PBT 714 22 (0) 20 - 756
PBT % 38% 7% 4% 0% 28%
Tax 256 - - 7 - 263
PAT 458 22 (0) 14 - 493
PAT % 25% 7% 3% 0% 18%Growth
PotentialThe Quantum Leap
Building Blocks - Preschool Network

          Operational Schools                       Enrollments
 4,000                                3,50,000
                            3,530
 3,500                                3,00,000                    2,86,895
 3,000
                                      2,50,000
 2,500
                                      2,00,000
 2,000     1,824
                                      1,50,000   1,35,272
 1,500
                                      1,00,000
 1,000

  500                                  50,000

    0                                       0
          FY18(A)          FY23(P)               FY18(A)          FY23(P)
Building Blocks – K-12 Franchisee Network
Operational Schools Enrollments
250 4,00,000
3,75,000
204 3,50,000
3,25,000
3,15,327
200
3,00,000
2,75,000
150 2,50,000
122 2,25,000
2,00,000
1,75,000
100 1,50,000
1,25,000
1,00,000
50 75,000 52,237
50,000
25,000
0 0
FY18(A) FY23(P) FY18(A) FY23(P)Building Blocks – Vocational centres
Operational ZICA Franchise Centers Enrollments -ZICA Franchise
50 47 Centers
45 7,500 7,175
7,000
40 6,500
35 6,000
5,500
30 5,000
4,500
25 21 4,000
20 3,500
3,000
15 2,500
2,000
10 1,500
5 1,000 562
500
0 0
FY18(A) FY23(P) FY18(A) FY23(P)Building Blocks – Teacher Training centres
Operational Teacher Training Enrollments - Teacher Training
Centers Course
300 283 40,000
35,375
35,000
250
30,000
200
25,000
150 20,000
15,000
100
10,000
50
42
5,000
260
0 0
FY18(A) FY23(P) FY18(A) FY23(P)Growth Potential: Zee Learn Consolidated
Organic and In-organic Business
Rs. Million
FY18 FY23 - Projections
Particulars Actual Organic In-organic Total
Total Revenue 2,688 19,500-19,600 18,350-18,400 37,850-38,000
EBITDA 1,020 7,470-7,530 5,300-5,350 12770-12,880
EBITDA % 38% 37%-38% 28%-29% 33%-34%
Key Financial Ratios – On Organic Business
Rs. Million
FY18
Key Ratios Actual
* EV/EBIDTA 13.46
DEBT/EQUITY (D/E) 0.63
* PRICE/EARNINGS (P/E) 23.32
RETURN ON EQUITY (ROE) 14.0%
RETURN ON CAPITAL EMPLOYED (ROCE) 17.7%
1. The above projections of FY23 are without minority interest.
2. Share Price as on 31 St March 2018 has been considered for calculation purposeAwards
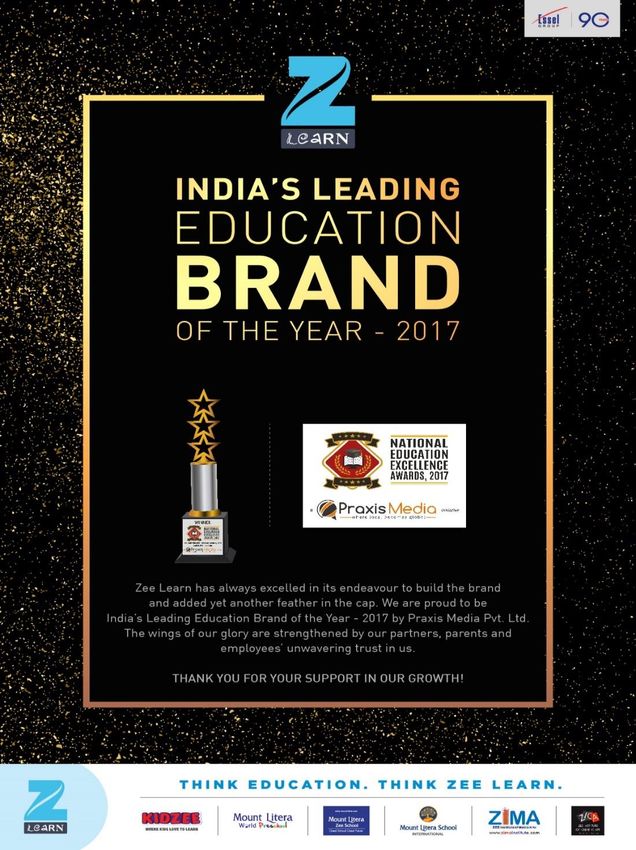
RecognitionINDUSTRY RECOGNITION 2017
Preschool
Franchisor of the Franchisor of the
Brand Excellence
Year - Jury’s Choice Year – Preschools
Award for Education
By by
By
BusinessWorld Franchise India
World Marketing
Education Awards
Congress
India’s Most
Attractive Brand - International School Excellence in Omni-
Preschools Award 2017 – 2020 Experience App
by by by
Trust Research The British Council IDC Insight Award
AdvisoryMarketing & PR Campaign
PRINT CAMPAIGNS
PRINT CAMPAIGNS
I Care Outreach 2017-18
           Workshops with parents to create a buzz for an abuse-free society for children

                             Particulars                     Details
                    No. of Workshops conducted                 607
                 No. of Parent seminars conducted             1390
                  Parents touched by the initiative           90,350                  ‘Beti Bachao Beti Padhao’ and “Sukanya Samridhi Yojana
                                                                                      campaign year on year across all its centres.”

                  Recognized by the Honorable Chief
                  Minister of Bihar, Shri Nitish Kumar                         Appreciation from the Honorable Governor of Bihar Shri Satya Pal Malik
DIGITAL OUTREACH
Brand building | Lead Generation | SEO | SEM |
Website Management | Reputation Management |
Social Media Marketing | Content Marketing
Content Marketing Website Search- organic &paid
Paid media + Affiliate Reputation management Social media
marketingSOCIAL MEDIA CONNECT
#MyFoodieTale #ParentingTips
Branded
#BookThatTaughtUsRationale for Investment in Zee Learn Ltd
Asia’s Largest Pre School chain and India’s fastest growing K-12 school
chain
Post acquisition of MT Educare, Zee Learn would be leading player operating in
various domains of Education system in India. i.e. pre-school/K-
12/Vocational/Tutorials/Test Prep in India through its strong network and
Brand strength.
Flexible and sustainable business model. With Librium and MT Educare strong
presence in growing sector of Manpower & Training and Informal Education /
Test Prep & Skilling
Future Free Cash Flow will enable to retire existing debts and surplus will be
available for Business Growth and distribution to stakeholders
Potential to grow Revenue, organically and inorganically by 14x and EBITDA by
12x by 2023Way Forward
• Hive off asset base of school properties either through REIT or sale.
• Launch of Day Care centres and Mother / Toddler programs
• New Brands to cater to different demographic segments
• To tap corporate pay preschool segment
• Increase point of presence through tie-ups with builder, smart/small
cities, industrial units etc.
• Strengthening B2C vocational business segment by offering courses
in design, languages etc.
• Acquisition of sizable Pre-School / School chain
• Geographical Expansion to achieve Pan India presence
• Building up the Franchisee network
• New sub-verticals to be added in test prep / tutoring
• Acquisition of sizable test prep and tutoring chain
• Leverage Robomate for global expansion
• Strengthen Govt vocational forayYou can also read