Connectivity Broadband market developments in the EU - Europe's Digital Progress Report 2017 - Europa ...
←
→
Page content transcription
If your browser does not render page correctly, please read the page content below
Connectivity
Broadband market developments in the EU

              Europe's Digital Progress
                   Report 2017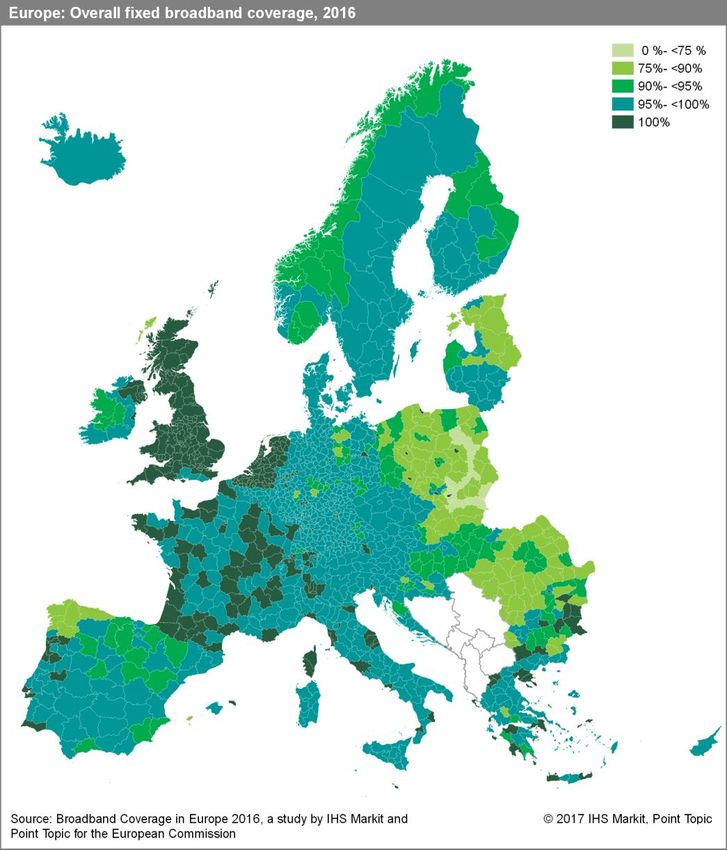
The Digital Economy and Society Index (DESI) is a composite index that summarises relevant
indicators on Europe’s digital performance and tracks the progress of EU Member States in
digital competitiveness.

                                                                                 The five dimensions of the DESI
                                                                                 1 Connectivity     Fixed Broadband, Mobile Broadband, Broadband speed
Denmark, Finland, Sweden and the Netherlands have the most                                          and prices
advanced digital economies in the EU followed by Luxembourg,                     2 Human Capital Basic Skills and Internet Use, Advanced skills and
Belgium, the UK and Ireland.                                                                        Development
                                                                                 3 Use of Internet Citizens' use of Content, Communication and Online
Whereas, Romania, Bulgaria, Greece and Italy have the lowest                                        Transactions
scores on the index.                                                             4 Integration of   Business digitisation and eCommerce
                                                                                 Digital Technology
                                                                                 5 Digital Public   eGovernment
                                                                                 Services

                                                   Digital Economy and Society Index (DESI) 2017 ranking
  0.80
              1 Connectivity         2 Human Capital         3 Use of Internet         4 Integration of Digital Technology        5 Digital Public Services
  0.70

  0.60

  0.50

  0.40

  0.30

  0.20

  0.10

  0.00
         DK   FI   SE   NL     LU   BE   UK   IE   EE   AT   DE MT     LT   ES    PT   EU    FR   SI    CZ   LV    SK   HU   CY   PL    HR    IT   EL    BG   RO

   Europe's Digital Progress Report 2017 – Connectivity                                                                 2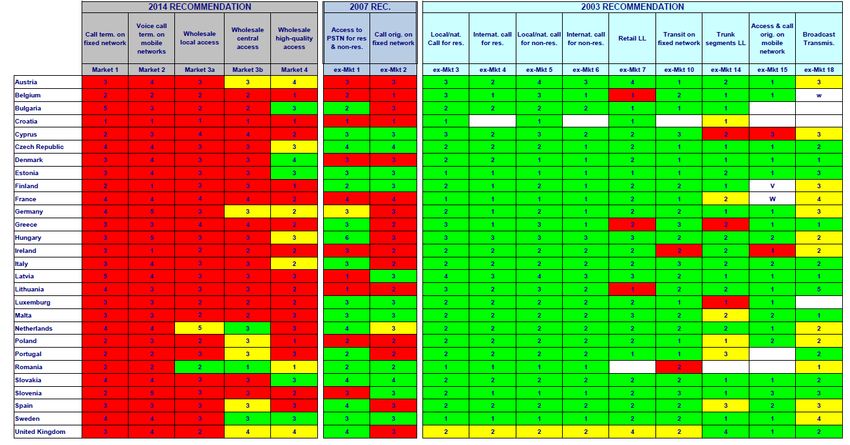
As for Connectivity, the highest score was registered by the Netherlands followed by
Luxembourg and Belgium. Croatia, Bulgaria and Poland had the weakest performance in this
dimension of the DESI.
The Connectivity score looks at both the demand and the supply side of                 Connectivity Indicators in DESI 2017                                        EU
fixed and mobile broadband. Under fixed broadband it assesses the                      1a1 Fixed Broadband Coverage                                               98%
availability as well as the take-up of basic and high-speed next-generation            % households                                                               2016
                                                                                       1a2 Fixed Broadband Take-up                                                74%
access (NGA) broadband and also considers the affordability of retail                  % households                                                               2016
offers. On mobile broadband, the availability of 4G, radio spectrum and                1b1 Mobile Broadband Take-up                                                  84
the take-up of mobile broadband are included.                                          Subscriptions per 100 people                                             June 2016
                                                                                       1b2 4G coverage                                                            84%
A comparative assessment of fixed broadband across countries shows                     % households (average of operators)                                        2016
Luxembourg, Netherlands and the UK as the strongest performers. In                     1b3 Spectrum                                                               68%
contrast, Poland, Romania, Slovakia and Latvia are shown to be among                   % of the target                                                            2016

the weakest performers. NGA subscriptions are particularly advanced in                 1c1 NGA Coverage                                                           76%
                                                                                       % households                                                               2016
Belgium, Romania, the Netherlands and Portugal.                                        1c2 Subscriptions to Fast Broadband                                        37%
As for mobile broadband, the Nordic countries (Finland, Sweden and                     % subscriptions >= 30Mbps                                                June 2016
Denmark) lead Europe along with Estonia and Poland, while the lowest                   1d1 Fixed Broadband Price                                                  1.2%
                                                                                       % income                                                                 price 2016,
scores were registered by Bulgaria, Malta and Croatia.                                                                                                         income 2015

                                              Digital Economy and Society Index (DESI) 2017, Connectivity
    0.9
                         1a Fixed Broadband                  1b Mobile Broadband                       1c Speed                        1d Affordability
    0.8
    0.7
    0.6
    0.5
    0.4
    0.3
    0.2
    0.1
      0
          NL   LU   BE    DK   SE   UK   DE     LT   MT PT   IE   FI   LV     HU AT   EU   CZ     EE     ES   SI      FR     CY   RO    SK    IT   PL     BG    EL        HR

   Europe's Digital Progress Report 2017 – Connectivity                                                                      3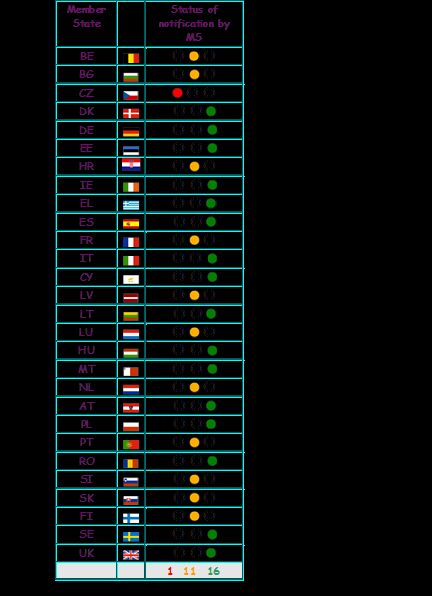
Total telecom services revenues have declined by 6 % in Europe since 2013. Mobile and fixed
voice revenues have decreased by 23 % since 2013. An increase in mobile data and internet
services was not enough to offset the major decline in voice services.
                                                                                   Total Telecommunication revenues per region, billion €, 2013-2017
 Telecom operators in Europe generated less revenue than the                350
 US operators. Revenues went down from EUR 233 bn in 2013                   300
 to EUR 220 bn in 2016 in Europe. At the same time, the US                  250
 revenues also slightly declined from EUR 308 bn to EUR 295                 200
 bn, which is higher than Europe despite its smaller population.            150
                                                                            100
 Note: this analysis is based on detailed figures from 26 Member States,     50
 which covered about 98% of the total EU market (total telecom carrier
                                                                              0
 services).
                                                                                       2013            2014           2015         2016         Forecast 2017
                                                                                                EU26      JAPAN        CHINA       US         Brazil

                                                                                   European telecommunications revenues by segment, % of total,
Analysis of telecommunications revenues (carrier services) by
                                                                                                          2013 - 2017
segment shows a decline in voice services (both fixed and mobile)          100%
revenues. Fixed voice services have fallen by 15.3 % since 2013,                                       26%             23%              22%             21%
                                                                                       28%
compared to 29.9 % for mobile services over the same period.               80%
Together, fixed and mobile voice services will represent 48 % of total                                                                                  27%
                                                                                                                       25%              26%
telecom revenues in 2017, compared with 54 % in 2013.                      60%         22%             23%

Mobile data services will represent 27% of total revenues, up from 22                                  18%             19%              20%
                                                                           40%         17%                                                              21%
% in 2013. The growth in mobile data services could not, however,
compensate for the major decline in voice services.
                                                                           20%         26%             26%             25%              25%             24%
Note: this analysis is based on figures from 7 Member States, Belgium,      0%          7%              7%              7%              7%               7%
France, Germany, Italy, Spain, Greece, Spain and the UK, which covered                 2013            2014            2015             2016            2017
about 70% of the total EU market (total telecom carrier services).
                                                                             Business data services       Fixed voice telephony         Internet access and services
Source: 2016 EITO in collaboration with IDC.                                 Mobile data services         Mobile voice telephony

    Europe's Digital Progress Report 2017 – Connectivity                                                          4
In 2016, M&A activity among European telco operators decreased, especially when it comes to
in-market consolidation. In-market consolidation of large networks continued to raise
competition concerns, unlike the combination of large mobile and fixed networks.
Unlike in 2014 and 2015, no large-scale mergers were agreed in
2016 which would have led to the integration of large networks in
the same market. Whilst Orange and Bouygues were in talks for
an acquisition of Bouygues, no agreement has been reached.
The largest telco merger announced in 2016 was the merging of
Vodafone`s and Liberty Global`s Dutch operations, creating a
converged fixed-mobile player. In Spain, Masmovil, a fixed and
virtual mobile operator, acquired the smallest mobile network,
Yoigo. With this acquisition it becomes the fourth fixed-mobile
player in a market characterised by a high level of fixed-mobile
convergence. In Italy, Enel Open Fibre acquired joint control over
Metroweb - both provide wholesale broadband access services
through fiber networks.
The European Commission continued to identify competition
concerns stemming from the combination of large networks in the
same markets (prohibition of Hutchison`s proposed acquisition of
O2 in the UK and approval of Hutchison/VimpelCom JV in Italy
conditional on the divestment of sufficient assets that will allow a
new operator to enter the market).
However, no competition concerns were raised due specifically to
*Mergers valued at EUR 500 million or higher the combination of fixed and mobile networks, even if these were
**In the case of Joint Ventures (JV) the reported Enterprise Value (EV) large networks (e.g. Liberty Global/Base in Belgium).
of one of the merging parties (with the higher EV) was used as a proxy.
When not reported, the EV was estimated.
Europe's Digital Progress Report 2017 – Connectivity 5Broadband coverage: Basic broadband is available to everyone in the EU, while fixed technologies
cover 98 % of homes. Next generation access (NGA) covers 76 %, up from 71 % six months ago.
Deployment of 4G mobile continued to increase sharply. Rural coverage improved substantially in
4G and NGA.
Basic broadband is available to all in the EU, when considering all
major technologies (xDSL, cable, fibre to the premises - FTTP, Our Target (Digital Agenda for Europe)
WiMax, HSPA, LTE and Satellite). Fixed and fixed-wireless
technologies cover 98 % of EU homes. Basic broadband for all by 2013: 100 % in 2016
NGA technologies (VDSL, Cable Docsis 3.0 and FTTP) capable of Fast broadband (>30Mbps) for all by 2020: 76 % in 2016
delivering at least 30 Mbps download are available to 76 %.
4G mobile (LTE) coverage increased by seven percentage points
and reached 96 % (of homes with covered by at least one operator).
Rural 4G coverage went up from 36 % in 2015 to 80 % in 2016. NGA
is available in 40 % of rural homes, compared with 30% a year ago.
Total coverage by technology at EU level, 2015-2016 Rural coverage by technology at EU level, 2015-2016
100% 100%
Mid 2015 Mid 2016 Mid 2015 Mid 2016
80% 80%
60% 60%
40% 40%
20% 20%
0% 0%
Fixed &
Fixed
NGA
DSL
VDSL
FTTP
WiMAX
Standard
Docsis 3.0
HSPA
LTE
Satellite
mobile
Fixed &
Fixed
NGA
DSL
VDSL
FTTP
WiMAX
Standard
Docsis 3.0
HSPA
LTE
Satellite
mobile
cable
cable
cable
cable
Source: IHS, VVA and Point Topic Source: IHS, VVA and Point Topic
Europe's Digital Progress Report 2017 – Connectivity 6Coverage of fixed broadband increased slightly to 98 %. In about half of the Member States more
than 99 % of homes are covered. At the same time, Poland, Slovakia and Romania are lagging
behind with less than 90 %.
Fixed broadband coverage in the EU, 2011-2016
Primary internet access at home is provided mainly by fixed
100%
technologies. Among these technologies, xDSL has the largest Total Rural
footprint (94 %) followed by cable (44 %) and WiMAX (18 %). 95%
Fixed coverage is the highest in the Member States with well- 90%
developed DSL infrastructures, and is over 90% in all but three
Member States. 85%
Overall coverage of fixed broadband has only marginally 80%
increased since 2011, but rural coverage improved by 13
75%
percentage points. Developments have slowed down, as
Source: IHS,VVA and Point Topic
Member States have diverted their focus to NGA and wireless 70%
technologies. End 2011 End 2012 End 2013 End 2014 Mid 2015 Mid 2016
Fixed broadband coverage, June 2016
100%
Total Rural
90%
80%
70%
60%
50%
40%
30%
20%
10%
0%
MT NL CY LU UK FR BE PT CZ EL DK IT AT SE DE LT SI EU FI HR IE ES HU BG LV EE RO SK PL
Source: IHS and Point Topic
Europe's Digital Progress Report 2017 – Connectivity 7Coverage of next generation access (NGA) technologies continued to increase and reached 76 %.
NGA is getting more widespread in rural areas, covering 40% of homes.
For the purpose of this report, Next Generation Access includes Next Generation Access (NGA) broadband coverage in the EU,
VDSL, Cable Docsis 3.0 and FTTP. At mid-2016, VDSL had the 100%
2010-2016
largest NGA coverage at 48 %, followed by Cable (44 %) and Total Rural
FTTP (24 %). Most of the upgrades in European cable 80%
networks had taken place by 2011, while VDSL coverage is
now 2.5 times larger than four years ago. VDSL increased most 60%
in Italy last year, growing from 41% to 72%. There was a
remarkable progress also in FTTP (from 10 % in 2011 to 24 % 40%
in 2016), but FTTP coverage is still low.
20%
Rural NGA coverage went up by 10 percentage points,
reaching 40 % of homes. NGA in rural areas is provided mainly 0%
Source: IHS,VVA and Point Topic
by VDSL. End 2010 End 2011 End 2012 End 2013 End 2014 Mid 2015 Mid 2016
Next Generation Access (FTTP, VDSL and Docsis 3.0 cable) coverage, June 2016
100%
Total Rural
90%
80%
70%
60%
50%
40%
30%
20%
10%
0%
MT BE NL PT LU DK UK LV AT CY DE IE SI ES HU SE EE EU SK CZ FI BG IT RO PL HR FR EL
Source: IHS and Point Topic Data not available for Lithuania
Europe's Digital Progress Report 2017 – Connectivity 8Coverage of fibre to the premises (FTTP) grew from 10 % in 2011 to 24 % in 2016, while it remains
a primarily urban technology. Portugal and Latvia are the leaders in FTTP in Europe.
FTTP is catching up in Europe, as coverage for homes more Fibre to the Premises (FTTP) coverage in the EU, 2011-2016
than doubled since 2011. However, the FTTP footprint is still 25%
significantly lower than that of cable Docsis 3.0 and VDSL. In Total Rural
Portugal and Latvia more than 80 % of homes can already 20%
subscribe to FTTP services, while in Greece, Belgium, UK,
Ireland, Germany and Austria less than 10 % can do so. FTTP 15%
increased the most in the Czech Republic last year (from 17 % 10%
to 35 %). FTTP services are available mainly in urban areas
with the exception of Latvia, Denmark, Luxembourg, Romania 5%
and Netherlands, where more than 25 % of rural homes also
Source: IHS,VVA and Point Topic
have access to it. 0%
End 2011 End 2012 End 2013 End 2014 Mid 2015 Mid 2016
Fibre to the Premises (FTTP) coverage, June 2016
100%
Total Rural
90%
80%
70%
60%
50%
40%
30%
20%
10%
0%
PT LV ES SE RO DK SK LU CY SI EE FI BG CZ NL HU EU FR IT PL MT HR AT DE IE UK BE EL
Source: IHS and Point Topic Data not available for Lithuania
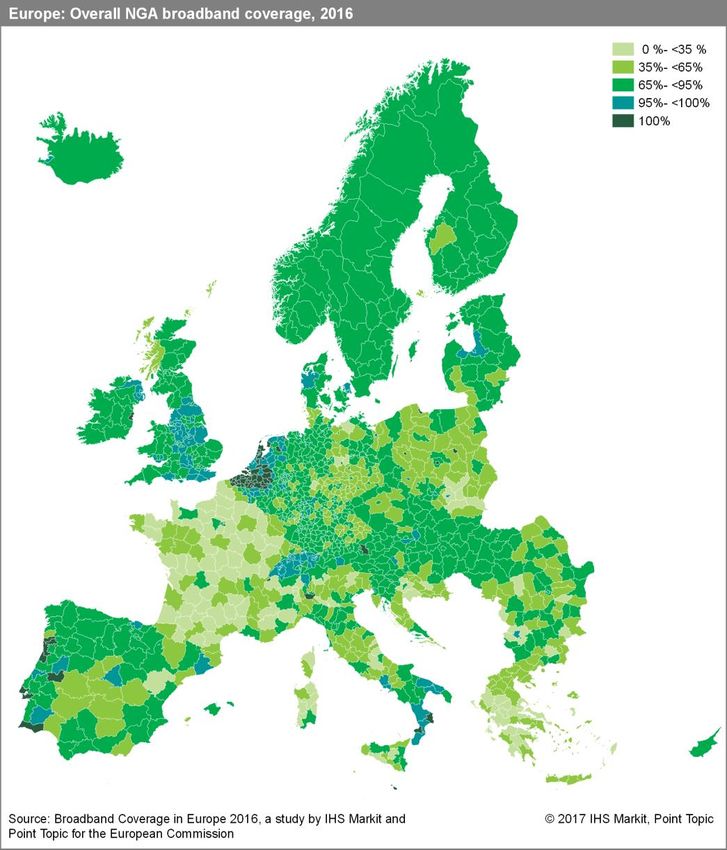
Europe's Digital Progress Report 2017 – Connectivity 9Overall fixed broadband and NGA broadband coverage by region. Europe's Digital Progress Report 2017 – Connectivity 10
4G mobile coverage: 96% of homes are covered by at least one operator in Europe (overall
coverage), up from 86% a year ago. Rural coverage went up from 36% in 2015 to 80% in 2016.
Average 4G availability* stands at 84%.
                                                                                                          4G mobile coverage in the EU, 2011-2016
 In 2016, deployment of 4G (LTE) continued and focused mainly                                                            Total                  Rural
 on rural areas: overall coverage went up to 96 % of homes. In                           100%
 rural areas, already 80% of homes are covered by at least one                            80%
 operator.
                                                                                          60%
 Average 4G availability (calculated as the average of each
 operator's coverage) falls somewhat below the overall coverage                           40%

 and stands at 84%.                                                                       20%
 Average 4G coverage is above 90% in about half of the                                       0%
 Member States, and is the lowest in Romania at 45%                                              End 2011 End 2012 End 2013            End 2014    Mid 2015 Mid 2016
                                                                                        Source: IHS,VVA and Point Topic

                                                                      4G (LTE) coverage, June 2016
100%
                                                                                                                                                       Average    Overall
 80%

 60%

 40%

 20%

  0%
        DK SE FI LT LU               PT BE EE CZ IE          SI UK HU PL                LV    NL   AT    IT    DE   ES    EU     EL   SK   MT     FR    HR   BG   CY   RO
Source: IHS and Point Topic           Average coverage in Malta refers to 2015

 * This is a new indicator measuring the average of mobile telecom operator's coverage within each country. A different indicator
 was used to measure 4G coverage in previous versions of the Digital Scoreboard. The old 4G indicator measured the overall
 coverage of operators, and it showed higher figures than the new indicator.

   Europe's Digital Progress Report 2017 – Connectivity                                                                     11
74 % of EU homes had a fixed broadband subscription in 2016. Luxembourg, the Netherlands and
the UK registered the highest figures in the EU, while Italy, Bulgaria and Poland had the lowest
take-up rates.
Households with a fixed broadband subscription at EU level (% of
Although fixed broadband is available to 98 % of EU homes, 26 households), 2007 - 2016*
80%
% of homes do not have a subscription. Growth in take-up was 70%
very strong until 2009, but then slowed down in the last few 60%
years, partially due to fixed-mobile substitution. 50%
At Member State level, take-up rates ranged from only 55 % in 40%
Italy to 96 % in Luxembourg. 30%
20%
10%
0%
* Note: Penetration figures include also mobile subscriptions until 2009. 2007 2008 2009 2010 2011 2012 2013 2014 2015 2016
Source: Eurostat (ICT usage in households and individuals)
Households with a fixed broadband subscription, % of households, 2016
100%
90%
80%
70%
60%
50%
40%
30%
20%
10%
0%
LU NL UK DE DK BE MT EE SI HU EU FR CY SK SE ES CZ HR IE PT AT EL LT RO LV FI PL BG IT
Source: Eurostat (Eurostat (ICT usage in households and individuals)
Europe's Digital Progress Report 2017 – Connectivity 1266 % of rural homes had a fixed broadband subscription across the EU in 2016. Luxembourg, the
Netherlands, the UK and Germany registered the highest figures, while in four Member States,
less than half of the homes subscribed.
Households having a fixed broadband connection per area at EU level (% of
There is a substantial gap between rural and national households), 2010 - 2016
penetration rates, although the gap has closed over the last six 90%
Total Urban areas Intermediate areas Rural areas
years, from 11 percentage points in 2010 to 7 percentage 80%
70%
points in 2016. 60%
In Luxembourg, Netherlands, Germany, Belgium, Denmark, 50%
40%
Austria, Croatia and Slovenia, rural and national penetration 30%
rates are almost identical. However, in Portugal, Bulgaria, 20%
Greece and Romania, where rural take-up is among the lowest 10%
0%
in Europe, there are significant gaps of 15-17 percentage points 2010 2011 2012 2013 2014 2015 2016
compared to the national take-up. Source: Eurostat (ICT usage by households and individuals)
Household fixed broadband penetration rural/total (% of households), 2016
100%
Rural Total
90%
80%
70%
60%
50%
40%
30%
20%
10%
0%
LU NL UK DE DK BE MT EE SI HU EU28 FR CY SK SE ES CZ HR IE PT AT EL LT RO LV FI PL BG IT
Source: Eurostat (ICT usage by households and individuals)
Europe's Digital Progress Report 2017 – Connectivity 1327 % of European homes subscribe to fast broadband access of at least 30 Mbps. There has been
a significant increase since 2010. Belgium and the Netherlands are the leaders in Europe in fast
broadband take-up.
Households with a fast broadband (at least 30Mbps) subscription,
2010 - 2016
There has been a sharp upward trend in the take-up of fast 30%
broadband in the EU since 2010, triggered also by continuous Source: Communications Committee and Eurostat
25%
deployment of infrastructure. Most cable subscriptions were
migrated to high-speed plans, and high-speed VDSL and fibre 20%
services are also catching up. In Belgium and the Netherlands 15%
two thirds of homes already subscribe to fast broadband, while
10%
in Croatia, Greece, Italy and Cyprus, high-speed services still
remain marginal. 5%
0%
2010 2011 2012 2013 2014 2015 2016
Fast broadband (at least 30Mbps) household penetration, 2016
70%
Source: Communications Committee and Eurostat
60%
50%
40%
30%
20%
10%
0%
NL BE MT LU SE RO PT HU IE DK LT LV UK ES BG EU DE CZ PL EE SK FI SI AT FR HR IT EL CY
Europe's Digital Progress Report 2017 – Connectivity 1411 % of European homes currently subscribe to ultrafast broadband (at least 100 Mbps), a marked
improvement from 0.3 % six years ago. Romania, Sweden, the Netherlands and Latvia are the
most advanced in ultrafast broadband adoption.
The Digital Agenda for Europe set the objective that at least Households with an ultrafast broadband (at least 100Mbps)
subscription, 2010 - 2016
50 % of homes should subscribe to ultrafast broadband by 12%
2020. In June 2016, 49 % of homes were covered by 10%
Source: Communications Committee and Eurostat
networks capable of providing 100 Mbps. As service
offerings are emerging, take-up is growing sharply. The 8%
penetration is the highest in Romania and Sweden with over 6%
one third of homes subscribing to at least 100 Mbps. In
Greece, Italy and Croatia take-up is low primarily due to the 4%
lack of superfast infrastructure. However, there may also be 2%
other factors involved as in Cyprus, where the infrastructure
is available for many homes, take-up also continues to be 0%
2010 2011 2012 2013 2014 2015 2016
slow.
Ultrafast broadband (at least 100Mbps) household penetration, 2016
40%
Source: Communications Committee and Eurostat
35%
30%
25%
20%
15%
10%
5%
0%
RO SE NL BE LV PT HU FI ES LU IE CZ LT EU DK UK SI SK PL FR DE EE BG MT AT IT HR CY EL
Europe's Digital Progress Report 2017 – Connectivity 15At EU level, 92 % of companies have a fixed broadband subscription. However, only 32 % benefit
from fast broadband (at least 30Mbps). While almost all large companies use broadband, 8 % of
small enterprises are not yet connected.
Enterprises having a fixed broadband connection at EU level, 2014-2016
While the vast majority of European businesses use
Any fixed broadband Fast fixed broadband
broadband, only one third of companies and 27 % of private 100%
homes subscribed to fast broadband in 2016. The penetration
80%
of fast broadband varies greatly between companies of different
60%
size. While 62 % of large companies benefit from broadband
speed of at least 30 Mbps, only 29% of small enterprises do so. 40%
Nevertheless, the penetration of fast broadband went up from 20%
24 % to 32 % among all enterprises during the last two years. 0%
2014 2015 2016
Source: Eurostat (ICT usage and eCommerce in enterprises)
Percentage of enterprises having any fixed broadband connection,
Percentage of enterprises having a fast fixed broadband
by Enterprise size at EU level, 2014 - 2016
connection, by Enterprise size at EU level, 2014-2016
100%
Small Medium Large 100%
Small Medium Large
98% 90%
Source: Eurostat (ICT usage and eCommerce in enterprises)
80%
96%
70%
94% 60%
50%
92% 40%
90% 30%
20%
88% 10%
86% 0%
2014 2015 2016 2014 2015 2016
Source: Eurostat (ICT usage and eCommerce in enterprises)
Europe's Digital Progress Report 2017 – Connectivity 1667 % of subscriptions are xDSL, although xDSL is slightly losing market share. Cable is second
with 19 % of the market. Fibre to the Home/Building is emerging.
Fixed broadband net adds by technology at EU level, 2006-2016
Although DSL is still the most widely used fixed broadband DSL (VDSL included) Cable (DOCSIS 3.0 included) FTTH/B
60 000
technology, its market share declined from 80 % in 2009 to
67 % in 2016. The second half of 2016 was the first time, when 50 000
the number of xDSL subscriptions declined. The main 40 000
challenger — cable — increased slightly its share during the 30 000
same time period, but most of the gains were posted by 20 000
alternative technologies, such as FTTH/B. 10 000
Nevertheless, DSL continues to be predominant, and its market 0
share can be strengthened thanks to the increasing VDSL -10 000
coverage. Jan-06 Jul-07 Jan-09 Jul-10 Jan-12 Jul-13 Jan-15 Jul-16
Source: Communications Committee
Fixed broadband subscriptions - technology market shares at EU level, January 2006 to July 2016
DSL (VDSL included) Cable (DOCSIS 3.0 included) FTTH/B Other
100%
90%
80%
70%
60%
50%
40%
30%
20%
10%
0%
Jan-06 Jul-06 Jan-07 Jul-07 Jan-08 Jul-08 Jan-09 Jul-09 Jan-10 Jul-10 Jan-11 Jul-11 Jan-12 Jul-12 Jan-13 Jul-13 Jan-14 Jul-14 Jan-15 Jul-15 Jan-16 Jul-16
Source: Communications Committee
Europe's Digital Progress Report 2017 – Connectivity 17xDSL is particularly important in Greece and Italy, and has the lowest market share in Bulgaria,
Lithuania and Romania. Cable has a very high market share in Belgium, Hungary, Malta and the
Netherlands. FTTH/B is the most widely used technology in Lithuania, Latvia, Romania, Bulgaria
and Sweden.
The share of xDSL ranges from 12 % in Bulgaria to 100 % in Share of fibre connections in total fixed broadband, July 2016
Greece. DSL is generally less dominant in Eastern Europe. 80%
Looking at alternative technologies, cable is present in all but 70%
Source: OECD and Communications Committee
two Member States and it is the major technological competitor 60%
of DSL in the majority of the Member States. 50%
FTTH and FTTB together represent 11 % of EU broadband 40%
subscriptions up from 9 % a year ago. In these technologies, 30%
Europe continues to lag behind global leaders such as South 20%
Korea and Japan. 10%
0%
EU28 United States South Korea Japan
Fixed broadband subscriptions - technology market shares, July 2016
DSL lines % (VDSL included) Cable modem % (DOCSIS 3.0 included) FTTH/B % Other %
100%
90%
80%
70%
60%
50%
40%
30%
20%
10%
0%
BE BG CZ DK DE EE EL ES FR HR IE IT CY LV LT LU HU MT NL AT PL PT RO SI SK FI SE UK EU
Source: Communications Committee
Europe's Digital Progress Report 2017 – Connectivity 18NGA subscriptions went up sharply by 20 million in the last two years, and already 42 % of all
subscriptions are NGA. In Belgium, Romania and the Netherlands, over three quarter of fixed
broadband subscriptions are NGA, while the same ratio is less than 10 % in Greece and Cyprus.
Evolution of NGA (FTTH, FTTB, VDSL, Cable Docsis 3.0 and other NGA)
NGA subscriptions in the EU doubled during the last three subscriptions (in millions) in the EU, 2012-2016
80
years and account for 42 % of all EU fixed broadband Source: Communications Committee
70
subscriptions. 60
At least two thirds of broadband subscriptions are NGA in 50
Belgium, Romania, the Netherlands, Bulgaria, Latvia, Sweden, 40
Portugal and Denmark. Whereas, Cyprus, Greece, Italy, Austria 30
and France are lagging behind all other Member States. 20
10
0
Jan-12 Jul-12 Jan-13 Jul-13 Jan-14 Jul-14 Jan-15 Jul-15 Jan-16 Jul-16
NGA (FTTH, FTTB, VDSL, Cable Docsis 3.0 and other NGA) subscriptions as a % of total fixed broadband subscriptions, July 2016
100%
90% Source: Communications Committee
80%
70%
60%
50%
40%
30%
20%
10%
0%
BE RO NL BG LV SE PT DK LT HU MT SI FI IE EE ES CZ LU UK PL EU SK HR DE FR AT IT EL CY
Europe's Digital Progress Report 2017 – Connectivity 19Cable Docsis 3.0 is currently the most widespread NGA technology in the EU both in coverage
and take-up. VDSL subscriptions went up by 47% in the last twelve months.
Share of different NGA technologies in total NGA subscriptions, July
39 % of NGA subscriptions are Docsis 3.0, which is relatively 45%
2016
high give cable broadband in total represents only 19 % of all 40%
Source: Communications Committee
EU fixed broadband subscriptions. While almost all the cable 35%
networks have been upgraded to NGA, only 51 % of the xDSL 30%
25%
network is VDSL-enabled. Nevertheless, VDSL coverage went
20%
up by 17 % and the number of subscriptions by 47 % in the last 15%
twelve months. FTTH and FTTB have a 16 % and 10 % share 10%
in total NGA subscriptions, respectively. 5%
0%
vDSL FTTH FTTB Cable Other NGA
NGA subscriptions (millions) by technology at EU level, January 2012 - July 2016
30
vDSL Fibre to the Home Fibre to the building - Ethernet + LAN (FTTB) Cable Other NGA
25
20
15
10
5
0
Jan-12 Jul-12 Jan-13 Jul-13 Jan-14 Jul-14 Jan-15 Jul-15 Jan-16 Jul-16
Source: Communications Committee
Europe's Digital Progress Report 2017 – Connectivity 20Competition in the fixed broadband market: new entrant operators are continuously gaining
market share, but incumbents still control 41 % of subscriptions.
Fixed broadband subscriptions - operator market shares at EU level,
January 2006 - July 2016
Incumbent operators are market leaders in almost all Member 70.0%
States, although their market share is decreasing gradually. Incumbents New entrants
During the last 10 years, new entrant operators have 60.0%
consistently posted higher net gains then the incumbents in
50.0%
each year, although a reverse in this trend has been observed
over the last six months. Overall, market share of incumbents 40.0%
in the EU has decreased by 10 percentage points since 2006.*
30.0%
Source: Communications Committee
* Break in series in July 2010 due to modification of historical data. 20.0%
Jan-06 Jul-07 Jan-09 Jul-10 Jan-12 Jul-13 Jan-15 Jul-16
Fixed broadband subscriptions growth per day by operator at EU Fixed broadband subscriptions growth per day by operator at EU level
level, January 2006 - July 2016 % of total, January 2006 - July 2016
40 000 90%
Incumbents New entrants Incumbents %
35 000 80%
Source: Communications Committee 70% New entrants %
30 000
60%
25 000
50%
20 000
40%
15 000 30%
10 000 20%
10% Source: Communications Committee
5 000
0 0%
Jan-06 Jul-07 Jan-09 Jul-10 Jan-12 Jul-13 Jan-15 Jul-16 Jan-06 Jul-07 Jan-09 Jul-10 Jan-12 Jul-13 Jan-15 Jul-16
Europe's Digital Progress Report 2017 – Connectivity 21Market shares of incumbents are shown to have large differences across Europe. In 7 out of the
28 Member States, at least half of the subscriptions are provided by incumbent operators.
Market shares are calculated at national level for incumbents Incumbents have the highest subscription market share in
and new entrants. However, broadband markets are Luxembourg and Cyprus, where the small market size may
geographically fragmented suggesting that a large number of favour concentration. In contrast, incumbents are the weakest
homes are served by only one provider (most likely by the in Europe in Romania, Bulgaria, the Czech Republic and
incumbent operator in this case). Poland. In all these four Member States, most subscribers use
technologies other than xDSL.
Fixed broadband subscriptions - operator market shares, July 2016
Incumbents New entrants
100%
90%
80%
70%
60%
50%
40%
30%
20%
10%
0%
RO BG CZ PL SI IE SK UK SE FR DE EU HU NL PT ES EL BE IT LT HR MT DK AT EE LV CY LU
Source: Communications Committee
Europe's Digital Progress Report 2017 – Connectivity 22In the DSL market, unbundling reduced the dominance of incumbents, but in VDSL incumbents
hold 66 % of subscriptions. Nevertheless, NGA is provided mainly by new entrants because of the
high share of cable.
Market share of incumbents by technology (% of subscriptions) at EU
New entrant operators can compete with incumbents by using level, July 2016
70%
either the incumbent's network or their own network to offer Source: Communications
60%
internet access. In Greece, competition is entirely based on Committee
50%
regulated access to the incumbent's access network, while in
40%
Italy and France over 80 % of subscriptions are DSL. In
30%
Eastern European Member States, competition is rather based
on competing infrastructures. This applies also to Belgium, 20%
Malta, Portugal and the Netherlands. 10%
0%
All NGA DSL VDSL Cable FTTH FTTB
broadband
New entrants' subscriptions - using own infrastructure or the incumbent's network (% of total), July 2016
New entrant subscriptions using the incumbent's infrastructure New entrant subscriptions using own infrastructure
100%
90%
80%
70%
60%
50%
40%
30%
20%
10%
0%
BG MT RO LV LT EE HU BE PT CZ PL SK SE AT NL SI DK ES CY IE EU LU DE HR UK FR IT EL
Source: Communications Committee
Europe's Digital Progress Report 2017 – Connectivity 2353 % of DSL subscriptions belong to incumbents. New entrants mainly use Local Loop
Unbundling to sell DSL. In six Member States, the new entrants' presence in the DSL market is
marginal.
Number of DSL subscriptions by new entrants at EU level, given
In Bulgaria, Romania, Malta, Latvia, Estonia and Lithuania, different types of access (VDSL excluded), 2013-2016
50 000 000
there is literally no competition in the DSL market. These Own network Full ULL Shared access
Member States, however, have strong platform competition. 40 000 000 Bitstream Resale
Alternatively, in France, Greece, the UK, Spain, Ireland and
30 000 000
Italy new entrants account for the majority of xDSL
subscriptions. In all these Member States, competition is tight 20 000 000
due to the possibility of entry via DSL subscriptions provided
10 000 000
through Local Loop Unbundling, although in Italy bitstream is
also important. 0
Jul-13 Jul-14 Jul-15 Jul-16
Source: Communications Committee
DSL subscriptions - operator market shares (VDSL included), July 2016
Incumbent New entrants
100%
90%
80%
70%
60%
50%
40%
30%
20%
10%
0%
FR EL UK ES IE IT EU DE HR SI SE NL DK LU SK CY PL CZ AT PT HU BE LT EE LV MT RO BG
Source: Communications Committee
Europe's Digital Progress Report 2017 – Connectivity 24Average connection speed ranges from 7 Mbps to 20 Mbps in Europe. Sweden, Finland, the
Netherlands and Latvia are among the top countries in Europe and worldwide.
South-Korea is the world leader in average internet connection The worst performing countries include Cyprus, Greece,
speed at 26.3 Mbps, followed by Norway and Sweden at 20 Croatia, Italy and France with speeds of less than 10 Mbps.
Mbps. With the exception of Cyprus, all these countries have a
The EU has an average speed of 13 Mbps, which is well below relatively low coverage of fast broadband technologies (NGA).
the preceding leading countries, Japan (18Mbps) and also USA
(16Mbps).
While five Member States have higher speeds than the US, the
slower speeds in the EU can be explained by a lower usage of
FTTH technology and less coverage of cable.
Average connection speed (Mbps) by country, 2016
30
25
20
15
10
5
0
Source: Akamai, Q3 -2016
Europe's Digital Progress Report 2017 – Connectivity 25There are 84 active mobile broadband SIM cards per 100 people in the EU, up from 34 four years
ago. The growth was linear over the last four years with over 40 million new subscriptions added
every year.
Mobile broadband penetration at EU level, January 2009 - July 2016
Mobile broadband represents a fast growing segment of the 90%
Source: Communications Committee
broadband market. More than 60 % of all active mobile SIM 80%
70%
cards use mobile broadband.
60%
In the Nordic countries and Estonia, Luxembourg and Poland, 50%
there are already more than 100 subscriptions per 100 people, 40%
while in Hungary and Greece the take-up rate is still below 50 %. 30%
Most of the mobile broadband subscriptions are used on 20%
smartphones rather than on tablets or notebooks. 10%
0%
Jan-09 Jul-10 Jan-12 Jul-13 Jan-15 Jul-16
Mobile broadband penetration by country, July 2016
160%
Source: Communications Committee
140%
120%
100%
80%
60%
40%
20%
0%
FI DK SE EE LU PL IE UK CY ES IT NL EU BG FR HR LV AT CZ LT SK DE RO BE MT SI PT EL HU
Europe's Digital Progress Report 2017 – Connectivity 26Mobile broadband is still mainly complementary to fixed broadband. In 2016, 9.1 % of EU homes
accessed the internet only through mobile technologies. Finland and Italy were leaders in mobile
access to internet with 30% and 22 % of homes using it in 2016.
Europeans access the internet primarily with fixed technologies Households using inly mobile broadband at home at EU level (% of
households), 2007 - 2016
10%
at home. However, there are a growing number of homes with 9%
only mobile internet use. The percentage of homes with purely 8%
mobile broadband access grew from 4.1 % in 2010 to 9.1 % in 7%
2016. This indicates that mobile broadband still mainly 6%
complements rather than substitutes fixed broadband. 5%
4%
The Netherlands was the Member State with the lowest mobile 3%
only access at less than 0.1 %. 2%
By contrast, Finland and Italy were leaders in mobile access to 1%
0%
internet with 30 % and 22 % of homes in 2016. 2010 2011 2012 2013 2014 2015 2016
Source: Eurostat (ICT usage by households and individuals)
Households using only mobile broadband at home (% of households), 2016
35%
30%
25%
20%
15%
10%
5%
0%
FI IT AT SE PL IE LV ES CZ EU EE DK LT RO HR FR SK BG HU UK PT DE BE CY MT EL SI LU NL
Source: Eurostat (ICT usage by households and individuals)
Europe's Digital Progress Report 2017 – Connectivity 27Internet traffic per capita in Western Europe* is currently 27 GB per month. By 2020, this figure
is estimated to go up to 66.5 GB, while in the US it will be 165 GB.
IP traffic per capita (Gigabytes per month and region), 2015 - 2020
180
2015 2020
160
140
120
100
80
60
40
20
0
EU (Western Europe) US Japan South Korea Russia China
Source: Cisco, VNI Forecast Highlights
Internet traffic per capita in Western Europe* is well below Mobile IP traffic per capita (Gigabytes per month and region),
those of the US and South Korea. Although, with rapid growth 2015-2020
14
in recent years, it is projected to reach the current levels of 2015 2020
12
US and South Korea by 2020.
10
Mobile data traffic is a fraction of total IP traffic, and this will
8
remain so despite the large increase forecast by Cisco.
6
Similarly to the overall traffic, mobile IP traffic per capita in the
4
EU is substantially below the US and South Korea.
Nevertheless, Western European traffic is estimated to be six 2
times higher in 2020 than in 2015. 0
EU (Western US Japan South Korea Russia
* Note: France, Germany, Italy, Spain, Sweden, United Kingdom, Denmark, Europe)
Netherlands, Belgium, Ireland, Norway and Iceland. Source: Cisco, VNI Forecast Highlights
Europe's Digital Progress Report 2017 – Connectivity 28Prices* of fast broadband access tend to decrease over time but vary widely across Member
States.
Broadband retail prices (EUR PPP)* – Standalone offers at EU level, 2013 -2016
Broadband access prices (minimum prices, calculated on Purchasing
Power Parity) vary between EUR 11 and EUR 43 for a standalone 40
12Mbps-30Mbps 30Mbps-100Mbps
offer with a minimum download speed of 12 Mbps. The minimum 35
prices were the lowest in Sweden (EUR 11), Bulgaria (EUR 12) and 30
Hungary (EUR 12) and the highest in Spain (EUR 43), Slovenia (EUR 25
34) and Cyprus (EUR 33). 20
15
In the range of minimum download speed of 30 Mbps, European 10
average stands at EUR 25 with a slight decrease from last year. 5
0
* Based on least expensive prices available and expressed in euros adjusted for 2013 2014 2015 2016
purchasing power parity, VAT included. Source: Empirica and Van Dijk
Fixed broadband retail prices (EUR PPP) - Standalone offers, Autumn 2016
50
12Mbps-30Mbps 30Mbps-100Mbps
45
40
35
30
25
20
15
10
5
0
BE BG CZ DK DE EE EL ES FR HR IE IT CY LV LT LU HU MT NL AT PL PT RO SI SK FI SE UK EU
Source: Empirica
Europe's Digital Progress Report 2017 – Connectivity 29Prices* of triple play bundles including fast broadband access, fixed telephony and television
went down by 27 % since 2013
Broadband retail prices (EUR PPP)* – Bundles including broadband,
The minimum prices for triple play bundles including broadband fixed telephony and television, 2013 - 2016
access (with a download speed between 30 and 100 Mbps), fixed 70
12Mbps-30Mbps 30Mbps-100Mbps
telephony and television vary between EUR 18 and EUR 75 in the 60
EU. The minimum price was the lowest in Bulgaria (EUR 18), 50
Lithuania (EUR 21) and Sweden (EUR 22) and the highest in Ireland 40
(EUR 75), Belgium (EUR 60), Portugal (EUR 59) and Croatia (EUR 30
56). Prices decreased over time, with the EU average going down 20
from EUR 58 in 2013 to EUR 42 in October 2016. 10
*Based on least expensive prices available and expressed in euros adjusted for 0
purchasing power parity, VAT included. 2013 2014 2015 2016
**No data available for Finland and Denmark. Source: Empirica and Van Dijk
Fixed broadband retail prices (EUR PPP)** - Bundles including broadband, fixed telephony and television, Autumn 2016
80
12Mbps-30Mbps 30Mbps-100Mbps
70
60
50
40
30
20
10
0
BE BG CZ DE EE EL ES FR HR IE IT CY LV LT LU HU MT NL AT PL PT RO SI SK SE UK EU
Source: Empirica
Europe's Digital Progress Report 2017 – Connectivity 30Broadband take-up tends to be lower in Member States where the cost of broadband access
accounts for a higher share of income, but this correlation is not strong. The lowest income
quartile of the EU population has a significantly lower take-up rate.
Considering overall take-up, European average is 74 % of homes Fixed broadband household penetration by income quartiles,
2011-2016
with Luxembourg, the Netherlands at the highest positions and Italy, 100%
Source: Eurostat
Bulgaria and Poland lagging behind. 80%
Income plays an important role in broadband take-up. The lowest
income quartile has only 54 % take-up rate of fixed broadband as 60%
opposed to 90 % in the highest income quartile. 40%
The gap between the lowest income quartile and the national
Low income Medium low income
average is particularly large in Bulgaria, Romania, Hungary, 20%
Medium high income High income
Slovenia, Lithuania, Czech Republic, Croatia, Spain and Slovakia. 0%
Average
2011 2012 2013 2014 2015 2016
Data not available for Luxembourg and Malta. Source: Commission services based on Eurostat and Empirica
Europe's Digital Progress Report 2017 – Connectivity 31Member States are catching up in transposing the Broadband Cost Reduction Directive
(Directive 2014/61/EU) (1/2).
Since the major source of costs in network deployment is In March 2016, the Commission opened infringement
civil engineering costs (accounting for up to 80 % of the total proceedings against 27 Member States (all Member
costs), Directive 2014/61/EU includes measures to reduce States except Italy) who had not yet completed the
the cost of deploying high-speed electronic communication transposition of the Directive into national law. As a
networks. The Directive includes measures: second step, the Commission sent reasoned opinions to
• facilitating access to physical infrastructures of all network 19 Member States in September 2016, urging them to
operators (i.e. telecom operators, as well as energy, or other implement measures of cost reduction in deploying high-
utilities); speed electronic communications networks.
• improving coordination of civil engineering works; Infringement proceedings against seven Member States
• providing transparency of permit granting procedures; and (Denmark, Ireland, Malta, Poland, Romania, Spain and
Sweden) have in the meantime been closed following
• equipping and accessing buildings with in house physical
complete transposition of the Directive. The Commission
infrastructure (e.g. mini-ducts) capable of hosting high-
is currently assessing further responses by Member
speed networks.
States to reasoned opinions. As a next step, the
The deadline for Member States to transpose this Directive Commission is analysing the conformity of the
expired on 1 January 2016. transposition for the countries that have notified
The transposed measures had to apply at the latest as of 1 complete transposition of the Directive. Information
July 2016 except for the obligation to equip buildings with in- about national measures transposing the Directive is
building physical infrastructure and with an access point available here and ongoing infringement proceedings
which applies to new buildings or major renovation works here.
where planning permission has been submitted after 31
December 2016.
Europe's Digital Progress Report 2017 – Connectivity 32Member States are catching up in transposing the Broadband Cost Reduction Directive
(Directive 2014/61/EU) (2/2).
As of 31 March 2017, 16 Member States have notified to the
Commission complete transposition of the Directive (Austria,
Cyprus, Denmark, Estonia, Germany, Greece, Hungary,
Ireland, Italy, Lithuania, Malta, Poland, Romania, Spain,
Sweden, UK). Eleven Member States have notified partial
transposition of the Directive (Belgium, Bulgaria, Croatia,
Finland, France, Latvia, Luxembourg, the Netherlands,
Portugal, Slovakia, Slovenia) while one Member State has
not notified any transposition measure so far (Czech
communication absent
Republic). Delays in transposing and applying the measures
partial transposition notified
provided in the Directive may limit opportunities to reduce
complete transposition notified
deployment costs and exploit synergies, which is particularly
important in those areas where NGA coverage is lagging
behind or upgrades of networks are needed.
Europe's Digital Progress Report 2017 – Connectivity 33Following the adoption of the 2014 Recommendation on relevant markets, a reduction of ex
ante regulation is progressively observed as competition in the telecommunications markets
across the EU develops.
Under EU telecommunications legislation, appropriate
Since the adoption of the 2014 Recommendation, the
regulatory measures on operators should be imposed only
Commission observes a progressive reduction of ex ante
following a market analysis showing that a given market is
regulation as the competition in the telecommunications
not effectively competitive. This market analysis needs to be
markets across the EU developed. This trend confirms the
periodically carried out by the competent national regulatory
Commission’s assumption that those markets tend
authority.
towards effective competition in the Member States. Most
The table in the next slide shows an overview of markets markets outside the scope of the Recommendation which
which are still subject to ex ante regulation (red colour), are still regulated have only been reviewed once or twice
have already been fully or partially deregulated since the entry into force of the Regulatory Framework
(green/yellow colour), as well as the rounds of market and market regulation may no longer reflect the effective
analysis carried out since the adoption of the Regulatory competitive dynamics observed since the last round.
Framework back in 2002. The 2014 Recommendation on Therefore ensuring a timely review of relevant markets is
relevant markets excluded from regulation two fixed key to aligning market regulation with technological and
telecoms markets and redefined two other markets in order market developments.
to reflect market and technology developments. For markets
not included in the Recommendation, ex ante regulation can
be imposed only if a market analysis shows that the market
does not tend towards effective competition.
Europe's Digital Progress Report 2017 – Connectivity 34Effective competition - no ex ante regulation 1 1st round-competition/regulation
No effective competition - ex ante regulation 2 2nd round-competition/regulation
Partial competition - partial ex ante regulation 3
3rd round-competition/regulation
4th round-competition/regulation
4
Article 7 cases as at 30/03/2017
Europe's Digital Progress Report 2017 – Connectivity 35More EU harmonised spectrum underpins future spectrum needs within the EU, while assignment in national markets differs (1/2). Following the adoption in April 2016 of Commission The 800 MHz band (the ‘digital dividend’) is currently Implementing Decision (EU) 2016/687, harmonising the 700 assigned (in two cases not entirely) in 26 Member States, MHz band, the total amount of spectrum harmonised at EU 11 of which had been granted a derogation from the level for wireless broadband use reached 1090 MHz during original deadline under Article 6(4) of the RSPP. Two the reporting year. The authorisation process for this band Member States have not yet assigned and/or made was already completed by three Member States (Finland, available the 800 MHz band; while Malta asked for an France and Germany) and the other Member States are extension of the derogation it had been granted, Bulgaria expected to authorise the band by 2020, unless there are benefits from the exception due to incumbent military use justified reasons* for a delay until mid 2022 at the latest. under Article 1(3) RSPP. A limited list of justified reasons is contained in the annex of the Decision of the European Parliament and the Council on the use of the 470-790 MHz band in the Union. Moreover, with a view to reaching the target of 1200 MHz for wireless broadband set by the radio spectrum policy programme (RSPP), the Commission is working on the possible extension of the 1.5 GHz band to provide additional download capacity for 5G services representing an extension of 51 MHz. * A limited list of justified reasons is contained in the annex of the Decision of the European Parliament and the Council on the use of the 470-790 MHz band in the Union. Europe's Digital Progress Report 2017 – Connectivity 36
More EU harmonised spectrum underpins future spectrum needs within the EU, while assignment
in national markets differs (2/2).
When excluding the recently harmonised 700 MHz bands, a 4                            Lack of assignment may be due to different reasons depending on
percentage points (from 69 to 73 %) increase in the EU-harmonised                    the circumstances in each Member States, such as delays in making
spectrum assigned on average across Member States for wireless                       the spectrum available and in the timely carrying out of assignment
broadband use can be reported since last year. The swift assignment                  procedures, lack of market interest, use for defence purposes, etc.
of the 700 MHz band in 3 Member States was a positive
development which paves the way for other Member States to take                      In view of these different circumstances and regulatory conditions
the necessary measures to meet the 2020 deadline.                                    applicable to different bands, lack of assignment does not
Bands above 1 GHz have the potential for additional capacity. Whilst                 necessarily mean non-compliance with EU law.
these remained partly unassigned in many Member States, they will
play an even more relevant role in the deployment of 5G services.

                                               Assigned spectrum in harmoised EU bands, December 2016
 RSPP Goal
       1 200
                    700 MHz    800 MHz   900 MHz   1.5 GHz   1800 MHz        2 GHz paired      2.6 GHz    3.4-3.6 GHz   3.6-3.8 GHz        Not assigned due to lack of demand

       1 000

        800

 MHz
        600

        400

        200

          0
               AT    BE   BG   HR   CY   CZ   DK   EE   FI   FR   DE    EL     HU    IE       IT   LV    LT   LU   MT   NL    PL      PT     RO    SK    SI   ES    SE   UK
                                                                               Member State
 Source: Commission services
                                                                                                                   Note: Assigned spectrum include guard bands

   Europe's Digital Progress Report 2017– Connectivity                                                                   37
Development of national broadband plans
Since the adoption of the digital agenda for Europe Content-wise, nearly all Member States’ NBPs focus
(DAE) 2020 targets — i.e. coverage of 30 Mbps on reaching minimum download speeds — in most
download for all Europeans and take-up of 100 Mbps cases in terms of coverage (availability of commercial
subscriptions for at least 50 % of European households offer on a given territory) and sometimes also
penetration (actual take-up in the form of internet
— most Member States have gradually adopted national
access subscriptions). In contrast, emphasis on
broadband plans (NBPs). They are devised to integrate upload data rates is rather exceptional (e.g. Denmark,
all relevant aspects of an effective broadband policy Luxembourg or Ireland). In addition, operational
and resources enabling policy makers and public measures to foster demand for digital applications
authorities to properly plan public interventions in the and high-speed internet access are relatively
telecommunications sector. infrequent.
At the time of writing, a large majority of Member States had Notably, some Member States have held consultations on
already started implementing their NBPs, albeit with various their draft national broadband plans. These include for
instance the Czech Republic (‘Digital Czech Republic’),
time horizons ranging from 2017 to 2022. Some NBPs are
France (‘National Programme for Very High Speed
integrated within broader strategic approaches, others are Broadband’) and the Slovak Republic (‘National Strategy
documents specifically dedicated to broadband deployment. for Broadband Access in the Slovak Republic).*
In some countries, multiple official documents drafted by Some Member States (Sweden, Germany and Austria)
different national authorities exist that specify aspects have already started to adapt the targets of their National
related to such broadband developments. Broadband Plans to the new EU broadband targets for
2025 proposed by the Commission in its September 2016
Communication "Connectivity for a Competitive Digital
Single Market - Towards a European Gigabit Society".
* OECD countries with public consultation procedures prior to drafting their national broadband
plans are: Canada (‘Improving Canada’s Digital Advantage’), Ireland (‘Next Generation Broadband’),
Japan (‘Path of light’), and the United States (‘Connecting America: The National Broadband Plan‘)
Europe's Digital Progress Report 2017 – Connectivity 38Broadband targets in national broadband plans
Although some NBPs do not have targets on Declared broadband targets in NBPs are, first and
penetration/uptake or have set targets on other features foremost, guideposts, whose practical feasibility and
(e.g. upload speeds), the following general observations can actual success will depend on the utilisation of appropriate
be made: means, including legal measures and financial resources.
Therefore, it is important that Member States have the
necessary resources and tools in place, rather than
• 11 Member States surpass the DAE-2020 targets merely policy targets, to facilitate the effective rollout of
(Austria, Belgium, Bulgaria, Denmark, Estonia, Finland, broadband infrastructure on their territories.
Germany, Hungary, Luxembourg, Slovenia and The following figure shows a visualization of the
Sweden), broadband targets of the Member States in comparison to
the DAE connectivity targets.
• 14 Member States are convergent with the DAE-2020
targets (Croatia, Cyprus, Czech Republic, Greece,
Ireland, Italy, Latvia, Lithuania, Malta, Netherlands,
Poland, Portugal, Slovakia and Spain),
• 3 Member States fall short of meeting the DAE-2020
targets (France, Romania and the United Kingdom).
Europe's Digital Progress Report 2017 – Connectivity 39National broadband plans
MS NBP-Targets MS NBP-Targets
Austria 99 % coverage with 100 Mbps by 2020 Italy 100 % coverage with 30 Mbps by 2020.
85 % HH penetration of 100Mbps services by 2020
Belgium 50 % HH penetration with 1 Gbps by 2020 Latvia 100 % coverage with 30 Mbps by 2020.
50 % HH penetration with 100 Mbps service by 2020
Bulgaria 100 % coverage with 30 Mbps by 2020. Lithuania 100 % coverage with 30 Mbps by 2020.
50 % of households and 80 % of businesses subscribing >100 50 % penetration with 100 Mbps by 2020
Mbps by 2020
Croatia 100 % coverage with 30 Mbps by 2020. Luxembourg 100 % coverage with 1 Gbps by 2020
50 % HH penetration with 100 Mbps service by 2020
Cyprus 100 % coverage with 30 Mbps by 2020. Malta 100 % coverage with 30 Mbps by 2020.
50 % HH penetration with 100 Mbps service by 2020 50 % HH penetration with 100 Mbps service by 2020
Czech 100 % coverage with 30 Mbps by 2020. Netherlands 100 % coverage with 30 Mbps by 2020.
Republic 50 % HH penetration with 100 MBps service by 2020 50 % HH penetration with 100 Mbps service by 2020
Denmark 100 % coverage with 100 Mbps download and 30 Mbps upload Poland 100 % coverage with 30 Mbps by 2020.
by 2020 50 % HH penetration with 100 Mbps service by 2020
Estonia 100 % coverage with 30 Mbps by 2020. Portugal 100 % coverage with 30 Mbps by 2020.
60 % HH penetration with 100 Mbps by 2020 50 % HH penetration with 100 Mbps service by 2020
Finland 99 % of all permanent residences and offices should be located Romania 80 % coverage with 30 Mbps by 2020.
within 2 km of an optic fibre network or cable network that 45 % HH penetration with 100 Mbps service by 2020
enables connections of 100 Mbps by 2019
France 100 % coverage with 30 Mbps by 2022 Slovakia 100 % coverage with 30 Mbps by 2020.
Greece 100 % coverage with 30 Mbps by 2020. Slovenia 96 % coverage with 100 Mbps, 4% coverage 30 Mbps by 2020.
50 % HH penetration with 100 Mbps by 2020
Germany 100 % coverage with 50 Mbps by 2018 Spain 100 % coverage with 30 Mbps by 2020.
50 % HH penetration with 100 Mbps service by 2020
Hungary 100 % coverage with 30 Mbps by 2018. Sweden 95 % coverage with 100 Mbps by 2020
50 % HH penetration with 100 Mbps service by 2020
Ireland 100 % coverage with 30 Mbps by 2020. United 95 % coverage with 24 Mbps by 2017
50 % HH penetration with 100 Mbps service by 2020, expecting Kingdom
upstream bandwidth around 17 to 21 Mbps.
Source: Atene KOM: Study on National Broadband Plans in the EU (SMART 2014/0077) – draft/ongoing.
Europe's Digital Progress Report 2017 – Connectivity 40Funding national broadband plans
In a number of cases, Member States have ERDF investment in broadband and digital networks in ESIF Operational Programmes (million EUR)
decided to use extensively the European
Investment and Structural Funds (ESIF) —
notably the ERDF and the EAFRD — for a
total programmed amount of over EUR 6
billion by 2020.
Countries like Poland and Italy plan to invest
more than a EUR 1 billion of ERDF each;
France, the Czech Republic, Spain and
Hungary are in a range of EUR 400 million to
EUR 700 million of ERDF each; Croatia, Greece
and Slovakia between EUR 200 million and
EUR 400 million of ERDF each.
For EAFRD, Italy has programmed the biggest
budget on broadband infrastructure amounting
nearly EUR 273 million. Germany and Sweden
have also allocated significant budget, around
EUR 223 million for Germany an EUR 157 for
Sweden. Investments from EAFRD planned
from the remaining thirteen Member States
range from EUR 65 to 0.3 million.
In addition, financial instruments, including the
European Fund for Strategic investments and
the forthcoming Connecting Europe Broadband
Fund, aim at maximising the leverage of public Source: European Commission, ICT monitoring Tool (http://s3platform.jrc.ec.europa.eu/ict-
funding dedicated to the roll-out the next monitoring).
generation of broadband networks.
Europe's Digital Progress Report 2017 – Connectivity 41You can also read