Acoustic Emission Characteristics and Energy Evolution of Red Sandstone Samples under Cyclic Loading and Unloading
←
→
Page content transcription
If your browser does not render page correctly, please read the page content below
Hindawi
Shock and Vibration
Volume 2021, Article ID 8849137, 15 pages
https://doi.org/10.1155/2021/8849137

Research Article
Acoustic Emission Characteristics and Energy Evolution of Red
Sandstone Samples under Cyclic Loading and Unloading

 Tianzuo Wang ,1,2,3 Chunli Wang ,1,2,3 Fei Xue ,1,2,3 Linxiang Wang ,1,2,3
 Beyene Hana Teshome ,1,2,3 and Mengya Xue 1,2,3
 1
 School of Civil Engineering, Shaoxing University, Shaoxing 312000, China
 2
 Key Laboratory of Rock Mechanics and Geohazards of Zhejiang Province, Shaoxing 312000, China
 3
 Zhejiang Collaborative Innovation Center for Prevention and Control of Mountain Geologic Hazards, Shaoxing 312000, China

 Correspondence should be addressed to Fei Xue; xuefei@usx.edu.cn

 Received 2 September 2020; Revised 23 January 2021; Accepted 31 January 2021; Published 10 February 2021

 Academic Editor: Paola Forte

 Copyright © 2021 Tianzuo Wang et al. This is an open access article distributed under the Creative Commons Attribution License,
 which permits unrestricted use, distribution, and reproduction in any medium, provided the original work is properly cited.
 To explore the characteristics of rock deformation and failure under cyclic loading and unloading, the MTS815 rock mechanics
 test system and acoustic emission (AE) signal acquisition system were used to perform cyclic loading and unloading tests on red
 sandstone samples. The results showed that, compared with the uniaxial compression test, cyclic loading and unloading had a
 certain strengthening effect on the strength of the samples. The plastic deformation of the rock samples increased as the number of
 cycles increased. Based on AE signals, the cracking mode classification was analyzed on the basis of the average frequency and the
 rise angle of the waveforms. It was observed that the Felicity ratio gradually decreased with the increase in the stress level, which
 showed a cumulative damage effect. From the perspective of energy, the obvious increase of AE energy rate was mainly
 concentrated in the early and late stages of uniaxial compression, while the significant increase of dissipated energy rate occurred
 in the late stage of uniaxial compression. During the cyclic loading and unloading, most of the work done by external forces in the
 compaction stage and the elastic stage was converted into elastic strain energy, and dissipated energy began to gradually increase
 in the stage of stable fracture development. In addition, it was found that the damage evolution of the rock samples changed from
 slow to fast, and the dissipated energy ratio increased when failure was approaching.

1. Introduction as materials engineering [7, 8], structural engineering [9, 10],
 mechanical equipment [11, 12], aerospace [13], and civil
Many engineering practices have shown that the rock mass is engineering [14, 15]. Kaiser [16] first discovered the phe-
often under an unstable state of repeated loading and nomenon of AE in engineering materials and proposed the
unloading during engineering construction, such as exca- “Kaiser effect” in 1953. Then, Goodman [17] verified the
vation and reinforcement of high slopes, underground Kaiser effect of rock AE through cyclic loading and
mining, and tunneling [1]. Existing studies have shown that unloading experiments in 1963. Thereafter, the study of AE
the strength and deformation laws of rocks under cyclic focusing on rocks has never stopped. Rudajev et al. [18]
loading are significantly different from those under revealed the AE characteristics of the rock failure process
monotonic loading [2, 3]. In recent years, the acoustic using a uniaxial compression test. Carpinteri et al. [19]
emission (AE) technique has been widely used in solving compared the AE frequency amplitude statistics of the solid
rock and soil mechanics problems. It can be used to con- during the damage process with the defect size distributions
tinuously monitor the development and destruction process of the disordered materials and found the key parameters
of microcracks in rock samples in real time [4] and provide that define the instability conditions of the monitored
precursor information on rock instability and failure [5, 6]. structure. Fu et al. [20] observed the Kaiser effect on Bra-
Thus, the AE technique was widely used in many fields such zilian splitting and bending tests of marble and established
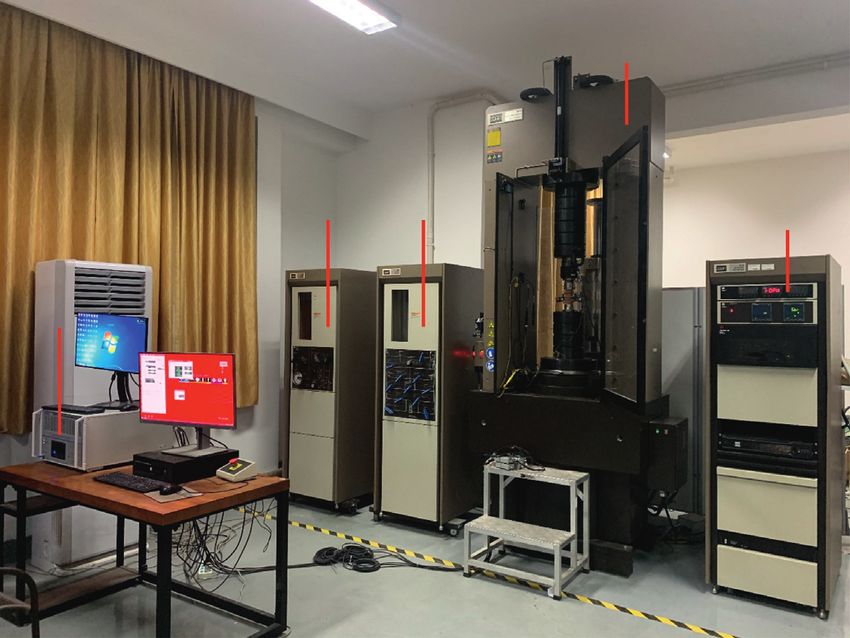
2 Shock and Vibration

the relationship between stress, strain, and AE. Meng et al. In summary, a great number of efforts have been ded-
[21] conducted uniaxial cyclic loading and unloading icated to the research on the mechanical properties, AE
compression at six different loading rates to investigate the characteristics, and energy evolution laws of the loaded rock.
energy accumulation, evolution, and dissipation charac- However, the cyclic loading and unloading effects have a
teristics and analyzed the stress-strain relationship and AE broad engineering background. It remains necessary to
characteristics of the rock deformation and failure process. study the AE characteristics and energy evolution laws of
Liang et al. [22] found the effect of cyclic loading and rocks under cyclic loading and unloading, which is helpful to
unloading on the mechanical properties of the rock in the explore the corresponding relationship between the damage
postpeak stage and proved that the deformation behavior of and destruction process of the loaded rock and the AE and
the rock was consistent with the AE parameters. Qin et al. energy. In this paper, cyclic loading and unloading tests of
[23] studied the mechanical properties and AE character- red sandstone samples were performed to mainly investigate
istics of sandstone under different loading paths and ana- the characteristics of AE and energy evolution in the entire
lyzed the macroscopic failure morphology through CT process of rock deformation and failure.
scanning and 3D image reconstruction. To explore the AE
characteristics of soft rock, Zhao et al. [24] performed cyclic 2. Experimental Procedures
loading and unloading AE tests on sandstone and mudstone,
respectively, and studied their deformation, failure char- 2.1. Sample Preparation. The red sandstone samples tested
acteristics, and the law of AE activities. Liu et al. [25] studied in the experiment were taken from Yueyang, Hunan
the AE characteristics of dry and saturated basalt columnar Province, China. The sandstone samples are maroon with
joints under uniaxial compression and analyzed tensile a fine grain structure and uniform texture. The main
damage, the damage situation, AE parameters, and rock’s mineral components are quartz, feldspar, calcite, and iron.
damage AE precursor information. Wang et al. [26] con- According to the international standards from the In-
ducted an in-depth study on the AE characteristics of granite ternational Society for Rock Mechanics (ISRM), the rock
under triaxial loading and discussed the types and devel- samples were processed into cylindrical standard samples
opment time of triaxial compression cracks. The destruction with a diameter of 50 mm and a height of 100 mm. The
of rock under cyclic loading is a dynamic evolution process parallelism of the upper and lower surfaces was controlled
from crack development and compression to structural within 0.05 mm, and the surface flatness was less than
adjustment and instability. It is inevitable to be accompanied 0.02 mm. The processed samples before the test were
by the generation of AE signals. Therefore, to better un- strictly screened to eliminate the samples with obvious
derstand the basic characteristics of rock damage and failure damages and cracks on the surface. Moreover, the samples
process, it is necessary to use the AE technique for real-time with abnormal wave speed and density were also elimi-
monitoring, which can contribute to a deep understanding nated through the ultrasonic test and density test. The red
of the damage and failure characteristics of rock samples sandstone samples in the test were grouped and num-
during cyclic loading and unloading. bered, as listed in Table 1.
 Meanwhile, the deformation and destruction of rocks are
driven by energy evolution activities from the energy per-
spective. This perspective includes energy input, storage, 2.2. Experimental System. The MTS815.04 rock mechanics
dissipation, and release, which are essentially energy con- test system manufactured by the American MTS company
version [27, 28]. It is an effective method to explore the rock was utilized in the test as the main loading equipment. The
failure problem under cyclic loading through the energy test system is composed of a loading system, a control
mechanism. Xie et al. [29, 30] explained the energy dissi- system, and a monitoring system. It is a multifunctional
pation mechanism in the process of rock deformation and electrohydraulic servo-controlled rigidity testing machine
failure from the thermodynamics perspective and proposed with excellent manual and program control functions,
a damage evolution equation based on energy dissipation especially used for rock and concrete experiments. It has
analysis. You and Hua [31] and Chen et al. [32] found that three independent closed-loop servo control functions for
the absorbed energy had a linear relationship with the axial pressure, confining pressure, and pore water pres-
confining pressure during rock failure. Carpinteri et al. [33] sure. The 12CHsPCI-2 AE test and analysis system pro-
analyzed the experimental results of compression tests on duced by the Physical Acoustic Corporation was
cylindrical specimens of different types of rocks and concrete simultaneously applied to track the AE characteristics of
from the perspective of the balance between the energy samples during the loading process, as shown in Figure 1.
stored, released, and absorbed during the complete loading A pair of axial and lateral extensometers was used for the
process. Zhang et al. [34] investigated the effect of the deformation measurement, and six AE sensors were
confining pressure on the energy evolution characteristics closely adhered to the rock sample to record AE signals, as
and distribution relations under triaxial cyclic loading and shown in Figure 2.
unloading experiments. Gong et al. [35, 36] selected various Combining previous research and experiments, it is
rock samples for uniaxial compression, loading and found that the sources of electromagnetic noises in the signal
unloading tests under different stress levels, and proposed a include flexing, twisting or transient impacting on coaxial
linear energy storage method and a rock burst tendency cables, the poor contact of the AE probe, and the influence of
criterion. the electromagnetic field generated by the external
Shock and Vibration 3

 Table 1: Red sandstone sample groups and loading modes. 2.3. Test Procedures. Uniaxial compression tests on samples
Samples Experimental type
 R-1, R-2, and R-3 were first conducted to obtain an ap-
 proximate uniaxial compressive strength, which can provide
R1
R2 Uniaxial compression
 a reference for the formulation of the cyclic loading and
R3 unloading test program. Next, the cyclic loading and
 unloading test adopted axial stress control mode with a
R4
R5 Cyclic loading and unloading loading rate of 0.25 MPa/s. The loading increment for each
R6 stage was set as 10 MPa. Each stage was first loaded to the
 preset value and then unloaded to 0 MPa. The above loading
 and unloading process was repeated until the red sandstone
 samples were fractured. The stress loading path was shown
 iv in Figure 3.

 3. Experimental Results and Analysis
 ii iii v 3.1. Strength and Deformation Characteristics Analysis.
 Figure 4 showed the stress-strain curves of rock samples in
 i uniaxial compression tests. The complete stress-strain curves
 of rock samples under uniaxial cyclic loading and unloading
 were shown in Figure 5.
 The average compressive strength of the rock samples
 under uniaxial compression was 74 MPa, while the average
 compressive strength of the rock samples under uniaxial
 cyclic loading and unloading was 78 MPa with an increase of
 5.4% compared to uniaxial compression. The rock sample
 used in the test was red sandstone in the natural state, and
Figure 1: MTS815 rock mechanics test system. (i) AE workstation. there were inevitably original cracks inside. Compared with
(ii) Confining pressure intensifier. (iii) Pore pressure intensifier the sample under uniaxial compression, there was only a
with permeability. (iv) Axial loading system. (v) Digital controller. microcrack compaction stage, while the microcracks inside
 the sample under cyclic loading were repeatedly pressed and
 closed. Thus, the compressive strength of the sample
 increased.
 Figures 4 and 5 show that the envelope line of the
 uniaxial cyclic loading and unloading curves was similar to
 that of the uniaxial loading curves, which reflected the
 deformation memory of rock material. Some scholars ob-
 tained similar conclusions in the study of red sandstone [37].
 ii In addition, the path of the unloading curve was not along
 the loading curve during uniaxial cyclic loading and
 i unloading but lower than the loading curve. The loading
 i
 curve and unloading curve did not coincide, forming a
 hysteresis loop, which was similar to a willow leaf with a
 wide middle part and sharp ends. When it was unloaded to
 iii
 0 MPa, certain irreversible plastic deformation was gener-
 ated. The elastic deformation recovered after each unload-
 ing, and the hysteresis loop continuously migrated forward.
 The area of the hysteresis loop was also gradually increased,
 indicating that the plastic deformation of the sample under
 cyclic loading and unloading would increase with the in-
 crease of the number of cycles.

Figure 2: Rock sample. (i) Axial extensometer. (ii) AE sensor. (iii)
Lateral extensometer. 3.2. AE Characteristics of Rock Samples under Uniaxial
 Compression. The AE generated by the loaded rock was
 mainly related to the generation, expansion, and connection
environment. And it was also proved that most of the noise of cracks, which can be used to reflect the internal damage of
interference can be effectively filtered out by setting a the rock. Figures 6 and 7 showed the curves of AE energy, AE
threshold of 40 dB. Therefore, 40 dB was set as the threshold count, and axial stress with respect to the loading time. AE
in this experiment to avoid false signals generation. energy was derived from the integral of the squared voltage
4 Shock and Vibration

 160 6000 D 80
 140 70
 5000
 120
 60
 Axial force (KN)

 100
 4000
 C 50

 AE energy (aJ)
 80

 Stress (MPa)
 E
 60 3000 40
 40
 30
 2000
 20
 20
 0
 t1 t2 t3 t4 t5 t6 t7 t8 1000
 B 10
 Time (s) A
 0 0
 Figure 3: Stress loading path. 0 200 400 600 800 1000 1200 1400
 Time (s)
 90
 AE energy
 Stress
 80
 Figure 6: Relationships among AE energy, loading stress, and
 70 loading time of rock samples under the uniaxial compression tests.
 60
Stress (MPa)

 50
 300 80
 D
 40
 70
 250
 30
 60
 20 200 C 50

 Stress (MPa)
 AE count

 10 E
 150 40
 0
 30
 0.000 0.001 0.002 0.003 0.004 0.005 0.006 0.007 100
 Strain 20
 R-1 50
 R-2 10
 B
 R-3 A
 0 0
Figure 4: Stress-strain curves of rock samples in uniaxial com- 0 200 400 600 800 1000 1200 1400
pression tests. Time (s)
 AE count
 Stress
 90
 Figure 7: Relationships among AE count, loading stress, and
 80
 loading time of rock samples under the uniaxial compression tests.

 70
 signal divided by the reference resistance (10 k-ohm) over
 60
 the duration of the AE waveform packet. It can be used as a
 Stress (MPa)

 50 characteristic value to characterize the true energy of AE
 impact. AE count was obtained by counting the number of
 40 AE signal excursions exceeding the AE threshold. The above
 30 parameters were directly exported through AEwin for PCI2
 software.
 20 Figures 6 and 7 showed that the stress-time curves of the
 10
 rock samples can be roughly divided into four stages based
 on the distribution characteristics of the AE energy and
 0 count. Section AB was the pore and fissure compaction
 0.000 0.002 0.004 0.006 0.008 0.010 0.012 0.014 0.016 0.018 stage, during which the stress-time curve showed an upward
 Strain concave shape. Only a few AE events occurred at this stage,
Figure 5: Complete stress-strain curves of rock samples under and the AE energy was relatively low. The AE at this stage
uniaxial cyclic loading and unloading. was mainly generated by the compression of the initial crack
Shock and Vibration 5

inside the rock sample. Section BC was the linear elastic Different crack modes were accompanied by AE signals
stage of the rock sample, with the stress-time curve being with different characteristics. The average frequency (AF)
approximately linear. Since this process was mainly elastic and the rise angle of the waveforms (RA) were often used
deformation and there was little microcrack propagation, to analyze the crack mode of the rock samples [38, 39].
AE count and energy remained basically calm. In section Figures 10(a)–10(c) showed the curves of RA value, AF
CD, the rock sample entered the plastic stage of unsteady value, and stress with respect to loading time under the
fracture development. Point C was the yield point. The AE cyclic loading and unloading of rock samples R-4, R-5,
began to gradually increase, and new cracks were contin- and R-6. Figures 11(a)–11(c) were the distribution dia-
uously generated inside the rock sample. The development of gram of the RA-AF relationship under the uniaxial cyclic
microfracture has qualitatively changed, and the rupture loading and unloading compression of rock samples R-4,
continued to develop until the sample was completely R-5, and R-6.
fractured, resulting in the fact that AE count and energy As shown in Figure 10, at the initial stage of loading and
drastically increased to the highest value. Section DE was the unloading, the internal cracks in the rock samples gradually
postfailure stage. The bearing capacity of the rock sample closed, resulting in the phenomenon of high RA and low AF.
rapidly decreased. At this time, the microfracture was co- At this time, shear stress played a major role in the rock
alesced to form a macroscopic fracture surface. AE count still samples. Subsequently, the phenomenon of high AF and low
appeared after the rock sample fractured and reached a large RA appeared during the second to the seventh cycle of
value, but there was no specific law. loading. It can be inferred that tensile stress was the main
 stress during this period and a large number of microcracks
 began to appear. The microcracks were connected with each
3.3. AE Characteristics of Rock Samples under Cyclic Loading other, and the damage inside the rock samples gradually
and Unloading. The process of cyclic loading and unloading accumulated. At the same time, the RA value had an upward
of rocks was accompanied by the compaction of primary trend as the stress increased. When the critical failure oc-
fissures and the generation of new fissures. New cracks in the curred, both RA value and AF value increased to the
rock were continuously generated, developed, expanded, maximum, and macroscopic cracks appeared under the
and penetrated with the increase in the number of cycles. combined action of tensile stress and shear stress. In ad-
Meanwhile, it was accompanied by the continuous gener- dition, it can be seen from Figure 11 that the distribution of
ation of AE signals. Figures 8(a)–8(c) showed the curves of RA-AF had changed from dense to scattered. The rock
the AE energy and stress with time under the cyclic loading samples had obvious characteristics of low RA and high AF,
and unloading of rock samples R-4, R-5, and R-6. indicating that the tensile failure of the rock samples was
Figures 9(a)–9(c) showed the curves of the AE count and more significant.
stress with time under the cyclic loading and unloading of
rock samples R-4, R-5, and R-6.
 In Figures 8 and 9, the stress level in the initial cycle was 3.4. Change of AE Felicity Ratio in Cyclic Loading and
relatively low. The rock samples were in the compacting Unloading. The AE phenomenon reflected the development
stage of primary fissures. New cracks were not produced, and expansion degree of microcracks in rocks; that is, it was
and the number of AE signals was small. The stress level the manifestation of its internal damage. Figures 8 and 9
further increased with the increase of the number of cycles, showed that there was a significant increase in AE even when
and new cracks began to appear in the rock samples. The AE the stress level was lower than the previous maximum stress
energy was released as a result of the development and level. This result reflected the Felicity effect of the AE
coalescence of cracks. The AE activity gradually entered the phenomenon of the rock under uniaxial cyclic loading and
active period and reached the maximum at the last loading unloading, which showed the irreversibility of the AE
and unloading failure. In addition, the AE count was ba- [40, 41]. To better describe the irreversibility of rock samples,
sically consistent with the change in AE energy. The AE the Felicity effect was introduced. Felicity ratio is a measure
count and AE energy significantly increased from the fourth of rock damage and defined as
cycle. The preset stress for the fourth cycle was 40 MPa, σi
which was approximately 54% of the uniaxial compressive RF (i) � , (1)
 σ i−1(max)
strength. Therefore, when the samples were loaded to 54% of
the compressive strength, the damage continued to accu- where RF (i) is the Felicity ratio of the ith loading-unloading
mulate and eventually led to internal failure. Meanwhile, the cycle, σ i is the stress level when AE rings begin to signifi-
rock samples entered the plastic deformation stage with the cantly increase in the ith loading-unloading cycle, and
release of a considerable amount of AE energy. The internal σ i−1(max) is the maximum stress level in the (i − 1)th loa-
cracks in the rock samples have developed and penetrated to ding-unloading cycle.
form macroscopic cracks at the critical failure load. In the study of the Felicity effect ratio, there was no
Unloading opened the fracture surface of the internal mi- uniform standard for the significantly increased AE.
crostructure of the rock samples, which made the unloading According to the guiding principle recommended by CARP,
process accompanied by more AE events. AE count above 20 was studied as the basic value [42].
 The deformation and fracture process of rock included Figure 12 showed the change in Felicity ratio with the
shear crack, tension crack, and tension-shear mixed crack. number of cycles.
6 Shock and Vibration

 18000 80

 16000 70

 14000
 60
 12000
 50

 AE energy (aJ)

 Stress (MPa)
 10000
 40
 8000
 30
 6000
 20
 4000

 2000 10

 0 0
 0 500 1000 1500 2000 2500 3000
 Time (s)

 AE energy
 Stress
 (a)
 18000 80

 16000 70

 14000
 60
 12000
 50
 AE energy (aJ)

 Stress (MPa)
 10000
 40
 8000
 30
 6000
 20
 4000

 2000 10

 0 0
 0 500 1000 1500 2000 2500 3000
 Time (s)

 AE energy
 Stress

 (b)
 18000 80

 16000 70

 14000
 60
 12000
 50
 AE energy (aJ)

 Stress (MPa)

 10000
 40
 8000
 30
 6000
 20
 4000

 2000 10

 0 0
 0 500 1000 1500 2000 2500 3000
 Time (s)

 AE energy
 Stress

 (c)

Figure 8: Relationships among AE energy, loading stress, and monitoring time of rock samples under the uniaxial cyclic loading and
unloading compression: (a) graph of rock sample R-4, (b) graph of rock sample R-5, and (c) graph of rock sample R-6.
Shock and Vibration 7

 300 80 300 80

 70 70
 250 250
 60 60
 200 200
 50 50

 Stress (MPa)

 Stress (MPa)
 AE count

 AE count
 150 40 150 40

 30 30
 100 100
 20 20
 50 50
 10 10

 0 0 0 0
 0 500 1000 1500 2000 2500 3000 0 500 1000 1500 2000 2500 3000
 Time (s) Time (s)
 AE count AE count
 Stress Stress
 (a) (b)
 300 80

 70
 250
 60
 200
 50

 Stress (MPa)
 AE count

 150 40

 30
 100
 20
 50
 10

 0 0
 0 500 1000 1500 2000 2500 3000
 Time (s)

 AE count
 Stress
 (c)

Figure 9: Relationships among AE count, loading stress, and monitoring time of rock samples under the uniaxial cyclic loading and
unloading compression: (a) graph of rock sample R-4, (b) graph of rock sample R-5, and (c) graph of rock sample R-6.

 Figure 12 showed that the Felicity ratio decreased with characteristic of the rock samples showed the Kaiser effect,
the increase of the number of cycles, indicating that the and the damage degree was extremely low. The rock samples
internal damage degree of the rock samples had been in- entered the plastic deformation stage when the stress level
creasing. As a result, the degree of irreversibility of AE of further increased. The cracks inside the rock samples con-
rock samples continued increasing, which reflected the tinued to develop and penetrate and the internal damage
cumulative effect of rock damage. Felicity ratio was greater continued to accumulate. Felicity ratio significantly de-
than 1 at the initial stage of low stress. It showed that the rock creased from 1.05 to 0.55 after the third cycle. The average
samples were in the compaction stage. The pores and Felicity ratio of the rock samples was 0.54 in the seventh
microcracks in the rock samples were gradually closed to cycle. The damage degree was severe due to the stable de-
generate AE signals, and the damage degree was relatively velopment of cracks in the rock samples. The Felicity ratio
low at this time. Felicity ratio gradually decreased with the maintained a decreasing trend after the seventh cycle, but the
increase of the stress level. For example, for R-4, the ratio decreasing trend became slow. At this moment, the rock
decreased from the initial value of 1.27 to 1.05 after the samples were in the failure stage. The internal cracks rapidly
second cycle. R-4 entered the elastic deformation stage after expanded and the corresponding damage degree was
the compaction stage, with a low stress level. The AE maximal.
8 Shock and Vibration

 270 12 80 270 12 80
 240 70 240 70
 10 10
 210 60 210 60
 180 8 180 8
 50 50

 Stress (MPa)
 Stress (MPa)

 RA (ms/V)
 RA (ms/V)

 AF (kHz)
 AF (kHz)

 150 150
 6 40 6 40
 120 120
 30 30
 90 4 90 4
 60 20 60 20
 2 2
 30 10 30 10
 0 0 0 0 0 0
 0 500 1000 1500 2000 2500 3000 0 500 1000 1500 2000 2500 3000
 Time (s) Time (s)
 RA RA
 AF AF
 (a) (b)
 270 12 80
 240 70
 10
 210 60
 180 8
 50

 Stress (MPa)
 RA (ms/V)
 AF (kHz)

 150
 6 40
 120
 30
 90 4
 60 20
 2
 30 10
 0 0 0
 0 500 1000 1500 2000 2500 3000
 Time (s)
 RA
 AF
 (c)

Figure 10: Relationships between RA value, AF value, loading stress, and loading time of rock samples under the uniaxial cyclic loading and
unloading compression: (a) graph of rock sample R-4, (b) graph of rock sample R-5, and (c) graph of rock sample R-6.

 450 450

 400 400

 350 350

 300 300
 AF (kHz)

 AF (kHz)

 250 250

 200 200

 150 150

 100 100

 50 50

 0 0
 0 50 100 150 0 50 100 150
 RA (ms/V) RA (ms/V)
 (a) (b)
 Figure 11: Continued.
Shock and Vibration 9

 450

 400

 350

 300

 AF (kHz)
 250

 200

 150

 100

 50

 0
 0 50 100 150
 RA (ms/V)
 (c)

Figure 11: Distribution diagram of RA-AF relationship under the uniaxial cyclic loading and unloading compression: (a) graph of rock
sample R-4, (b) graph of rock sample R-5, and (c) graph of rock sample R-6.

 1.4 elastic strain energy stored inside, which caused the un-
 consumed part of the energy to be emitted suddenly,
 1.2 resulting in the dynamic vibration and propagation of elastic
 waves. The schematic diagram of the snap-back phenome-
 1.0 non was shown in Figure 13. This emitted energy can be
 detected by the AE sensors.
 According to the calculation method of dissipated en-
Felicity ratio

 0.8
 ergy rate in the article [43], the calculation steps were listed
 0.6
 as follows:
 (i) It was necessary to find the elastic limit in the
 0.4 uniaxial load-displacement curve.
 (ii) According to the elastic limit, the corresponding
 0.2 time point in the load-time diagram was found, and
 it was subdivided from this time point.
 0.0
 1 2 3 4 5 6 7 8 (iii) Each subdivision time point corresponded to a load,
 Cycle index and the corresponding load value returned to the
 load-displacement curve.
 R-4
 R-5 (iv) Dissipated energy rate was defined by line segments
 R-6 parallel to elastic branches, as shown in the shaded
 part.
Figure 12: Variation of Felicity ratio with increasing loading stress.
 The schematic diagram of calculating the dissipated
 energy rate was shown in Figure 14. The curve of dissipated
4. Analysis of Energy Evolution Characteristics energy rate and AE energy rate with respect to loading time
 was depicted in Figure 15.
4.1. Calculation of Energy under Uniaxial Compression. As illustrated in Figure 15, the dissipated energy rate and
AE technique can be used to obtain information on the form AE energy rate had different change trends. At the beginning
of energy release and the development of crack modes. of loading, the natural fractures of the rock samples were
Recent studies [43–45] have shown that there is a certain gradually compacted, and the weak elastic waves continued
relationship between crack propagation and emitted energy. to be released as the fractures closed. Thus, there was an
In this experimental study, it was found that the red obvious increase in the AE energy rate at this time.
sandstone also had a snap-back phenomenon after the peak Thereafter, it entered the stage of elastic deformation. The
stress under the uniaxial compression, and a lot of AE ac- AE entered a quiet period, while a lower dissipated energy
tivities would occur during this instability period. The rate appeared. When the rock samples entered the plastic
phenomenon was due to the fact that the dissipation through stage, new cracks were constantly produced inside the rock
rock material damage was not enough to dissipate all the samples. More high-energy AE signals can be collected
10 Shock and Vibration

 Peak stress
 σ
 Emitted energy

 ε
 Figure 13: Schematic diagram of the snap-back phenomenon.
 Load (kN)

 Load (kN)

 1
 3

 2
 4
 Times (s) Displacement (mm)
 Figure 14: Schematic diagram of calculating dissipation energy rate [43].

 rock samples were rapidly expanding, with the rock samples
 0.0015 120 being seriously damaged. When the dissipated energy rate
 and the AE energy rate reached the maximum value, the
 0.0012 cracks in the rock samples rapidly developed and penetrated,
Dissipated energy rate (J/s)

 90 and the rock samples were greatly damaged.
 AE energy rate

 0.0009
 60 4.2. Calculation of Energy under Cyclic Loading and
 Unloading. In the process of test loading, the work done by
 0.0006
 the external load on the rock during the entire cyclic
 30 loading and unloading process is the total work. According
 0.0003 to the law of conservation of energy, the rock and the
 outside environment are constantly exchanging energy
 0.0000 0 during the entire loading and unloading process, which
 0 200 400 600 800 1000 converts the work done by the external load into elastic
 Time(s) strain energy and dissipation energy. As shown in Fig-
 Dissipated energy rate ure 16, the area sandwiched between the lower part of
 AE energy rate loading curve OA and the x-axis is the total work done by
 the external load, that is, input energy density E. The area
Figure 15: Relationships among dissipated energy rate, AE energy
 between the bottom of the unloading curve AB and the x-
rate, and loading time of rock samples under uniaxial compression.
 axis is elastic energy density Ee released by the rock sample.
 The total work done by the external load minus the elastic
gradually, indicating that the rock samples have begun to deformation energy of the rock sample is the dissipated
deteriorate at this stage. It can be seen that the dissipated energy density Ed , which is the area between the loading
energy rate and AE energy rate increased sharply in the late and unloading curves, as shown in the shaded part of OAB.
loading stage, indicating that the internal fractures of the The energy density E can be defined as
Shock and Vibration 11

 Table 2: Energy calculation results of R-4.
 σ
 σ (MPa) Ee (MJ/mm3) Ed (MJ/mm3) Re Rd
 10 0.0023 0.0013 0.6404 0.3596
 A 20 0.0103 0.0052 0.6639 0.3361
 30 0.0222 0.0092 0.7073 0.2927
 40 0.0383 0.0149 0.7203 0.2797
 50 0.0579 0.0223 0.7223 0.2777
 60 0.0841 0.0329 0.7190 0.2810
 Ed 70 0.1180 0.0470 0.7154 0.2846
 Ee

 Table 3: Energy calculation results of R-5.
 σ (MPa) Ee (MJ/mm3) Ed (MJ/mm3) Re Rd
 10 0.0024 0.0015 0.6088 0.3912
 O B ε 20 0.0106 0.0057 0.6509 0.3491
 30 0.0222 0.0106 0.6768 0.3232
 Figure 16: Diagram of an energy density calculation. 40 0.0380 0.0164 0.6983 0.3017
 50 0.0584 0.0226 0.7210 0.2790
 60 0.0838 0.0340 0.7114 0.2886
 E � E e + Ed , (2) 70 0.1164 0.0506 0.6970 0.3030

where E is the input energy density, MJ/mm3; Ee is the elastic
energy density, MJ/mm3; Ed is the dissipated energy density,
MJ/mm3. Elastic energy density Ee and dissipated energy
density Ed released by the rock sample in each cycle can be Table 4: Energy calculation results of R-6.
calculated by calculating the area. σ (MPa) Ee (MJ/mm3) Ed (MJ/mm3) Re Rd
 10 0.0023 0.0017 0.5704 0.4296
 20 0.0103 0.0060 0.6319 0.3681
4.3. Energy Evolution Law of Rock Samples. According to the 30 0.0219 0.0110 0.6653 0.3347
above energy calculation method and test curve, the elastic 40 0.0381 0.0163 0.7007 0.2993
energy density and dissipated energy density of the three 50 0.0582 0.0236 0.7120 0.2880
rock samples were calculated and shown in Tables 2–4. The 60 0.0839 0.0329 0.7184 0.2816
proportion of elastic energy density Ee to input energy 70 0.1161 0.0519 0.6911 0.3089
density E is defined as elastic energy ratio Re . The ratio of
dissipated energy density Ed to input energy density E is
defined as dissipated energy ratio Rd ; equations (3) and (4) converted into elastic energy and stored in the rock samples
are as follows: during the compaction and elastic stages. In addition, the
 Ee dissipated energy density of the three rock samples first
 Re � , (3) slowly increased with the increase of the loading stress. The
 E
 dissipated energy density began to gradually increase when
 Ed the microcracks in the rock samples gradually generated,
 Rd � . (4) developed, steadily expanded, and entered the stage of stable
 E
 fracture development. The dissipated energy density of the
 Figures 17(a)–17(c) are drawn from the data in rock samples increased in a positive correlation with the
Tables 2–4, which were the development curves of the elastic increase of the loading stress, indicating that a greater
energy density and dissipated energy density at different loading stress corresponded to a greater dissipation energy.
stages of rock samples R-4, R-5, and R-6. The internal cracks in the rock samples had penetrated and
 In Figures 17(a)–17(c), the three samples had very formed macroscopic cracks when the rock samples were
similar change trends of elastic energy density. The curves close to failure. A lot of energy was consumed in the process
were relatively gentle and showed a nonlinear growth with a and the dissipation energy density significantly increased.
relatively slow growth rate in the initial compaction stage, as The elastic energy stored in the rock samples at the initial
the elastic energy density stored in the rock samples was stage was released in a large amount and converted into
gradually released during unloading. The rock samples dissipated energy. When the rock samples were finally
entered the linear elastic stage after the compaction stage, broken, a crisp sound was made.
during which the elastic energy density was released again
during unloading. It showed a linear growth with a faster
growth rate. The elastic energy density reached the maxi- 4.4. Energy Distribution Law of Rock Samples. Energy dis-
mum and began to release when the stress was maximal. sipation will cause damage to the rock, and energy release is
Thus, most of the work done by the external force was the inherent reason for the sudden destruction of the entire
12 Shock and Vibration

 0.14 0.06 0.14 0.06

 Dissipated energy density (MJ/mm3)

 Dissipated energy density (MJ/mm3)
 Elastic energy density (MJ/mm3)

 Elastic energy density (MJ/mm3)
 0.12 0.05 0.12 0.05
 0.10 0.10
 0.04 0.04
 0.08 0.08
 0.03 0.03
 0.06 0.06
 0.02 0.02
 0.04 0.04

 0.02 0.01 0.02 0.01

 0.00 0.00 0.00 0.00
 0 10 20 30 40 50 60 70 0 10 20 30 40 50 60 70
 Stress (MPa) Stress (MPa)
 Elastic energy density Elastic energy density
 Dissipated energy density Dissipated energy density
 (a) (b)
 0.14 0.06

 Dissipated energy density (MJ/mm3)
 Elastic energy density (MJ/mm3)

 0.12 0.05
 0.10
 0.04
 0.08
 0.03
 0.06
 0.02
 0.04

 0.02 0.01

 0.00 0.00
 0 10 20 30 40 50 60 70
 Stress (MPa)
 Elastic energy density
 Dissipated energy density
 (c)

Figure 17: Development curve of the elastic energy density and dissipated energy density at different loading stages: (a) graph of rock
sample R-4, (b) graph of rock sample R-5, and (c) graph of rock sample R-6.

 0.75 0.44

 0.42

 0.40
 0.70
 Dissipated energy ratio

 0.38
Elastic energy ratio

 0.36
 0.65
 0.34

 0.32
 0.60 0.30

 0.28

 0.55 0.26
 0 10 20 30 40 50 60 70 80 0 10 20 30 40 50 60 70 80
 Stress (MPa) Stress (MPa)

 R-4 R-4
 R-5 R-5
 R-6 R-6

Figure 18: Relation curves between elastic energy ratio and axial Figure 19: Relation curves between dissipated energy ratio and
stress. axial stress.
Shock and Vibration 13

rock [46, 47]. To better explore the changes in energy during
the deformation and failure process of red sandstone 1.0
samples under cyclic loading and unloading, the changes in
elastic energy ratio and dissipated energy ratio were ana-
 0.8
lyzed. Figures 18 and 19 were obtained from the data in

 Damage variable
Tables 2–4, which showed the relationships between elastic
energy ratio, dissipated energy ratio, and axial stress. 0.6
 The elastic energy ratio nonlinearly changed with the
stress during the cyclic loading and unloading process of the
red sandstone samples. In the initial stage of loading, the 0.4
elastic energy ratio sharply increased with the increase in
stress. The crack entered the stage of stable propagation 0.2
when the axial stress approached approximately 40% of the
peak strength, and the growth rate of the elastic energy ratio
gradually decreased. Then the crack entered the stage of 0.0
unstable crack propagation when the load reached the peak 0 1 2 3 4 5 6 7 8
 Cycles
strength level of 65∼80%, and the growth rate of elastic
energy ratio further decreased. The elastic energy ratio R-4
slightly decreased near the failure of the samples. However, R-5
the dissipated energy ratio had been decreasing before the R-6
failure, and it had a slight increase as it approached failure. Figure 20: Variation of damage variable with the number of cycles.
 Most of the work done by external forces had been
converted into elastic energy at the initial stage of loading, where D(i) is a single-cycle damage variable; Ud(i) is the
but the difference between the two was very small due to the dissipated energy of single-cycle loading and unloading; Ud
microcrack closure inside the samples, and the friction and is the total dissipated energy of destruction under cyclic
the slip among particles consumed a lot of energy. It entered loading and unloading; D is the cumulative damage variable;
the linear elastic deformation stage and stable development i is the number of cycles.
stage of microfracture as the axial stress increased, and most From the above figure, it was found that the damage
of the pores in the rock samples have been compacted. evolution of the rock samples changed from slow to fast. Due
Meanwhile, new microcrack initiation resulted in the dis- to the slow development of internal cracks in the rock
sipation of a small amount of energy. The microcracks inside samples at the beginning of loading, the damage variable
the rock samples expanded, connected, and formed mac- basically increased at a uniform low rate. When loaded to the
rocracks as the failure approaches, which must consume fifth cycle, the damage accounted for 37% of the total
more dissipated energy so that the dissipated energy ratio damage, and the damage of the rock samples started to grow
increased. faster. As the cracks inside the rock samples developed and
 connected, the growth rate of the damage variable was
 further accelerated, indicating that the degree of rock
4.5. Analysis of Damage Evolution Based on Dissipated damage became more serious. When the load reached the
Energy. The internal microcracks of the loaded rock were seventh cycle, the internal cracks were connected to each
first compacted, then reextended, and penetrated until it was other, and the degree of rock damage was close to failure.
fractured. The whole process was always accompanied by Subsequently, the damage variable reached its maximum
energy release and dissipation and always followed the law of value, and the rock samples were completely destabilized
conservation of energy. The energy dissipated during the and destroyed.
loading process was mainly used to form damage and caused
the loss of rock strength. This paper defined the damage
variable based on the irreversible dissipated energy during 5. Conclusions
the deformation of the rock material [46], aiming to study
 In this paper, the cyclic loading and unloading tests were
the characteristics of damage evolution during the defor-
 performed to comprehensively understand the deformation
mation and failure of red sandstone under cyclic loading and
 and strength characteristics of red sandstone under cyclic
unloading conditions. Its definition is listed as equations (5)
 loading and unloading from the perspective of AE and
and (6). The change curve of damage variable with loading
 energy theory. The following conclusions are obtained:
time is shown in Figure 20.
 Ud(i) (1) Compared with the compaction stage where there
 D(i) � , (5) were only microcracks in the uniaxial compression
 Ud test, the microcracks inside the samples were re-
 peatedly closed under the action of cyclic loading
 i i
 Ud(i) and unloading, which had a certain strengthening
 D � D(i) � , (6)
 1 1 Ud effect on the compressive strength of the rock
 samples.
14 Shock and Vibration

 (2) When the number of loading cycles increased, the [2] K. Fuenkajorn and D. Phueakphum, “Effects of cyclic loading
 hysteresis loop continuously migrated forward on mechanical properties of Maha Sarakham salt,” Engi-
 during the cyclic loading and unloading process of neering Geology, vol. 112, no. 1-4, pp. 43–52, 2010.
 the rock samples. It gradually moved in the direction [3] N. Erarslan and D. J. Williams, “Investigating the effect of
 of increasing stress, and its area was increased, in- cyclic loading on the indirect tensile strength of rocks,” Rock
 dicating that the plastic deformation of rock samples Mechanics and Rock Engineering, vol. 45, no. 3, pp. 327–340,
 2012.
 increased with the increase of the number of cycles.
 [4] S. Kramadibrata, G. M. Simangunsong, K. Matsui, and
 (3) The AE count and AE energy significantly increased H. Shimada, “Role of acoustic emission for solving rock
 when the load reached 54% of the compressive engineering problems in Indonesian underground mining,”
 strength of the rock samples. The damage continued Rock Mechanics and Rock Engineering, vol. 44, no. 3,
 to accumulate, which caused internal damage. pp. 281–289, 2011.
 Through the analysis of changes in RA and AF, it was [5] V. Vishal, P. G. Ranjith, and T. N. Singh, “An experimental
 found that tensile failure in the rock samples was investigation on behaviour of coal under fluid saturation,
 more significant under cyclic loading and unloading. using acoustic emission,” Journal of Natural Gas Science and
 The Felicity ratio continuously decreased with the Engineering, vol. 22, pp. 428–436, 2015.
 increase of the stress level. The degree of internal [6] E. A. Novikov, R. O. Oshkin, V. L. Shkuratnik, S. A. Epshtein,
 damage of the rock sample was gradually accumu- and N. N. Dobryakova, “Application of thermally stimulated
 acoustic emission method to assess the thermal resistance and
 lating, which made the irreversible degree of AE of
 related properties of coals,” International Journal of Mining
 rock samples continue to increase.
 Science and Technology, vol. 28, no. 2, pp. 243–249, 2018.
 (4) The dissipated energy rate and the AE energy rate [7] W. Q. Han, Y. Luo, A. J. Gu, and F. G. Yuan, “Damage modes
 under uniaxial compression had different changes. recognition and Hilbert-Huang transform analyses of CFRP
 In the cyclic loading and unloading test, most of the laminates utilizing acoustic emission technique,” Applied
 work done by external forces was converted into Composite Materials, vol. 23, no. 2, pp. 155–178, 2016.
 elastic energy and stored inside the rock samples in [8] P. V. Vara and R. J. Nageswara, “A review on acoustic
 the compaction and elastic stages of rock loading. emission characterization of failure modes of carbon fiber
 The dissipation energy slowly increased with the reinforced composites,” Advanced Materials Research,
 stress at the beginning, and it significantly increased vol. 1148, pp. 43–47, 2018.
 [9] M. Rabiei and M. Modarres, “Quantitative methods for
 when the rock samples were near the failure. The
 structural health management using in situ acoustic emission
 elastic energy ratio slightly decreased when the
 monitoring,” International Journal of Fatigue, vol. 49,
 samples were close to failure, while the dissipated pp. 81–89, 2013.
 energy ratio changed in the opposite manner. Based [10] T. Fu, Y. Liu, Q. Li, and J. Leng, “Fiber optic acoustic emission
 on the damage analysis of the dissipated energy, it sensor and its applications in the structural health monitoring
 was found that the damage evolution of rock samples of CFRP materials,” Optics and Lasers in Engineering, vol. 47,
 changed from slow to fast during cyclic loading and no. 10, pp. 1056–1062, 2009.
 unloading. [11] T. Toutountzakis and D. Mba, “Observations of acoustic
 emission activity during gear defect diagnosis,” NDT & E
Data Availability International, vol. 36, no. 7, pp. 471–477, 2003.
 [12] M. Elforjani and D. Mba, “Accelerated natural fault diagnosis
The data used to support the findings of this study are in- in slow speed bearings with Acoustic Emission,” Engineering
cluded within the article. Fracture Mechanics, vol. 77, no. 1, pp. 112–127, 2010.
 [13] K. M. Holford, M. J. Eaton, J. J. Hensman et al., “A new
 methodology for automating acoustic emission detection of
Conflicts of Interest metallic fatigue fractures in highly demanding aerospace
 environments: an overview,” Progress in Aerospace Sciences,
The authors declare that they have no conflicts of interest.
 vol. 90, pp. 1–11, 2017.
 [14] A. Carpinteri, G. Lacidogna, and N. Pugno, “Structural
Acknowledgments damage diagnosis and life-time assessment by acoustic
 emission monitoring,” Engineering Fracture Mechanics,
The authors would like to acknowledge the financial support vol. 74, no. 1-2, pp. 273–289, 2007.
for this study provided by the National Natural Science [15] D. Li, C. Hai, and O. Jinping, “Fracture behavior and damage
Foundation of China (Grant no. 41831290) and the Natural evaluation of polyvinyl alcohol fiber concrete using acoustic
Science Foundation of Zhejiang Province (Grant no. emission technique,” Materials & Design, vol. 40, pp. 205–211,
LQ20E080006). 2012.
 [16] J. Kaiser, “Erkenntnisse und Folgerungen aus der Messung
References von Geräuschen bei Zugbeanspruchung von metallischen
 Werkstoffen,” Archiv Für Dassenhüttenwesen, vol. 24, no. 1-2,
 [1] D. Li, Z. Sun, T. Xie, X. Li, and P. G. Ranjith, “Energy pp. 43–45, 1953.
 evolution characteristics of hard rock during triaxial failure [17] R. E. Goodman, “Subaudible noise during compression of
 with different loading and unloading paths,” Engineering rocks,” Geological Society of America Bulletin, vol. 74, no. 4,
 Geology, vol. 228, pp. 270–281, 2017. pp. 487–490, 1963.
Shock and Vibration 15

[18] V. Rudajev, J. Vilhelm, and T. Lokajı́ček, “Laboratory studies released and acoustic emission energies,” Engineering Failure
 of acoustic emission prior to uniaxial compressive rock Analysis, vol. 33, pp. 236–250, 2013.
 failure,” International Journal of Rock Mechanics and Mining [34] M. Zhang, Q. Meng, and S. Liu, “Energy evolution charac-
 Sciences, vol. 37, no. 4, pp. 699–704, 2000. teristics and distribution laws of rock materials under triaxial
[19] A. Carpinteri, G. Lacidogna, G. Niccolini, and S. Puzzi, cyclic loading and unloading compression,” Advances in
 “Critical defect size distributions in concrete structures de- Materials Science and Engineering, vol. 2017, pp. 1–16, 2017.
 tected by the acoustic emission technique,” Meccanica, vol. 43, [35] F. Q. Gong, J. Y. Yan, and X. B. Li, “A new criterion of rock
 no. 3, pp. 349–363, 2008. burst proneness based on the linear energy storage law and the
[20] X. Fu, Q. Xie, and L. Liang, “Comparison of the Kaiser effect in residual elastic energy index,” Chinese Journal of Rock Me-
 marble under tensile stresses between the Brazilian and chanics and Engineering, vol. 37, no. 9, pp. 1993–2014, 2018.
 bending tests,” Bulletin of Engineering Geology and the En- [36] F. Gong, J. Yan, S. Luo, and X. Li, “Investigation on the linear
 vironment, vol. 74, no. 2, pp. 535–543, 2015. energy storage and dissipation laws of rock materials under
[21] Q. Meng, M. Zhang, L. Han, H. Pu, and T. Nie, “Effects of uniaxial compression,” Rock Mechanics and Rock Engineering,
 acoustic emission and energy evolution of rock specimens vol. 52, no. 11, pp. 4237–4255, 2019.
 under the uniaxial cyclic loading and unloading compres- [37] Q. Meng, M. Zhang, L. Han, H. Pu, and Y. Chen, “Acoustic
 sion,” Rock Mechanics and Rock Engineering, vol. 49, no. 10, emission characteristics of red sandstone specimens under
 uniaxial cyclic loading and unloading compression,” Rock
 pp. 3873–3886, 2016.
 Mechanics and Rock Engineering, vol. 51, no. 4, pp. 969–988,
[22] Y. Liang, Q. Li, Y. Gu, and Q. Zou, “Mechanical and acoustic
 2018.
 emission characteristics of rock: effect of loading and
 [38] H. Wang, D. Liu, Z. Cui, C. Cheng, and Z. Jian, “Investigation
 unloading confining pressure at the postpeak stage,” Journal
 of the fracture modes of red sandstone using XFEM and
 of Natural Gas Science and Engineering, vol. 44, pp. 54–64,
 acoustic emissions,” Theoretical and Applied Fracture Me-
 2017. chanics, vol. 85, pp. 283–293, 2016.
[23] T. Qin, H. Sun, H. Liu et al., “Experimental study on me-
 [39] P. Rodrı́guez and T. B. Celestino, “Application of acoustic
 chanical and acoustic emission characteristics of rock samples emission monitoring and signal analysis to the qualitative and
 under different stress paths,” Shock and Vibration, vol. 2018, quantitative characterization of the fracturing process in
 pp. 1–9, 2018. rocks,” Engineering Fracture Mechanics, vol. 210, pp. 54–69,
[24] G. M. Zhao, C. Wang, and D. X. Liang, “Comparative ex- 2019.
 perimental studies of acoustic emission characteristics of [40] Y. Jin, Z. Qi, M. Chen, G. Zhang, and G. Xu, “Time-sensitivity
 sandstone and mudstone under the impacts of cyclic loading of the Kaiser effect of acoustic emission in limestone and its
 and unloading,” International Journal of Distributed Sensor application to measurements of in-situ stress,” Petroleum
 Networks, vol. 14, no. 8, pp. 1–10, 2018. Science, vol. 6, no. 2, pp. 176–180, 2009.
[25] G. Liu, F. K. Xiao, Q. L. Cheng, and T. Qin, “Experimental [41] A. D. Papargyris, R. G. Cooke, S. A. Papargyri, and A. I. Botis,
 study on acoustic emission characteristics of dry and saturated “The acoustic behaviour of bricks in relation to their me-
 basalt columnar joints under uniaxial compression and tensile chanical behaviour,” Construction and Building Materials,
 damage,” Shock & Vibration, vol. 2019, pp. 1–12, 2019. vol. 15, no. 7, pp. 361–369, 2001.
[26] T. Z. Wang, L. X. Wang, F. Xue, and M. Y. Xue, “Identification [42] A. Lavrov, “The Kaiser effect in rocks: principles and stress
 of crack development in granite under triaxial compression estimation techniques,” International Journal of Rock Me-
 based on the acoustic emission signal,” International Journal chanics and Mining Sciences, vol. 40, no. 2, pp. 151–171, 2003.
 of Distributed Sensor Networks, vol. 17, no. 1, pp. 1–15, 2021. [43] A. Carpinteri, G. Lacidogna, M. Corrado, and E. Di Battista,
[27] R. Peng, Y. Ju, J. G. Wang, H. Xie, F. Gao, and L. Mao, “Energy “Cracking and crackling in concrete-like materials: a dynamic
 dissipation and release during coal failure under conventional energy balance,” Engineering Fracture Mechanics, vol. 155,
 triaxial compression,” Rock Mechanics and Rock Engineering, pp. 130–144, 2016.
 vol. 48, no. 2, pp. 509–526, 2015. [44] A. Carpinteri and F. Accornero, “Multiple snap-back insta-
[28] P. Wang, J. Xu, X. Fang, and P. Wang, “Energy dissipation and bilities in progressive microcracking coalescence,” Engineer-
 damage evolution analyses for the dynamic compression ing Fracture Mechanics, vol. 187, pp. 272–281, 2018.
 failure process of red-sandstone after freeze-thaw cycles,” [45] G. Lacidogna, F. Accornero, and A. Carpinteri, “Influence of
 Engineering Geology, vol. 221, pp. 104–113, 2017. snap-back instabilities on Acoustic Emission damage moni-
[29] H. P. Xie, R. Peng, and Y. Ju, “Energy dissipation of rock toring,” Engineering Fracture Mechanics, vol. 210, pp. 3–12,
 deformation and fracture,” Chinese Journal of Rock Mechanics 2019.
 and Engineering, vol. 23, no. 21, pp. 3565–3570, 2004. [46] H. P. Xie, Y. Ju, and L. Y. Li, “Criteria for strength and
[30] H. P. Xie, Y. Ju, L. Y. Li, and R. D. Peng, “Energy mechanism structural failure of rocks based on energy dissipation and
 of deformation and failure of rock masses,” Chinese Journal of energy release principles,” Chinese Journal of Rock Mechanics
 Rock Mechanics and Engineering, vol. 27, no. 9, pp. 1729–1740, and Engineering, vol. 24, no. 17, pp. 3003–3010, 2005.
 2008. [47] H. Xie, L. Li, R. Peng, and Y. Ju, “Energy analysis and criteria
[31] M. Q. You and A. Z. Hua, “Energy analysis of failure process for structural failure of rocks,” Journal of Rock Mechanics and
 of rock specimens,” Chinese Journal of Rock Mechanics and Geotechnical Engineering, vol. 1, no. 1, pp. 11–20, 2009.
 Engineering, vol. 21, no. 6, pp. 778–781, 2002.
[32] F. J. Chen, H. X. Li, and Z. Q. Zhu, “Energy dissipation
 analysis on unloading confining pressure failure process of
 rock,” Material. Applied Mechanics & Materials, vol. 259,
 pp. 398–401, 2013.
[33] A. Carpinteri, M. Corrado, and G. Lacidogna, “Heterogeneous
 materials in compression: correlations between absorbed,
You can also read