Application of Ion Mobility Spectrometry for Permeability Studies of Organic Substances through Polymeric Materials - MDPI
←
→
Page content transcription
If your browser does not render page correctly, please read the page content below
molecules
Article
Application of Ion Mobility Spectrometry for
Permeability Studies of Organic Substances through
Polymeric Materials
Monika Wiśnik-Sawka , Edyta Budzyńska and Jarosław Puton *
 Faculty of Advanced Technologies and Chemistry, Military University of Technology, ul. gen. Sylwestra
 Kaliskiego 2, 00-908 Warsaw 46, Poland; monika.wisnik@wat.edu.pl (M.W.-S.);
 budzynska.edyta@wat.edu.pl (E.B.)
 * Correspondence: jaroslaw.puton@wat.edu.pl; Tel.: +48-261-83-7182

 Received: 22 May 2020; Accepted: 29 June 2020; Published: 29 June 2020

 Abstract: Drift tube ion mobility spectrometers (DT IMS) allow the concentration of different organic
 compounds to be measured. This gives the opportunity to use these detectors in measuring the
 penetration of various substances through polymer membranes. Permeation measurements of two
 substances (2-heptanone and dimethyl methylphosphonate (DMMP)) through a cylindrical silicone
 rubber membrane were carried out. The membrane separated the aqueous solution from the air.
 The analyte was introduced into water, and then its concentration in air on the opposite side of the
 membrane was recorded. Based on the dynamics of detector signal changes, the diffusion coefficients
 for both tested substances were determined. Determination of permeability coefficients was based
 on precise quantitative measurements, which took into account the non-linearity of the detector
 characteristics and the effect of water on detection sensitivity. The analysis of measurement results
 was based on a mathematical description of diffusion process.

 Keywords: diffusion in polymers; permeability; tubular membrane; extraction from water; ion
 mobility spectrometry

1. Introduction
     Polymeric materials (PM) are commonly used in technology and everyday human activity.
The most important PM performance parameters are durability, elasticity and other mechanical
properties. For some applications, properties such as the permeability for some chemicals and their
solubility are important. This is particularly crucial for polymer packaging and protective coatings.
A specific type of PM applications are membranes used for controlled transport of substances between
two phases. They are successfully used in industry [1–3], as well as in medicine [4,5] and analytical
techniques [6,7].
     In the separation technology, membranes are thin layers characterized by permeability and
selectivity. High selectivity allows for the enrichment or depletion of a specific component of a mixture.
     There are three basic types of membranes: porous, dense and liquid. Membranes belonging to
these groups differ not only in the structure but also in the mechanism of substances’ penetration
through them. In the case of porous membranes, separation can occur due to the fact that the particle
sizes are comparable with pore sizes. In this case, selective permeation of the substance through
the membrane is called the ‘sieve effect’ and can occur according to various mechanisms. For larger
pore sizes, molecular diffusion is observed, and for micropores at low pressure, Knudsen diffusion
occurs. For dense membranes, the separation of components is determined by the diffusion rate
and the solubility of the component in the material. Membranes are made of amorphous polymers.

Molecules 2020, 25, 2983; doi:10.3390/molecules25132983                       www.mdpi.com/journal/molecules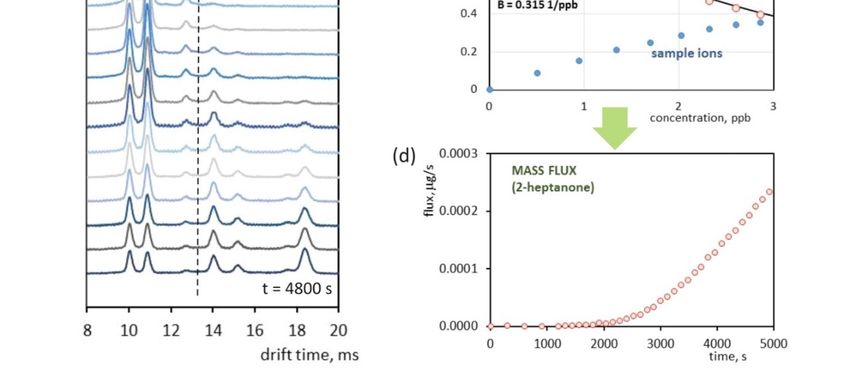
Molecules 2020, 25, 2983                                                                            2 of 11

These substances are divided into two groups: rubbery and glassy polymers. The main difference
between permeation processes in these materials is due to their structure [8]. In non-crystalline rubbers,
there are regions in which the polymer arrangement produces semi-crystalline fragments in the form
of chain clusters forming tubules. Transportation of the permeating substance takes place by jumping
between tubules. Glassy polymers are characterized by rigid connections between polymer chains.
Due to the lower mobility of the chains, the substance is transported between areas not occupied by
atoms contained in the polymer macromolecules [9]. This reduces the permeability of larger particles
through the material. Permeation of the substance through the described materials is mostly determined
by the solubility coefficient. Its value is dependent on the interactions between the membrane material
and penetrant molecules. The solubility coefficient significantly affects membrane selectivity [10,11].
It is assumed that the permeation of substances according to this mechanism performs in several stages.
Initially, the particles of the substance are adsorbed on the surface of the membrane. The next stages
are the dissolution of the substance in the polymer and its diffusive transport. The permeation process
ends with desorption on the opposite side of the membrane.
       Determination of the parameters defining the transport of substances through membranes can be
done using several experimental methods. For dense membranes, flow methods are usually used. In these
methods the penetrant mass flow is measured. Sorption methods based on the absorption/desorption
of a substance in/from a membrane are used much less frequently. Determination of mass flux in
flow methods can be carried out in various ways—starting from measuring the pressure value and
ending with the use of analytical techniques—to determining the amount of permeating substance.
The traditional way of testing gas permeation through polymer membranes is based on the pressure
method. In order to perform such tests, a membrane of known thickness is installed in a tight chamber.
The permeation process is forced by the pressure difference between the two sides of the membrane.
After creating the appropriate initial pressure difference, an increase (or decrease) of the pressure is
observed on one side of the membrane [12]. Hereby, the amount of permeating gas [13,14] or the flux
value [15] is determined.
       Studying of substance transport through membranes can be conducted using different detectors
used in chemical analysis. These types of methods are suitable when permeation occurs under
the influence of pressure differences, as well as when diffusion flow is caused by a difference in
concentration on both sides of the membrane. The measurement of CO2 permeation through polymer
coatings can be performed with a typical analyzer operating on the basis of infrared absorption [16,17].
For the determination of oxygen permeability through membrane, the value of the oxygen flux can
be measured by polarographic system [13,18]. In studies of the permeation of organic substances
through polymer membranes, chromatographic techniques are used [19–26]. Introduction of samples
into the chromatograph can be made using different methods. Chromatograph can be often coupled
with various detectors such as mass spectrometers [21,23,24] or electron capture detectors [22].
These measurements are performed using cyclic sampling. For this purpose, the non-direct connection
of the chromatograph to the permeability measurement system (off-line methods) is usually used.
However, when specific sample introduction systems are used, it is possible to directly connect a
chromatograph with a diffusion cell (on-line methods) [25,27]. The application of on-line systems
enables full automation of the experimental process.
       This paper contains the results of flow experiment performed using an ion mobility spectrometer.
The ion mobility spectrometry (IMS) has been applied for the past 50 years and successfully used as an
analytical method for the detection and identification of large number of chemical compounds [28–31].
Polymer membranes are used in sample introduction systems for IMS detectors. In published
works [32–38] it has been shown that inlet systems with a polymer membrane provide effective
detection of analytes present in the gas and liquid phases. The purpose of our work is not to examine
the effectiveness of detection, but to determine the parameters characteristic for diffusion process.
In our experiment the IMS detector was used as a device for measuring the mass flux of the permeating
substance. The selection of this detector for conducting mass flux measurements was due to high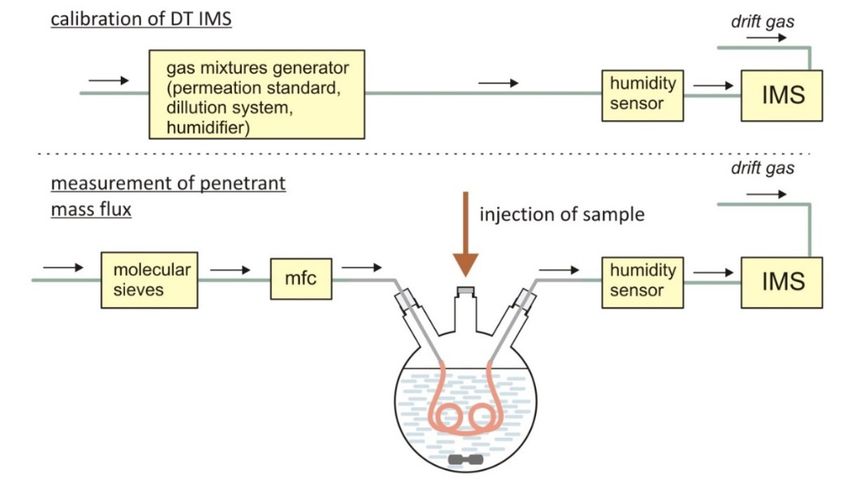
Molecules 2020, 25, 2983                                                                             3 of 11

sensitivity (detection limits below 1 ppb), selectivity and usefulness for detection of various compounds.
IMS detectors are devices characterized by fast analytical signal generation (time constant of a few
seconds) and the possibility of continuous operation. Our measurements were made for a hollow
cylinder silicone membrane that separated the analyte-containing water solution from the air.

2. Theory
     Penetration of the substance through dense polymeric materials occurs according to the
aforementioned dissolution mechanism. The diffusion process determines the time-dependent
distribution of the penetrating substance concentration in the polymeric material. In the simplest case,
for homogeneous flat layers made of a dense polymer, the mass flow of the penetrant can be described
by the first Fick diffusion law:
                                                        ∂C
                                               F = −D                                                 (1)
                                                        ∂x
where F is the penetrant flux density, defined as the amount of substance flowing through the surface
unit in the time of 1 second, D is the diffusion coefficient, and C is the concentration of the penetrant
in the membrane. In general, the concentration C and the flux density F are time dependent values.
In steady state, for a membrane with a thickness of l, the flux density FST of the substance penetrating
through the membrane is described by the formula:

                                                     (C0 − Cl )
                                           FST = D                                                      (2)
                                                         l
where C0 and Cl are the penetrant concentrations in the membrane material on both sides of it. They are
linearly dependent on the concentrations of C0,ext and Cl,ext in the environments separated by the
membrane, with the proportionality constant, which is the solubility S, being the measure of the ability
of the polymer for penetrant absorption:

                                               C0 = SC0,ext
                                                                                                        (3)
                                               Cl = SCl,ext

     The permeability P of a given membrane material for given penetrant is defined as the amount of
substance penetrating per area unit of the membrane with a unit thickness in 1 second, related to the
difference in concentration in the media separated by the membrane:

                                                      FST l
                                           P=                                                           (4)
                                                (C0,ext − Cl,ext )

    It follows from formulas (2), (3) and (4) that the permeability is a product of diffusion coefficient D
and solubility S:
                                                 P = DS                                                 (5)

     Determination of the permeability coefficient based on the formula (4) can be performed for the
equilibrium state. In this case, it is necessary to know the dimensions of the membrane, the value of
the diffusion flux and the concentration values on both sides of the membrane. Determination of the
diffusion coefficient can be made only on the base of the results obtained from dynamic measurements.
     The most commonly used for considerations of the diffusion process is the assumption that the
polymeric material is isotropic. Diffusion in such material occurs equally in all directions. Theoretical
determination of concentration distribution is possible by solving the equation describing the second
diffusion law:
                                            ∂C
                                               = div(D grad C)                                        (6)
                                            ∂t
     Solutions of this equation for different geometries can be found in many publications [39–41].
Sketches illustrating the process of penetration through a flat and hollow cylindrical membrane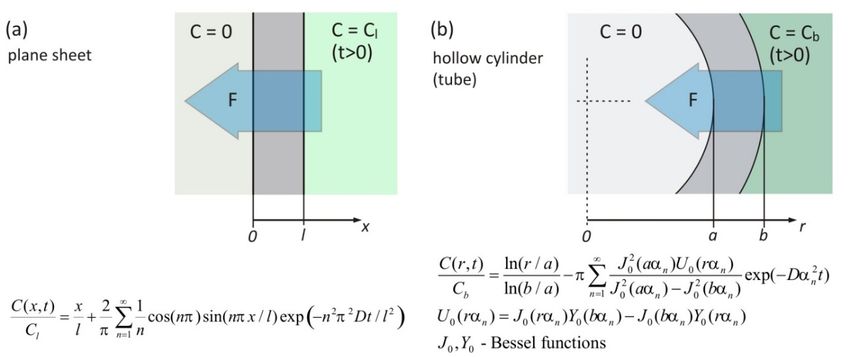
Molecules 2020, 25, 2983 4 of 11
Solutions
Molecules of this
2020, 25, 2983 equation for different geometries can be found in many publications [39–41]. 4 of 11
Sketches illustrating the process of penetration through a flat and hollow cylindrical membrane are
presented in Figures 1a and 1b. Both cases are one-dimensional. The drawings also include formulas
are presentedconcentration
describing in Figure 1a,b.distributions
Both cases arefor one-dimensional. The drawings
zero initial condition and also includeconditions
boundary formulas
describing concentration distributions for zero initial condition and boundary conditions
corresponding to constant concentration values on the edges. Shapes of the concentration distribution corresponding
to
forconstant
flat andconcentration values on the
cylindrical membranes areedges. Shapes
different of the
(Figure concentration
1c). In order to distribution
determine the fordiffusion
flat and
cylindrical
coefficient in flow experiments, the dependence of the diffusing substance mass flux on time in
membranes are different (Figure 1c). In order to determine the diffusion coefficient flow
is used.
experiments, the dependence of the diffusing substance mass flux on time is used. Values
Values of flux at x = 0 for a flat membrane and r = a for a hollow cylindrical membrane were calculated of flux at
= 0numerical
xby for a flat membrane and rof= concentration
differentiation a for a hollow distributions.
cylindrical membrane were calculated
The dependence by numerical
of the diffusion flux
differentiation
shape on time for flat and hollow cylindrical membranes are shown in Figure 1d. These shapes for
of concentration distributions. The dependence of the diffusion flux shape on time are
flat and identical
almost hollow cylindrical membranes
in both cases. This means arethat
shownthe in Figure
flow 1d. These
experiment shapes
results are almost
obtained identical
experimentally
in
forboth cases. cylindrical
a hollow This meansmembrane
that the flowcan experiment
be carried out results
basedobtained
on the experimentally
formulas resultingfor afrom
hollow the
cylindrical membrane can be carried
mathematical model for a flat membrane. out based on the formulas resulting from the mathematical model
for a flat membrane.
Figure 1. Diffusion transport in flat and hollow cylindrical membranes. Sketches of transport geometry
Figure 1. Diffusion transport in flat and hollow cylindrical membranes. Sketches of transport
through membranes with formulas describing concentration distribution for flat (a) and hollow
geometry through membranes with formulas describing concentration distribution for flat (a) and
cylindrical (b) membranes. Comparison of penetrant concentration distributions in a flat and hollow
hollow cylindrical (b) membranes. Comparison of penetrant concentration distributions in a flat and
cylindrical membranes (c). The dependence of the mass flow of the substance diffusing through the
hollow cylindrical membranes (c). The dependence of the mass flow of the substance diffusing
membranes on the time (d).
through the membranes on the time (d).
The analysis of the mass flux dependency of the penetrant through the membrane is often made
The analysis of the mass flux dependency of the penetrant through the membrane is often made
using the so-called short-time approximation method. It is based on the solution of the diffusion
using the so-called short-time approximation method. It is based on the solution of the diffusion
Equation (6) with the use of Laplace transform [39–42]. For short times it is possible to present the
equation (6) with the use of Laplace transform [39–42]. For short times it is possible to present the
solution for mass flux density in the form:
solution for mass flux density in the form:
12
D l2
1
ln t 2 F = ln 2Cl − (7)
π 4Dt
Molecules 2020, 25, 2983 5 of 11
The application of formula (7) to data obtained from the measurement of the mass flux allows the
determination of the diffusion coefficient. It is crucial for determination of maximum value of the flux.
Using formula (4) and knowing the maximum value of the flux FST in steady state, one can determine
the value of permeability.
3. Materials and Methods
3.1. Chemicals
Permeability tests were performed for a commercially available silicone tube—SILASTIC®
Laboratory Tubing (Dow Corning, Midland, MI, USA)—made of translucent, platinum hardened,
tear resistant silicone. This type of tube is used in laboratory systems requiring flexible and temperature
resistant connections, as well as where high purity of fluids flowing through the tubes is of great
importance. Tubes with an outer diameter of 0.318 cm, an inner diameter of 0.198 cm and a length of
32 cm were used in this study.
Measurements of permeability and diffusion coefficient were made for two organic compounds:
2-heptanone (Sigma-Aldrich, Saint Louis, MO, USA, 99% purity) and dimethyl methylphosphonate
(DMMP) (Alpha Aesar, GmbH, Germany, 97% purity). Water solubilities of these compounds are about
0.4 g/100 ml and about 10 g/100 ml, respectively. Water used in the tests was purified in the Hydrolab
HLP5UV filter system (Wenk Labtec, Germany). The gas flowing inside the tube was air purified in a
filter of 2000 cm3 volume filled with molecular sieves with 1.0 nm pores diameter (Merck, Germany).
3.2. Instrumental
The detector used for measuring the flux of the substance permeating through the membrane was
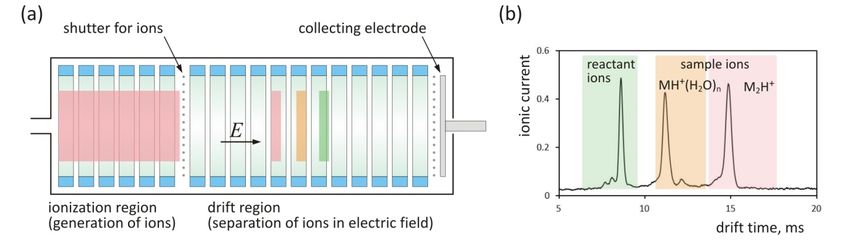
a drift tube ion mobility spectrometer (DT IMS). The operation principle of this detector is illustrated
in Figure 2a. The detector consists of two parts: an ionization region in which ions are formed and a
drift section where separation of ions occurs. Both parts are separated by a shutter grid that allows the
narrow portion of ions to be introduced into the drift section. Two gas streams are introduced into the
detector: carrier gas, which contains the sample, and drift gas. In most cases, purified air is used as the
carrier gas and drift gas. The output signal from the DT IMS collector electrode (Figure 2b) is called the
drift time spectrum and contains information about mobility of ions and their quantity. The spectrum
consists of peaks generated by reactant ions and sample ions. Reactant ions are formed as a result of
ionization of the carrier gas and are a reservoir of electric charge transferred to the sample molecules.
For most substances, monomer and dimer ions are formed. The exemplary spectrum presented in
Figure 2b contains peaks of reactant ions as well as the peak of hydrated monomer (MH+ (H2 O)n ) and
dimer (M2 H+ ) ions. In quantitative studies, peak areas are most often measured. Determination of
Molecules 2020, 25, 2983 6 of 11
analyte concentration can be based on the area of reactant ions peaks or peaks generated by sample ions.
Figure 2. Sketch of the drift tube ion mobility spectrometer (DT IMS) design (a). Exemplary drift
Figure 2. Sketch of the drift tube ion mobility spectrometer (DT IMS) design (a). Exemplary drift time
time spectrum containing reactant ions H3 O+ (H2 O)m , monomer ions MH+ (H2 O)n and dimer ions
spectrum containing reactant ions H3O (H2O)m, monomer ions MH+(H2O)n and dimer ions M2H+ (b).
+
M2 H+ (b).
The scheme of the system used for the measurement of the flux of substance permeating through
a hollow cylinder membrane is shown in Figure 3. The design of this system is similar to that
presented in the work by Du [33]. The basic element of the system was a reaction kettle filled with
water, inside which the tested tube was placed. The water temperature in the kettle was kept at 25
°C. By means of mass flow controller (mfc), 0.7 Ln/min of gas was introduced into the tube. The
polymer membrane (silicone tubing) was submerged in water, into which the analyzed substance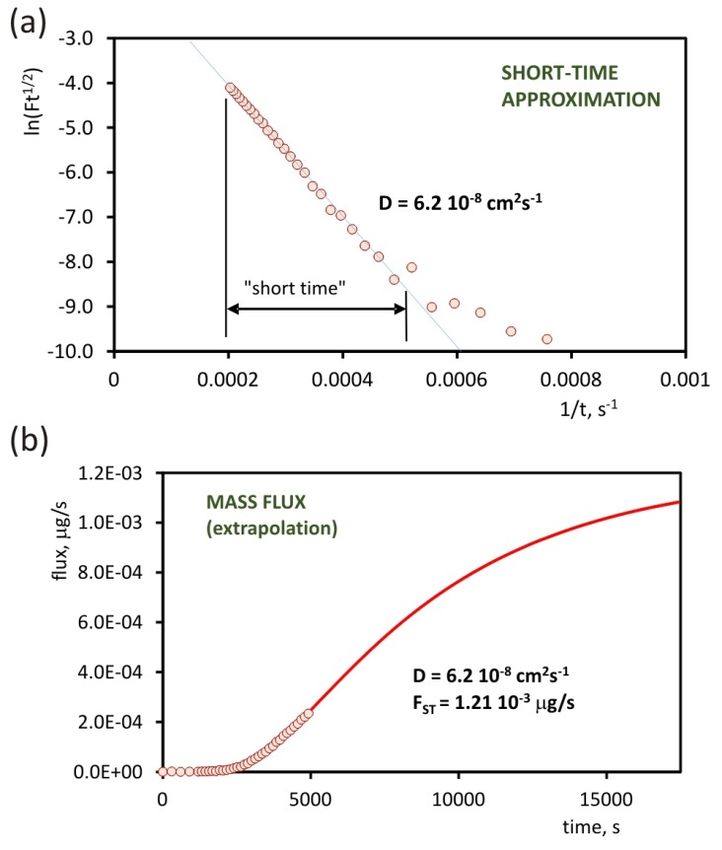
Figure 2. Sketch of the drift tube ion mobility spectrometer (DT IMS) design (a). Exemplary drift time
Molecules 2020, 25,containing
spectrum 2983 reactant ions H3O+ (H2O)m, monomer ions MH+(H2O)n and dimer ions M2H+ (b).6 of 11
The scheme of the system used for the measurement of the flux of substance permeating through
The DT IMS used in the study was designed and manufactured at the Institute of Chemistry,
a hollow cylinder membrane is shown in Figure 3. The design of this system is similar to that
Military University of Technology in Warsaw. The detector is equipped with 63-Ni ionization source
presented in the work by Du [33]. The basic element of the system was a reaction kettle filled with
with an activity of approximately 15 MBq, which is placed in ionization region. Its length is 5.7 cm.
water, inside which the tested tube was placed. The water temperature in the kettle was kept at 25
The ionization region is separated from the drift section by a Bradbury-Nielsen shutter grid opened for
°C. By means of mass flow controller (mfc), 0.7 Ln/min of gas was introduced into the tube. The
a time of 0.150 ms with a repetition period of 25 ms. The drift section is 6.1 cm long, and the electric
polymer membrane (silicone tubing) was submerged in water, into which the analyzed substance
field in this section is equal to about 250 Vcm−1 . The inner diameter of the detector is equal to 3.6 cm.
was injected and mixed with a magnetic stirrer. The air passing through the tube was directed to the
Laboratory air dried with molecular sieves with a pore diameter of 1 nm (Merck) was used as the
IMS detector via the DPT-21 humidity sensor (Czaki Thermo-Product). The analytical signal obtained
carrier and drift gases.
from IMS detectors is strongly related to the water vapor content in analyzed gas. It significantly
The scheme of the system used for the measurement of the flux of substance permeating through a
affects the ionization process. This involves the formation of hydrated cluster ions with a higher
hollow cylinder membrane is shown in Figure 3. The design of this system is similar to that presented
number of water molecules, which leads to the reduction of ionization efficiency. It has been proven
in the work by Du [33]. The basic element of the system was a reaction kettle filled with water, inside
[43,44] that with the increase of humidity there is a simultaneous decrease in peaks amplitude and a
which the tested tube was placed. The water temperature in the kettle was kept at 25 ◦ C. By means of
shift towards higher drift times. Due to these phenomena, it is necessary to control the water vapor
mass flow controller (mfc), 0.7 Ln/min of gas was introduced into the tube. The polymer membrane
concentration in the carrier gas.
(silicone tubing) was submerged in water, into which the analyzed substance was injected and mixed
The measurement of the diffusion flux began when the analyte had been injected into the water
with a magnetic stirrer. The air passing through the tube was directed to the IMS detector via the
filling the reaction kettle. From this moment, drift time spectra were recorded at 4 minutes intervals.
DPT-21 humidity sensor (Czaki Thermo-Product). The analytical signal obtained from IMS detectors
The tests were quantitative, and therefore, it was necessary to perform calibration measurements of
is strongly related to the water vapor content in analyzed gas. It significantly affects the ionization
the detector first. A gas mixtures generator was used in calibration studies. The generator system
process. This involves the formation of hydrated cluster ions with a higher number of water molecules,
enabled the introduction of the analyte with a concentration of 0–20 ppb for
which leads to the reduction of ionization efficiency. It has been proven [43,44] that with the increase
2-heptanone or 0–12 ppb for DMMP into the carrier gas. The mixture produced in the generator was
of humidity there is a simultaneous decrease in peaks amplitude and a shift towards higher drift times.
moisturized in order to obtain the same water vapor content as during permeability tests.
Due to these phenomena, it is necessary to control the water vapor concentration in the carrier gas.
Figure
Figure 3. Scheme of
3. Scheme of the
the experimental
experimental system
system for
for testing
testing the
the permeation
permeation of
of substances
substances contained
contained in
in
water into the air through cylindrical silicone membranes (mfc—mass flow controller).
water into the air through cylindrical silicone membranes (mfc—mass flow controller).
The measurement of the diffusion flux began when the analyte had been injected into the water
filling the reaction kettle. From this moment, drift time spectra were recorded at 4 min intervals.
The tests were quantitative, and therefore, it was necessary to perform calibration measurements of
the detector first. A gas mixtures generator was used in calibration studies. The generator system
enabled the introduction of the analyte with a concentration of 0–20 ppb for 2-heptanone or 0–12 ppb
for DMMP into the carrier gas. The mixture produced in the generator was moisturized in order to
obtain the same water vapor content as during permeability tests.
4. Results
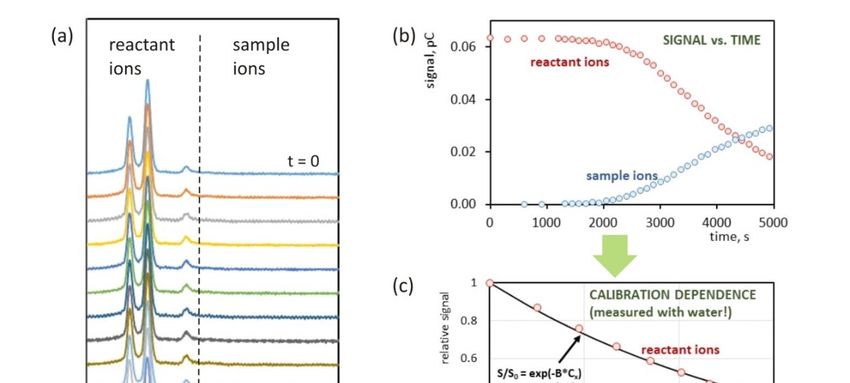
The mass flux of the substance permeating through the membrane was measured for two organic
substances: 2-heptanone and dimethyl methylphosphonate (DMMP). Figure 4a presents drift time
spectra recorded for 2-heptanone at different times from the introduction of the sample into the water4. Results
The mass flux of the substance permeating through the membrane was measured for two
organic substances: 2-heptanone and dimethyl methylphosphonate (DMMP). Figure 4a presents drift
time spectra
Molecules recorded
2020, 25, 2983 for 2-heptanone at different times from the introduction of the sample into 7 ofthe
11
water in which the silicone tube was placed. The subsequent spectra show the appearance of analyte
ion peaks and change in their amplitudes. The intensity of the reactant ions peaks also changes
in which the The
(decreases). silicone tube was
relationship placed.the
between The subsequent
peak areas andspectra
time is show
shownthe in appearance
Figure 4b. Theof numerically
analyte ion
peaks and change in their amplitudes. The intensity of the reactant ions peaks
determined peak area of the reactant ions peaks was taken as a measure of the IMS detector also changes (decreases).
signal
The relationship between the peak areas and time is shown in Figure 4b. The numerically
and used for the calculation of the parameters characterizing the permeation through the membrane. determined
peak area of the reactant
The calibration ions peaks
curve measured was
with thetaken as a measure
gas mixtures of the is
generator IMS detector
shown signal4c.
in Figure and used for the
Measurements
calculation of the parameters characterizing the permeation through the membrane.
were made at the same water vapor content as during permeability tests. The mass flux dependence The calibration
curve measured
on time shown in with the gas
Figure mixtures
4d was generator
calculated on the is basis
shown ofin Figure in
changes 4c.the
Measurements were
detector signal madeand
in time at
the same water vapor content as during permeability tests. The mass flux dependence
the calibration curve. In this calculation, the value of the gas flow through the tube was taken into on time shown
in Figure 4d was calculated on the basis of changes in the detector signal in time and the calibration
account.
curve. In this calculation, the value of the gas flow through the tube was taken into account.
Figure 4. Determination of 2-heptanone mass flux through the cylindrical silicone membrane. Drift time
Figure recorded
spectra 4. Determination of 2-heptanone
after 2-heptanone mass
injection flux through
in 4-minute the cylindrical
intervals silicone
(a). Dependence membrane.
of the Drift
IMS detector
time spectra recorded after 2-heptanone injection in 4-minute intervals (a). Dependence
signal intensity on time measured for reactant ions and sample ions (b). 2-heptanone calibration curve of the IMS
detector signal
determined intensity
at a water on time measured
concentration of 226 ppmfor(c). reactant
Mass fluxions and samplepermeating
of 2-heptanone ions (b). 2-heptanone
through the
calibration curve determined at a water concentration of 226 ppm (c).
polymer membrane calculated on the basis of IMS signal and calibration curve (d). Mass flux of 2-heptanone
permeating through the polymer membrane calculated on the basis of IMS signal and calibration
Determination
curve (d). of the diffusion coefficient for 2-heptanone was carried out using the short time
method. Figure 5a is a graph of the dependence between ln(Ft1/2 ) and 1/t calculated on the basis
Determination
of mass of the diffusion
flow measurement coefficient
results. For for 2-heptanone
times from 2000 to 5000was carried
seconds, outdependence
this using the short time
is linear.
1/2
method. Figure 5a is a graph of the dependence between ln(Ft ) and 1/t calculated on the
Based on formula (7), the diffusion coefficient was determined using the slope of the linear part of this basis of
mass flow measurement results. For times from
−8 2000
2 to
−1 5000 seconds, this dependence
dependence. For 2-heptanone it was 6.2 × 10 cm s . The determined D value allows to calculate is linear. Based
the theoretical mass flow (Figure 5b) and estimate its value for equilibrium state FST . Basing on this
value and using the formula (4), it is possible to calculate permeability P. Its value for 2-heptanone is
2.0 × 10⁻⁷ cm2 s−1 . The results for the second analyte (DMMP) were analyzed analogously.concentration equal to half of the steady state value was achieved after approximately 400 s. Based
on theoretical considerations, it can be easily demonstrated that this corresponds to a Dt/l2 value of
0.15, which, with the known time and membrane thickness, gives a diffusion coefficient value of
1.4∙10−6 cm2s −1. It can be assumed that this value is underestimated due to the quite significant time
constant2020,
Molecules of the humidity sensor. All values of diffusion and permeability coefficients determined
25, 2983 8 ofon
11
the basis of the measurements carried out are summarized in Table 1.
1/2 from 1/t used for determination of the diffusion coefficient by
Figure 5. Graph
Figure 5. Graph of
of dependence
dependence ln(Ft
ln(Ft1/2)) from 1/t used for determination of the diffusion coefficient by
the
the short time approximation method (a). Extrapolated mass
short time approximation method (a). Extrapolated mass flux
flux versus
versus time,
time, determined
determined on
on the
the basis
basis
of the calculated diffusion coefficient (b).
of the calculated diffusion coefficient (b).
The accuracy of determining the diffusion coefficient is related to the precision of reproducing the
shape (but not the amplitude) of the permeation curve. We estimate that the relative uncertainty of the
calculated diffusion coefficient is no more than 20%. The uncertainty of determining the permeability
coefficient is mainly determined by the accuracy of measuring the concentration of the analyte in the
gas flowing inside the tube. The value of this uncertainty seems not to be greater than 10%.
Estimation of permeability and diffusion coefficient were also carried out for water. The water
flux was measured using a capacitive humidity sensor. Measurement of water concentration in the
air flowing through the tube allowed the permeability to be determined. Its value was equal to
4.3 × 10⁻⁹ cm2 s−1 . The diffusion coefficient for water was estimated based on the results of dynamic
measurements. They involved the observation of changes in the water concentration in the air flowing
through the tube after water was introduced into the reaction kettle. The shape of the dependence
of water vapor concentration on time was similar to the curve shown in Figure 5b. Maximum value
of water vapor concentration was equal to 230 ppm. This value was constant for times longer than
2000 s after introducing the water to the kettle. The value of water vapor concentration equal to half of
the steady state value was achieved after approximately 400 s. Based on theoretical considerations,
it can be easily demonstrated that this corresponds to a Dt/l2 value of 0.15, which, with the known time
and membrane thickness, gives a diffusion coefficient value of 1.4 × 10⁻⁶ cm2 s −1 . It can be assumed
that this value is underestimated due to the quite significant time constant of the humidity sensor.
All values of diffusion and permeability coefficients determined on the basis of the measurements
carried out are summarized in Table 1.Molecules 2020, 25, 2983 9 of 11
Table 1. Determined values of diffusion coefficient and permeability of 2-heptanone, DMMP and water
in silicone rubber.
Diffusion Coefficient Permeability
2-heptanone 6.2 × 10⁻⁸ cm2 s−1 2.0 × 10⁻⁷ cm2 s−1
DMMP (dimethyl methylphosphonate) 3.1 × 10⁻⁸ cm2 s−1 4.9 × 10⁻⁸ cm2 s−1
water >1.4 × 10⁻⁶ cm2 s−1 4.3 × 10⁻⁹ cm2 s−1
5. Conclusions
Drift tube ion mobility spectrometer give the opportunity to measure the concentration of many
organic compounds. This feature can be used in studies of the organic compounds’ permeation through
polymer materials.
The aim of the presented work was to test a new measurement system for studying the permeation
of organic substances through polymer membranes. Until now, similar systems have been used only
for analytical purposes, i.e., for checking if such membranes can be used for extracting the analyte
from water. [43,44]. In our work, parameters describing the transport of chemicals in polymers,
i.e., diffusion coefficients and permeability, have been determined. One should realize that in our
studies the membrane separated the liquid phase from the gas. This has a significant impact on mass
transport conditions. The obtained values of organic substances diffusion coefficients are relatively
small. This may be due to the surface interaction of the penetrant with the polymer layer or to the fact
that the polymer material is saturated with water. Relating the obtained results to literature data is
difficult because the types of silicone rubber and research conditions are very different. The diffusion
coefficient of methyl ethyl ketone (butanone) in the silicon membrane determined by Thiyagarajan
et al. was 7.6 × 10⁻⁶ cm2 s−1 (at 40 ◦ C) [45]. This is over 100 times more than the value determined
based on our research. However, it should be noted that our measurements were made at a lower
temperature, heptanone particles are much larger than butanone and that the structure (fillers, degree of
cross-linking) of the polymer material was different. Water permeability is much lower than for organic
substances. This is advantageous for membranes separating the DT IMS reaction area from the
environment, as it limits the water concentration in the carrier gas. This allows the ionization efficiency
of many analytes to be increased.
The concentration of organic substances in the aqueous solution was low (about 10 µg/g); however,
with the use of a polymer membrane, effective detection was possible. This confirms the usefulness of
silicone membranes in analytical applications, since they can be used to separate the reaction area of
the detector from the environment.
Author Contributions: Conceptualization, J.P.; data curation, M.W.-S.; investigation, M.W.-S.; methodology,
J.P.; writing—original draft preparation, M.W.-S.; writing—review and editing, E.B. and J.P.; visualization, J.P.;
supervision J.P. All authors have read and agreed to the published version of the manuscript.
Funding: This work has been supported by the project Research Grant funded by Polish Ministry of National
Defence (GB MON/13-994/2018/WAT) (Poland).
Acknowledgments: The authors are grateful to Anna Szymańczyk (M.Sc) and Sylwia Paczyńska (M.Sc) for
technical support in experimental research.
Conflicts of Interest: The authors declare no conflict of interest.
References
1. Golan, A.; Kleper, M.H. Membrane-Based Air Separation. AIChE Symp. Ser. 1986, 250, 35–47.
2. Chen, X.Y.; Vinh-thang, H.; Ramirez, A.A.; Rodrigue, D.; Kaliaguine, S. Membrane gas separation technologies
for biogas upgrading. RSC Adv. 2015, 5, 24399–24448. [CrossRef]
3. Gugliuzza, A.; Iulianelli, A.; Basile, A. Membranes for hydrocarbon fuel processing and separation.
In Advanced Membrane Science and Technology for Sustainable Energy and Environmental Applications; Basile, A.,
Nunes, P., Eds.; Woodhead Publishing: Cambridge, UK, 2011; pp. 295–338.Molecules 2020, 25, 2983 10 of 11
4. Ottaviani, G.; Martel, S.; Carrupt, P.A. Parallel artificial membrane permeability assay: A new membrane
for the fast prediction of passive human skin permeability. J. Med. Chem. 2006, 4, 3948–3954. [CrossRef]
[PubMed]
5. Fischbach, M.; Terzic, J.; Laugel, V.; Escande, B.; Dangelser, C.; Helmstetter, A. Measurement of hydrostatic
intraperitoneal pressure: A useful tool for the improvement of dialysis dose prescription. Pediatr. Nephrol.
2003, 18, 976–980. [CrossRef] [PubMed]
6. Sandahl, M.; Mathiasson, L.; Jonsson, J.A. Determination of thiophanate-methyl and its metabolites at trace
level in spiked natural water using the supported liquid membrane extraction and the microporous membrane
liquid-liquid extraction techniques combined on-line with high-performance liquid chromatography.
J. Chromatogr. A 2000, 893, 123–131. [PubMed]
7. Jonsson, J.A. Liquid membrane techniques. In Comprehensive Analytical Chemistry; Pawliszyn, J., Ed.;
Elsevier Science: Amsterdam, The Netherlands, 2002; Volume 37, pp. 503–530.
8. Baker, R.W. Membranes for vapor/gas separations. Membr. Technol. Res. Inc. 2001, 1–25. Available online:
http://citeseerx.ist.psu.edu/viewdoc/download?doi=10.1.1.566.6052&rep=rep1&type=pdf (accessed on 3
February 2020).
9. Alentiev, A.Y.; Yampolskii, Y.P. Free volume model and tradeoff relations of gas permeability and selectivity
in glassy polymers. J. Membr. Sci. 2000, 165, 201–216. [CrossRef]
10. Javaid, A. Membranes for solubility-based gas separation applications. Chem. Eng. J. 2005, 112, 219–226.
[CrossRef]
11. Ismail, A.F.; Khulbe, K.C.; Matsuura, T. Gas Separation Membranes: Polymeric and Inorganic; Springer International
Publishing: Basel, Switzerland, 2015.
12. Biasetto, L.; Colombo, P.; Innocentini, M.D.M.; Mullens, S. Gas permeability of microcellular ceramic foams.
Ind. Eng. Chem. Res. 2007, 46, 3366–3372. [CrossRef]
13. Catalano, J.; Baschetti, M.G.; De Angelis, M.G.; Sarti, G.C.; Sanguineti, A.; Fossati, P. Gas and water vapor
permeation in a short-side-chain PFSI membrane. Desalination 2009, 240, 341–346. [CrossRef]
14. Tremblay, P.; Savard, M.M.; Vermette, J.; Paquin, R. Gas permeability, diffusivity and solubility of nitrogen,
helium, methane, carbon dioxide and formaldehyde in dense polymeric membranes using a new on-line
permeation apparatus. J. Membr. Sci. 2006, 282, 245–256. [CrossRef]
15. Tan, S.; Fu, Q.; Scofield, J.M.P.; Kim, J.; Gurr, P.A.; Ladewig, K.; Blencowe, A.; Qiao, G.G. Cyclodextrin-based
supramolecular polymeric nanoparticles for next generation gas separation membranes. J. Mater. Chem. A
2015, 3, 14876–14886. [CrossRef]
16. Guo, Z.; Lee, L.J.; Tomasko, D.L. CO2 permeability of polystyrene nanocomposites and nanocomposite
foams. Ind. Eng. Chem. Res. 2008, 47, 9636–9643. [CrossRef]
17. Aleid, S.M.; AL Saikhan, M.S. Effect of Permeable Modified Atmosphere Packaging on Quality and Shelf
Life of Fresh ® Khenaizy Dates Stored at Low Temperature. J. Food Nutr. Res. 2017, 5, 503–509.
18. Friedmann, G.; Sperry, P.; Brossas, J. Polarographic method for the determination of the permeability
coefficient of polymers towards oxygen dissolved in water. J. Membr. Sci. 1992, 6, 93–100. [CrossRef]
19. Yom, C.K.; Kim, B.S.; Lee, J.M. Precise on-line measurements of permeation transients through dense
polymeric membranes using a new permeation apparatus. J. Membr. Sci. 1999, 161, 55–66. [CrossRef]
20. Yeom, C.K.; Lee, J.M.; Hong, Y.T.; Choi, K.Y.; Kim, S.C. Analysis of permeation transients of pure gases
through dense polymeric membranes measured by a new permeation apparatus. J. Membr. Sci. 2000, 166, 71–83.
[CrossRef]
21. Hauser, B.; Popp, P.; Kleine-Benne, E. Membrane-assisted solvent extraction of triazines and other semi-volatile
contaminants directly coupled to large-volume injection-gas chromatography- mass spectrometric detection.
J. Chromatogr. A 2002, 963, 27–36. [CrossRef]
22. Hauser, B.; Popp, P. Membrane-assisted solvent extraction of organochlorine compounds in combination
with large-volume injection/gas chromatography-electron capture detection. J. Sep. Sci. 2001, 24, 551–560.
[CrossRef]
23. Schellin, M.; Popp, P. Membrane-assisted solvent extraction of polychlorinated biphenyls in river water and
other matrices combined with large volume injection-gas chromatography-mass spectrometric detection.
J. Chromatogr. A 2003, 1020, 153–160. [CrossRef]
24. Melcher, R.G.; Morabito, P.L. Membrane/gas chromatographic system for automated extraction and
determination of trace organics in aqueous samples. Anal. Chem. 1990, 62, 2183–2188. [CrossRef]Molecules 2020, 25, 2983 11 of 11
25. Knutsson, M.; Nilv’e, G.; Mathiasson, L.; Jonsson, J.A. Supported liquid membranes for sampling and sample
preparation of pesticides in water. J. Chromatogr. A 1996, 754, 197–205. [CrossRef]
26. Megersa, N.; Jonsson, J.A. Trace enrichment and sample preparation of alkylthio-s-triazine herbicides in
environmental waters using a supported liquid membrane technique in combination with high-performance
liquid chromatography. Analyst 1998, 123, 225–231. [CrossRef]
27. Shen, Y.; Jonsson, J.A.; Mathiasson, L. On-line microporous membrane liquid-liquid extraction for sample
pretreatment combined with capillary gas chromatography applied to local anaes-thetics in blood plasma.
Anal. Chem. 1998, 70, 946–953. [CrossRef]
28. Eiceman, G.A.; Karpas, Z. Ion Mobility Spectrometry, 2nd ed.; CRC Press: Boca Raton, FL, USA, 2005.
29. Sorribes-Soriano, A.; de la Guardia, M.; Esteve-Turrillas, F.A.; Armenta, S. Trace analysis by ion mobility
spectrometry: From conventional to smart sample preconcentration methods. A review. Anal. Chim. Acta
2018, 1026, 37–50. [CrossRef]
30. Budzyńska, E.; Sielemann, S.; Puton, J.; Surminski, A.L.R.M. Analysis of e-liquids for electronic cigarettes
using GC-IMS/MS with headspace sampling. Talanta 2020, 209, 120594. [CrossRef]
31. Yanini, A.; Esteve-Turrillas, F.A.; de la Guardia, M.; Armenta, S. Ion mobility spectrometry and high resolution
mass-spectrometry as methodologies for rapid identification of the last generation of new psychoactive
substances. J. Chromatogr. A 2018, 1574, 91–100. [CrossRef] [PubMed]
32. Kou, D.; San Juan, A.; Mitra, S. Gas injection membrane extraction for fast on-line analysis using GC detection.
Anal. Chem. 2001, 73, 5462–5467. [CrossRef]
33. Borsdorf, H.; Rammler, A. Continuous on-line determination of methyl tert -butyl ether in water samples
using ion mobility spectrometry. J. Chromatogr. A 2005, 1072, 45–54. [CrossRef]
34. Du, Y.; Zhang, W.; Whitten, W.; Li, H.; Watson, D.B.; Xu, J. Membrane-Extraction Ion Mobility Spectrometry
for in Situ Detection of Chlorinated Hydrocarbons in Water. Anal. Chem. 2010, 82, 4089–4096. [CrossRef]
35. Arce, L.; Valcárcel, M. Membrane Set up Combined with Photoionization-Ion Mobility Spectrometer to
Improve Analytical Performance and Avoid Humidity Interference on the Determination of Aromatics in
Gaseous Samples. J. Chromatogr. A 2016, 1431, 55–63.
36. Holopainen, S.; Nousiainen, M. Determination of Fuel Ethers in Water by Membrane Extraction Ion Mobility
Spectrometry. Talanta 2013, 106, 448–453. [CrossRef] [PubMed]
37. Holopainen, S.; Nousiainen, M.; Anttalainen, O.; Sillanpa, M.E.T. Sample-Extraction Methods for Ion-Mobility
Spectrometry in Water Analysis. Trac. Trends Anal. Chem. 2012, 37, 124–134. [CrossRef]
38. Higgins, B.; Simonson, D.; McGill, R.A.; Nguyen, V.; Stepnowski, J.; Pai, R.; Stepnowski, S.; Rake, M.
Functionalized sorbent membranes for use with ion mobility spectrometry. In Proceedings of the 2008 IEEE
Conference on Technologies for Homeland Security, Waltham, MA, USA, 12–13 May 2008; pp. 139–143.
39. Casandra, A.; Ismadiji, S.; Noskov, B.A.; Liggieri, L.; Lin, S.-Y. A study on the method of short-time
approximation—Criteria for applicability. Int. J. Heat Mass Trans. 2015, 90, 752–760. [CrossRef]
40. Crank, J. The Mathematics of Diffusion, 2nd ed.; Oxford University Press: Oxford, UK, 1975.
41. Huang, I.; Yen, S. Diffusion in hollow cylinders for some boundary conditions. Mater. Chem. Phys. 2002,
74, 289–299. [CrossRef]
42. Karimi, M. Diffusion in polymer solids and solutions. In Mass Transfer in Chemical Engineering Processes;
Markos, J., Ed.; InTech: Rijeka, Croatia, 2011; pp. 17–40.
43. Borsdorf, H.; Fiedler, P.; Mayer, T. The effect of humidity on gas sensing with ion mobility spectrometry.
Sens. Actuators B Chem. 2015, 218, 184–190. [CrossRef]
44. Mäkinen, M.; Sillanpää, M.; Viitanen, A.; Knap, A.; Mäkelä, J.M.; Puton, J. The effect of humidity on sensitivity
of amine detection in ion mobility spectrometry. Talanta 2011, 84, 116–121. [CrossRef] [PubMed]
45. Thiyagarajan, R.; Ravi, S.; Bhattacharya, P.K. Pervaporation of methyl–ethyl ketone and water mixture:
Determination of concentration profile. Desalination 2011, 277, 178–186. [CrossRef]
Sample Availability: Samples of the compounds are not available from the authors.
© 2020 by the authors. Licensee MDPI, Basel, Switzerland. This article is an open access
article distributed under the terms and conditions of the Creative Commons Attribution
(CC BY) license (http://creativecommons.org/licenses/by/4.0/).You can also read