Analysis of Massive MIMO Performance in an Indoor Picocell With High Number of Users
←
→
Page content transcription
If your browser does not render page correctly, please read the page content below
Received May 13, 2020, accepted May 30, 2020, date of publication June 8, 2020, date of current version June 18, 2020.
Digital Object Identifier 10.1109/ACCESS.2020.3000602

Analysis of Massive MIMO Performance in an
Indoor Picocell With High Number of Users
JESÚS R. PÉREZ , RAFAEL P. TORRES, MARTA DOMINGO, LUIS VALLE,
AND JOSÉ BASTERRECHEA , (Member, IEEE)
Department of Communications Engineering, Universidad de Cantabria, 39005 Santander, Spain
Corresponding author: Jesús R. Pérez (jesusramon.perez@unican.es)
This work was supported in part by the Spanish Ministerio de Economía, Industria y Competitividad, under Grant TEC2017-86779-C2-1-R,
in part by the European economic community (EEC) through Fondo Europeo de Desarrollo Regional (FEDER) funds, and in part by the
Spanish Ministerio de Ciencia e Innovación under Grant UCAN08-4E-010.

  ABSTRACT This paper presents an analysis of the massive multiple input and multiple output (MIMO)
  channel in an indoor picocell with a high number of active user terminals and a base station consisting of
  a virtual array with up to one hundred elements. The analysis is based on the results of a measurement
  campaign carried out in the 3.2 to 4 GHz band in a scenario of reduced size and with a symmetrical
  geometry, in which users are also placed in an orderly manner. The channel meets the condition of favorable
  propagation depending on several factors, one of the most important being the spatial distribution of users.
  Results concerning the inverse condition number as well as the channel sum capacity are included. Another
  factor that determines the performance of massive MIMO systems when operated in an orthogonal frequency
  division multiplexing (OFDM) framework is the frequency selectivity of the channel that limits the size of
  the coherence block (ChB). Focusing on the most significant results achieved, it can be concluded that the
  channel reaches a capacity of 89% with respect to an i.i.d. Rayleigh channel. Concerning the cumulative
  distribution function (CDF) of the sum capacity, it can also be observed that the tails are not very pronounced,
  which indicates that a homogeneous service can be given to all users. Regarding the number of samples that
  make up the ChB, although it is high in all cases (of the order of tens of thousands), it strongly depends on
  the degree of correlation used to calculate the coherence bandwidth.

  INDEX TERMS 5G mobile systems, channel capacity, coherence bandwidth, coherence block, massive
  MIMO.

I. INTRODUCTION                                                                                between the sub-channels established between the different
The evolution and subsequent deployment of the fifth                                           simultaneously active user terminals (UTs) and the base
generation of mobile communications systems (5G), as well                                      station (BS) array. For the case of a theoretical channel,
as the development of the next generation (6G) will require                                    known as i.i.d. Rayleigh, it is well established that this
the optimum use of the radio channel, enhancing the spectral                                   orthogonality increases as the number of antenna elements
efficiencies. In addition to the unquestionable need for more                                  of the array at the BS also grows [8]. In those cases
spectrum, the deployment of smaller cells and the develop-                                     in which this fact occurs we will say that the channel
ment of evolved multiple input and multiple output (MIMO)                                      meets the ‘‘favorable propagation’’ condition. Therefore,
systems are some examples of the representative enabling                                       it is important to know to what extent this condition is
technologies [1]. Initial MIMO systems were envisaged for                                      verified in real scenarios. In order to carry out such an
point-to-point communications [2], [3]. Later, the concepts                                    analysis, massive MIMO channels must be measured in
of multi-user MIMO were developed [4]–[6], which currently                                     different environments, frequency bands and system config-
have massive MIMO systems as one of their most promising                                       urations, i.e. for arrays with different numbers and types
form [7]–[14].                                                                                 of antennas, as well as for different spatial distributions of
   The performance of a massive MIMO system with respect                                       the UTs.
to the attainable capacity depends largely on the orthogonality                                   From the initial experimental research [15]–[18] to the
                                                                                               present, a great deal of work has been performed to
   The associate editor coordinating the review of this manuscript and                         empirically characterize massive MIMO channels in different
approving it for publication was Zesong Fei             .                                      environments and frequency bands. In this sense, a wide
                     This work is licensed under a Creative Commons Attribution 4.0 License. For more information, see https://creativecommons.org/licenses/by/4.0/
VOLUME 8, 2020                                                                                                                                                        107025
J. R. Pérez et al.: Analysis of Massive MIMO Performance in an Indoor Picocell With High Number of Users

bibliographic compilation can be found in [19]–[21]. In the
case of the characterization of the massive MIMO indoor
channels, it is worth highlighting, among others, the recent
works [21]–[25]. Unlike existing previous research works,
the distinctive feature of the current research is the consid-
eration of a small propagation environment in which up to
20 active UTs are considered. The small size of the cell along
with its symmetry, the shortage of furniture and the relative
closeness between UTs, form an interesting and realistic
environment in which the condition of favorable propagation
can be properly tested, as well as the possibility of separating
the UTs spatially. From the authors’ knowledge, the only
work that addresses a similar scenario is the one presented
in [26]. The conclusions obtained in our research complement
some of those of this previous work, and provide interesting
data on another crucial aspect for the proper functioning of             FIGURE 1. Front view of the measurement environment.
massive MIMO systems such as the temporal dispersion of
the channel and its impact on the duration of the coherence
block (ChB).                                                             B. MEASUREMENT SETUP
   In addition to the importance of the favorable propagation            The channel sounding is carried out using the measurement
condition in the spectral efficiency obtainable from a massive           system shown in Fig. 2, consisting of a planar scanner
MIMO system, the effective duration of the so-called                     and the E8362A Keysight Technologies vector network
coherence block is also another aspect of great relevance. The           analyzer (VNA), both remote controlled, to measure in the
coherence block is defined as the product of the channel’s               frequency domain the S21 (f ) scattering parameter, which
coherence bandwidth (BC ) and the coherence time (TC ).                  corresponds with the H (f ) or complex channel transfer
We can say that during this frequency-time block, the channel            function (CTF) [27].
can be considered flat in frequency and invariant in time
and thus, the estimation of the channel is kept up to date.
Therefore, the measurement and knowledge of both the BC
and TC values of the channel is also very important. In this
article, the authors present experimental results of the BC
values achieved for the indoor environment considered. The
cumulative distribution functions (CDF) of this parameter for
several levels of coherence are presented, which provides
a statistical estimate of the values that the BC may reach
in such an environment. In addition, results showing the
variability of the BC between the antenna elements of the
BS array are presented. Taking into account the influence
of the BC on the duration of the frequency-time coherence
block and its role in the time division duplex (TDD) operation
framework, knowing its value is crucial for dimensioning cur-            FIGURE 2. Schematic diagram of the channel measurement setup.

rent massive MIMO systems operating on the OFDM-TDD
basis.                                                                      The planar scanner consists of two linear units and
                                                                         two associated servomotors and allows the receiver (Rx)
                                                                         antenna to be moved on a vertical plane emulating a virtual
II. CHANNEL MEASUREMENTS                                                 array (VA) at the receiver side. At every Rx position of the
A. ENVIRONMENT                                                           VA the S21 -trace is acquired and, from the post-processing,
The channel measurements have been carried out in a                      the CTF as well as a complete characterization of the channel
conference room, equipped with six rows of desks, chairs and             established between the transmitter (Tx), i.e. an active user
two cabinets as the main furniture inside the environment.               terminal (UT), and the Rx VA, i.e. the array at the base
Moreover, the environment is located in a modern building                station (BS), can be accomplished.
made of reinforced concrete, with indoor ceiling boards,                    Regarding the antennas and noticing that the analysis
plasterboard paneled walls as well as metallic doors in all              will be focused on the up-link, a biconical omnidirectional
the rooms [27]. Fig. 1 shows a view of the propagation                   EM-6865 antenna from Electrometrics along with a
environment which is 8.8 by 14.5 meters in size and the height           log-periodic HG2458-08LP antenna from L-Com, both
to the ceiling board is 2.98 m.                                          linearly polarized, have been used at Tx and Rx

107026                                                                                                                                 VOLUME 8, 2020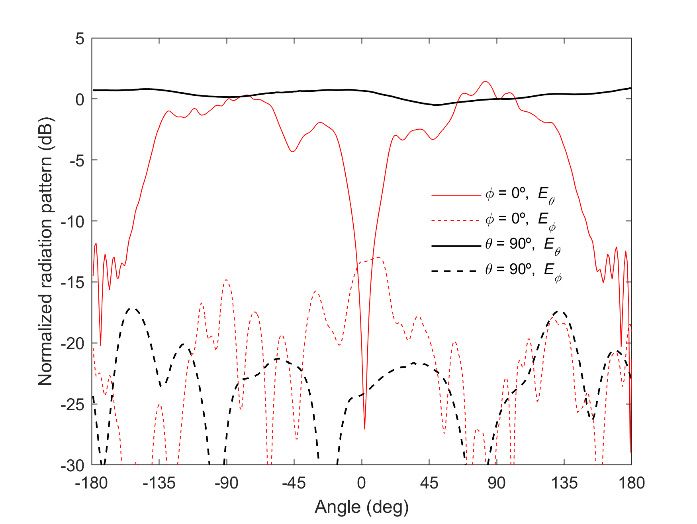
J. R. Pérez et al.: Analysis of Massive MIMO Performance in an Indoor Picocell With High Number of Users

                                                                                  antenna was centered on the roll over azimuth positioner
                                                                                  with the main lobe pointing along the z-axis and the main
                                                                                  polarization component aligned with the x-axis. As can be
                                                                                  seen in Figure 3(b), the log periodic antenna exhibits a
                                                                                  half power beamwidth of approximately 50◦ on both cuts
                                                                                  (E-plane: φ = 0◦ cut, H-plane: φ = 90◦ cut) and crosspolar
                                                                                  levels below −25 dB within the main lobe. In this case, levels
                                                                                  for angles further from ±140◦ cannot be taken into account
                                                                                  due to the blockage of the roll positioner for both cuts. Gain
                                                                                  measurements at 4 GHz provided values of 1.3 and 10.4 dBi
                                                                                  for both the biconical and log-periodic antennas, respectively.

                                                                                   C. MEASUREMENT SETTINGS
                                                                                  The S21 (f ) scattering parameter has been measured in the
                                                                                  3.2 to 4 GHz frequency range, considering for the S21 -trace
                                                                                  Nf = 641 frequency tones 1f = 1.25 MHz uniformly
                                                                                  spaced in the 800 MHz span, i.e. a sampled version of the
                                                                                  H (f ) or CTF is obtained for any Tx-Rx wireless channel.
                                                                                  The frequency resolution considered (1f ) corresponds with
                                                                                  a maximum excess delay without aliasing of 1/1f = 800 ns,
                                                                                  leading to a maximum observable distance of 240 m (stated
                                                                                  as c0 /1f , c0 being the speed of light), a value far larger than
                                                                                  the dimensions of the environment and enough to guarantee
                                                                                  that the multipath contributions are properly measured [28].
                                                                                  Further settings of the VNA include a signal level at port
                                                                                  1 of 7 dBm as well as an intermediate frequency (IF) filter
                                                                                  bandwidth of 1 kHz as an appropriate trade-off between
                                                                                  dynamic range and acquisition time. In this sense, it must
                                                                                  be stated that the average signal to noise ratio (SNR) for
                                                                                  any of the measurements carried out in this work is above
FIGURE 3. Normalized measured radiation patterns cuts at 4 GHz for the            40 dB. Finally, it should be noted that prior to carrying out
antennas considered. (a) EM-6865 antenna. (b) HG2458-08LP antenna.
                                                                                  the measurement campaign, the VNA has been calibrated at
                                                                                  both ends of the radiofrequency cables, so the measured CTF
                                                                                  takes into account the joint response of both the channel and
sides, respectively. The EM-6865 operates in the range                            the antennas, called in the literature the radio channel [29].
2-18 GHz and the HG2458-08LP in the range 2.3-6.5 GHz.                               For the measurement campaign and trying to resemble the
Figure 3 shows the two main cuts of the normalized radiation                      up-link in a massive MIMO system, the scanner, and thus
pattern at 4 GHz measured for both antennas in our anechoic                       the Rx directional antenna, has been placed close to the rear
chamber. To carry out the pattern measurements, the biconical                     wall of the room and with the center of the VA at a height
antenna was connected to the roll positioner with the same                        of 2 m. Moreover, the Tx antenna, which would emulate
cylindrical metallic rod, 25 cm in length, used to support                        an active UT, has been placed at 20 different positions on
the antenna during the channel measurements campaign, and                         the tables of the environment, fixed on a 25 cm rod and
centered at the midpoint of the bicone and with its axis                          at a height of 1.07 m from the floor. For any of the Tx
aligned with the z-axis of the anechoic chamber measurement                       antenna positions considered, the Rx moves on the YZ plane
system. As can be seen in Figure 3(a), the antenna shows                          implementing a 10 × 10 uniform rectangular array (URA)
an almost omnidirectional behavior with a ripple of around                        with an inter-element separation in both directions of 50 mm
1 dB on the horizontal plane (θ = 90◦ cut) and crosspolar                         (λ/2 at 3 GHz or 0.53 λ at 3.2 GHz). This Rx configuration
levels below −15 dB. For the vertical plane (φ = 0◦ cut),                         leads to a total scanning area of the URA of 4.82 λ2 at
a ripple of around 1 dB, which is attributed to the combined                      3.2 GHz. Details of the set of Tx/UT positions considered,
effect of the metallic supporting rod and the base plate, can be                  all in line-of-sight (LOS) conditions, as well as the location
observed and has not been corrected to reproduce the channel                      chosen for the Rx/BS is shown in Fig. 4. The Tx-Rx
measurement configuration in the most realistic way. It has                       (or UT-BS) distances lie in the range 4.1-11.2 m and a
to be taken into account that, for the vertical plane cut, levels                 complete measurement for any of the Tx/UT position takes
for angles higher than ±140◦ must be disregarded due to                           around 17 minutes.
the blockage effect of the positioner during measurements.                           Finally, Table 1 summarizes the main parameters concern-
Moreover, for the pattern measurements, the log-periodic                          ing the measurement settings outlined in this subsection.

VOLUME 8, 2020                                                                                                                              107027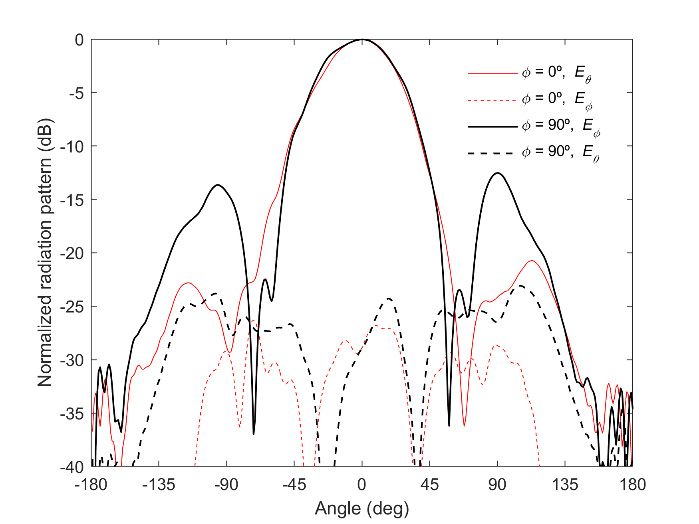
J. R. Pérez et al.: Analysis of Massive MIMO Performance in an Indoor Picocell With High Number of Users

                                                                             dispersion caused by the channel. It is calculated as [29]:
                                                                                                  v
                                                                                                  u PNf
                                                                                                  u        (τn − τ̄ )2 P[n]
                                                                                          τRMS = t n=1PN                                 (2)
                                                                                                              f
                                                                                                            n=1  P[n]
                                                                             where τn is the n-th excess delay time and τ̄ is given by:
                                                                                                       PNf
                                                                                                             τn P[n]
                                                                                                  τ̄ = Pn=1
                                                                                                          Nf
                                                                                                                                        (3)
                                                                                                          n=1 P[n]
                                                                                From the temporal dispersion the channel frequency selec-
                                                                             tivity can be obtained. For wide-sense stationary uncorrelated
                                                                             scattering channels, the normalized frequency correlation
                                                                             function, denoted by RHH [l], can be obtained by means of
                                                                             the Fourier transform of the PDP [29]:
                                                                                                   PNf −1
                                                                                                                 2         2π
                                                                                                      n=0  |h[n]|  exp   j Nf nl
                                                                                        RHH [l] =         PNf −1                        (4)
                                                                                                                  |h[n]|2
                                                                                                            n=0
FIGURE 4. Top view of the indoor environment. The arrow shows the Rx           Finally, from the correlation function the coherence
antenna broadside direction.                                                 bandwidths (BC ) for different correlation levels can be
                                                                             obtained [29].
TABLE 1. Representative parameters of the measurement settings.

                                                                             B. UPLINK MASSIVE MIMO SYSTEM MODEL
                                                                             Focusing the analysis on the up-link, the massive MIMO
                                                                             system considered is a simple cell system where the BS is
                                                                             equipped with M antennas. The maximum number of active
                                                                             users is Q and each user terminal (UT) is equipped with a
                                                                             single antenna, as depicted in Fig. 5. It is assumed that the
                                                                             users transmit a total power P. In addition, it is assumed
                                                                             that the BS knows the channel and that the UTs are not
                                                                             collaborating among each other. Furthermore, we consider an
                                                                             OFDM system with Nf sub-carriers, which corresponds to the
                                                                             measured tones.
  The analysis of the effect of people on the wireless channel
performance is beyond the scope of this research, so it should
be noted that all the channel measurements have been carried
out at night in order to guarantee stationary conditions.

III. CHANNEL CHARACTERISATION
A. BROADBAND CHANNEL CHARACTERISATION
The channel impulse response can be obtained by applying
the inverse discrete Fourier transform to the measured
transfer function H (f ), i.e. the measured S21 (f ) for the Nf
frequency tones, as shown in (1). Furthermore, this channel
transfer function has also been windowed with a Hamming
window, W , in order to reduce sidelobe levels.
                    Nf −1                                                  FIGURE 5. Massive MIMO system.
                 1 X                        2π
         h [n] =           W [k] H [k] exp j kn              (1)
                 Nf                          Nf
                       k=0                                                      Considering this model, the signal received at the base
   From the channel impulse response, the power delay                        station for the k-th sub-carrier when the Q users are active
profile (PDP) is then obtained as P [n] = |h [n]|2 and,                      will be given by:
from the PDP, some useful magnitudes can be obtained                                   √
                                                                                y[k] = SNR G[k] · s[k] + n[k]; k = 1, 2, · · · , Nf (5)
to characterize the channel in the time domain. The root
mean square (RMS) delay spread is the statistical parameter                  where y[k] is a received signal column vector with M
obtained from the PDP that best describes the signal                         elements corresponding to the k-th sub-carrier; G[k] is the

107028                                                                                                                                     VOLUME 8, 2020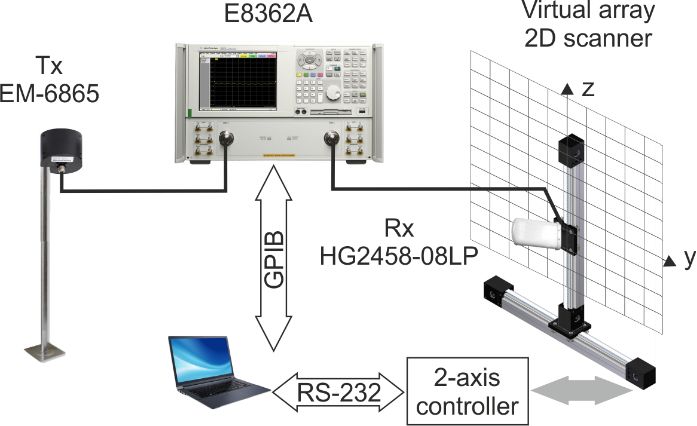
J. R. Pérez et al.: Analysis of Massive MIMO Performance in an Indoor Picocell With High Number of Users

channel matrix of order M × Q, in which each one of its                              The spectral efficiency that massive MIMO systems can
columns corresponds with the narrowband channel gq [k] of                         achieve depends largely on the degree to which the condition
order M ×1; s[k] (Q×1) is the signals vector transmitted from                     of ‘‘favorable propagation’’ is met, which depends on the
the UTs and normalized in such a way that E ksk2 = 1;

                                                                                  extent to which the channels of the different users are
and n[k] is a complex Gaussian noise vector with i.i.d. unit                      orthogonal [8]–[12]. A commonly accepted metric used to
variance elements. Finally, the SNR represents the mean                           weigh up the orthogonality of the columns of a matrix is
signal to noise ratio at the receiver.                                            the condition number, κ, which is also a measure of the
   The matrix in (5) is normalized in such a way that verifies:                   dispersion of the singular values of the matrix. The condition
                      n       o                                                   number of a matrix G is defined by the relationship:
                        kGk2F = M · Q                       (6)
                                                                                                      max eigenvalue GH G

  Moreover, the matrix G is obtained from the matrix of the                                     κ=                                        (10)
                                                                                                      min eigenvalue GH G
raw channel measurements (Graw ) by means of:
                                                                                     According to (10), a value of κ equal to one corresponds
                       GM ×Q = Graw
                                M ×Q JQ×Q                               (7)       to a channel matrix in which all its columns are orthogonal.
   The normalization matrix J is a diagonal matrix of order                       Conversely, high values of κ indicate that at least two columns
Q × Q. Different normalizations can be considered, provided                       of the matrix will be practically collinear. It is more suitable
they verify (6), which guarantees the conservation of the                         in order to interpret the results to use the inverse of the
total transmitted power. Following the proposal and the                           condition number (ICN), which varies between 1 (maximum
nomenclature in [11] we consider two normalizations that we                       orthogonality) and 0 (zero orthogonality).
will denote as normalization 1 (N1) and normalization 2 (N2).                        To have a direct measure of the goodness of the channel
   On the one hand, in case of considering N1, the normal-                        we calculate the sum capacity. Under the hypothesis of a
ization matrix J is a diagonal matrix of order Q × Q, whose                       perfect knowledge of the channel at the BS, we can obtain
elements (jq ) are given by                                                       the sum-capacity of the massive MIMO-OFDM system by
            v                                                                     means of the breakdown into singular values of the channel
            u            M                                                        matrix as
       jq = u                        2
                                       ; q = 1, . . . , Q (8)
                                                                                             Q
            t PN
                 1     f
                           g raw [k]                                                        X               SNR
                Nf    k=1 q                                                         C (k) =     log2 1 +          · λq ; k = 1, 2, · · · , Nf
                                                                                                             Q
   The elements of the diagonal normalization matrix J take                                    q=1
different values so that all the columns in G are normalized to                                                                              (11)
one; consequently the power imbalance between the channels                        in which λq represents the q-th eigenvalue of the GH G matrix,
corresponding to each UT is eliminated, although the channel                      i.e. the square of the q-th singular value of the G matrix.
variations between antennas within the receiver array and                            Under favorable propagation conditions, as the number of
frequency tones are maintained. The resulting normalized                          receiving antennas, M , increases to infinity, and for a fixed
matrix, G, can be interpreted as that associated with a system                    number of transmitters Q, the capacity of the up-link channel
in which an ideal power control is performed. In this case,                       will tend asymptotically to the upper bound [12]:
the total available power transmitted by the users is not
distributed equally, but each UT is assigned the necessary                                                             M · SNR
                                                                                                 Cb = Q · log2 1 +                            (12)
power so that all UTs reach the BS with the same mean power.                                                              Q
   On the other hand, N2 is defined in such a way that all
                                                                                   IV. RESULTS
the elements of the diagonal matrix J are equal and thus,
the operation in (7) is equivalent to multiply the matrix by                      For the massive MIMO cell presented previously, this section
a scalar:                                                                         includes the most representative results concerning the
             v                                                                    temporal dispersion of the channel, its frequency selectivity
             u           MQ                                                       and the sum capacity. First, both the measured coherence
       j q = t PN                       ; q = 1, . . . , Q  (9)
             u
                1      f
                          |G  raw [k]|2                                           bandwidth and RMS delay spread values are presented and
               Nf     k=1             F
                                                                                  discussed. Secondly, an analysis of the channel sum capacity
   This normalization keeps the difference between the                            as a function of system parameters like the SNR or the number
received power from different UTs, receiver antennas and                          of radiating elements at the BS for different number of active
frequency tones.                                                                  users are included.
   Both N1 and N2 normalizations have their pros and cons.
The N2 preserves the original structure of the channel and                        A. TEMPORAL DISPERSION AND FREQUENCY
the effect that the power imbalance can have on the system.                       SELECTIVITY
However, if the aim is to avoid the effect of the power                           Wideband communication systems are strongly influenced by
imbalance and exclusively analyse the orthogonality of the                        the temporal dispersion of the transmitted signals caused by
channel, for example through the condition number, it is                          the channel, which is the origin of the frequency selectivity.
mandatory to use N1 [11].                                                         As outlined in the previous section, channel parameters such

VOLUME 8, 2020                                                                                                                             107029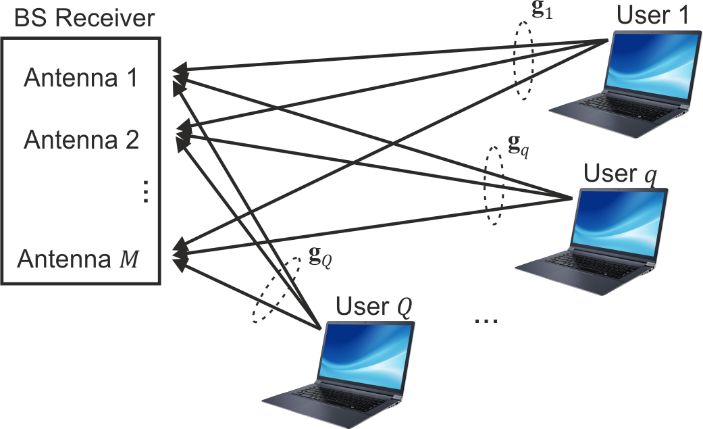
J. R. Pérez et al.: Analysis of Massive MIMO Performance in an Indoor Picocell With High Number of Users

as the mean delay and the RMS delay spread can be directly
obtained from the PDP, and the coherence bandwidth at
different levels of correlation, which quantifies the frequency
selectivity of the channel, depends also on the PDP. In this
subsection, results involving these parameters are presented
and discussed.

                                                                               FIGURE 7. RMS delay spread values for the whole scenario.

                                                                               investigated. No dependence with the position of the UTs or
                                                                               on the distances between them and the BS is appreciated.

FIGURE 6. Representative PDP considering UT10 and showing details of
the some relevant contributions of the multipath. R1 and R2 stands for
first and second order reflections.

   In Fig. 6, we present the PDPs corresponding to
the100 channels established between UT10 and the 100 anten-
nas at the BS. The results shown are representative of what
happens as a general trend for the rest of the measured
UT positions. The black line represents the average PDP.
An important variability is observed in the received power
values for different delay times, especially on the interval
between 20 and 60 ns, in which the variability margin
                                                                               FIGURE 8. CDF of the RMS delay spread.
reaches +/ − 6 dB with respect to the average value.
This variability will be present in the values of the RMS                         The associated CDF of the RMS delay spread for all the
delay spread and BC obtained. The contributions in this                        UTs is shown in Fig. 8. It takes values between approximately
time interval correspond mainly with first and higher order                    17 and 43 ns, which agrees with the values reported in [27] in
reflections in the environment close to the BS. Furthermore,                   which values lie within the range of 18 and 35 ns for a similar
the average PDP presents a series of maxima or peaks to                        indoor environment and measurement frequency band.
which all the antennas contribute almost simultaneously and                       Fig. 9 shows the BC values obtained for 50%, 70% and
which correspond to reflections from larger and more distant                   90% of correlation levels. In accordance with the values of
reflectors. In Fig. 6, the maximum #1 is due to double                         the RMS delay spread obtained, a significant dispersion of
reflections (R2) between the sidewalls; #2 is caused by a very                 the BC values is observed for most UTs, and this dispersion
strong reflection (R1) on the metallic door on the back wall                   decreases as the degree of coherence increases.
of the room. The peak #3 originates from R2 between the                           Fig. 10 shows the CDF of the coherence bandwidth for the
sidewalls and the back wall; and finally the maximum #4 is                     three levels of correlation considered, and the most significant
due to R2 on the metallic door of the room.                                    values of BC for the three correlation levels are summarized
   Fig. 7 shows the RMS delay spread values obtained                           in Table 2.
for each UT along the antenna elements that make up                               The minimum coherence bandwidth values range from
the array. The top and bottom of each box represent the                        1.7 to 4.8 MHz, whereas the maximum values obtained lie
25% and 75% percentiles of the samples, respectively; and                      in the range of 44.1 to 286.1 MHz. Moreover, the median
thus, the distance between both top and bottom of the                          values range from 2.5 to 117.5 MHz, and the 10% outage
box represents the interquartile range. Whiskers are drawn                     BC values range from 2.0 to 7.6 MHz for the 90 and 50%
from the ends of the interquartile ranges to the furthest                      correlation level cases, respectively. A significant effect is the
observations. A great dispersion of the RMS delay spread                       convergence of the CDF at the lower end of the curves in such
values achieved is observed for most of the UT positions                       a way that the 10% outage coherence bandwidth values are

107030                                                                                                                                       VOLUME 8, 2020
J. R. Pérez et al.: Analysis of Massive MIMO Performance in an Indoor Picocell With High Number of Users
FIGURE 10. CDF of the coherence bandwidth for different correlation
levels.
TABLE 2. Significant values of coherence bandwidth for different
correlation levels. Values in MHz.
If we make a rough estimate of the TC following the Clarke
model [29], [30], then the coherence time of the channel at a
correlation level of 70% can be obtained from the expression:
9λ
TC = (13)
16 π v
If we consider a typical indoor speed of v = 0.75 m/s
(2.7 km/h) we obtain a TC value of approximately 20 ms at
the central frequency (3.6 GHz). Thus, considering the BC
values shown in Table 2, we obtain the NC values summarized
in Table 3.
TABLE 3. Number of samples of the coherence block, NC . Values ×103 .
FIGURE 9. Coherence bandwidth for different correlation levels. (a) 50%.
(b) 70%. (c) 90%.
of the same order of magnitudes for all the three correlation The results in Table 3 show remarkable differences
levels with an approximate ratio of two between them. between the ChB samples depending on the correlation
In massive MIMO networks operated in an OFDM frame- level. Therefore, it is important to determine which degree
work, the duration of the ChB is the key when determining of correlation should be required to consider the channel
the overhead due to channel estimation. A coherence block effectively flat fading during BC . Likewise, the dispersion
consists of the number of subcarriers and time samples of the NC values shows the convenience of having more
over which the channel response can be approximated as experimental data, not only of BC values, but also of TC . This
constant in time and flat fading in frequency. If the coherence is especially relevant for outdoor channels with high mobility,
bandwidth is BC and the coherence time is TC , then each ChB where NC can decrease by several orders of magnitude,
contains NC = BC TC samples. reaching values of only a few hundred samples.
VOLUME 8, 2020 107031J. R. Pérez et al.: Analysis of Massive MIMO Performance in an Indoor Picocell With High Number of Users
FIGURE 11. CDF of the inverse condition number.
B. INVERSE CONDITION NUMBER AND SUM CAPACITY
Fig. 11 shows the CDF of the inverse condition number (ICN)
for this environment as well as for the i.i.d. Rayleigh
channels for different number of active UTs, Q, ranging
from 4 to 20. In all cases the ICN reached is far below the
i.i.d. Rayleigh cases. This means that, as might be expected,
there is a loss of orthogonality with respect to the theoretical
uncorrelated channels. The loss of orthogonality of the
channels can also be observed when the number of users, Q,
increases.
Fig. 12(a) presents the CDF of the sum capacity for the
environment when N1 is considered, along with the i.i.d.
Rayleigh channel cases for a SNR of 10 dB and for different
number of active UTs, Q, ranging from 4 to 20. Once again, FIGURE 12. CDF of the sum capacity.(a) Comparison with the i.i.d.
the results show how the measured capacities are lower than Rayleigh channel. (b) Comparison between the current normalization (N1)
and a global one (N2).
the ones corresponding to the i.i.d. channels. Mean capacities
decrease with respect to the i.i.d. Rayleigh channels case
as the number of UTs increases. However, in the most
unfavorable case of having 20 active UTs, a medium value
capacity of 89% of the i.i.d. Rayleigh channel is achieved.
In Fig. 12(b), a comparison between the sum capacity CDFs
obtained when using both N1 and N2 normalizations is
presented. As already found in [25], the capacity obtained
using N1, i.e. compensating for the power imbalance between
users, is greater than when it is maintained. In this sense, it can
be concluded that a power control is adequate, especially
when the number of active users increases. Moreover, it is
important to note that in both cases the tails of the CDFs are
not very pronounced, which indicates that a homogeneous
service can be given to all UTs.
Fig. 13 shows the mean capacity as a function of the SNR FIGURE 13. Mean capacity of the system against the SNR.
for different number of UTs, ranging from 4 to 20. Moreover,
the figure also shows the associated i.i.d. Rayleigh channel
cases. It can be clearly observed the increased loss of capacity cases are also included as well as the asymptotic value
with respect to the Rayleigh channel cases as Q increases. of 113.5 bit/s/Hz for Q = 20 users and M = 100 antennas.
This loss remains almost constant for SNR values higher than An increase of capacity with the number of antennas at the BS
around 5 dB. can be observed. However, the measured capacities remain
Finally, Fig. 14 shows the mean value of the capacity for below the values obtained for the theoretical channels, with
different number of UTs as the number of antennas at the BS losses of the order of 10 bit/s/Hz for Q = 20. It is also
site increases from 25 to 100. The i.i.d. Rayleigh channel observed that the slope of the mean capacity curve versus the
107032 VOLUME 8, 2020J. R. Pérez et al.: Analysis of Massive MIMO Performance in an Indoor Picocell With High Number of Users
of BC values, but also of TC . This is especially relevant
for outdoor channels with high mobility, in which NC can
decrease by several orders of magnitude, reaching values of
only a few hundred samples.
The ICN values show that the massive MIMO channel
presents a loss of orthogonality with respect to the reference
i.i.d. Rayleigh channel. This loss of orthogonality is also
reflected in the sum capacity. However, high capacity values
are obtained, i.e. in the case of 20 active UTs, the channel
reaches a capacity of 89% with respect to an i.i.d Rayleigh
channel, which for a SNR of 10 dB is 98.7 bits/s/Hz. It is also
observed that the slope of the mean capacity curve versus the
number of antennas at the BS reaches the level of that of the
reference channels for a ratio M /Q = 4. Concerning the CDF
FIGURE 14. Mean capacity of the system against the number of antennas of the sum capacity, it can also be observed that the tails are
considered at the base station (BS).
not very pronounced, which indicates that a homogeneous
service can be given to all UTs. Consequently, it can be
number of antennas at the BS reaches that of the reference affirmed that the massive MIMO channel analyzed allows
channels when the M /Q ratio is approximately 4. users to be spatially separated despite their high number and
proximity.
V. CONCLUSION
The aim of this research focuses on the experimental REFERENCES
analysis of a massive MIMO channel in an indoor picocell, [1] IMT Vision—Framework and Overall Objectives of the Future Develop-
considering a high number of active users. The measurements ment of IMT for 2020 and Beyond, document Recommendation ITU-
R M.2083-0, 2015.
carried out emulate a realistic environment in which a BS, [2] G. J. Foschini and M. J. Gans, ‘‘On Limits of wireless communications in
with up to 100 antenna elements making up the virtual array, a fading environment when using multiple antennas,’’ Wireless Pers. Com-
covers a medium-sized meeting room in which the users mun., vol. 6, no. 3, pp. 311–335, 1998, doi: 10.1023/A:1008889222784.
[3] E. Telatar, ‘‘Capacity of multi-antenna Gaussian channels,’’ Eur. Trans.
are sitting down and the active devices can resemble either Telecommun., vol. 10, no. 6, pp. 585–595, Nov. 1999.
laptops or mobile phones at the tables. In addition, the room [4] G. Caire and S. Shamai, ‘‘On the achievable throughput of a multiantenna
is very poorly furnished and the resulting configuration is Gaussian broadcast channel,’’ IEEE Trans. Inf. Theory, vol. 49, no. 7,
pp. 1691–1706, Jul. 2003, doi: 10.1109/TIT.2003.813523.
of high symmetry. Therefore, it is an interesting situation to [5] S. Vishwanath, N. Jindal, and A. Goldsmith, ‘‘Duality, achievable rates,
assess to what extent the ‘‘favorable propagation’’ condition sum-rate capacity of Gaussian MIMO broadcast channels,’’ IEEE Trans.
is satisfied, and to evaluate the expected values of the BC Inf. Theory, vol. 49, no. 10, pp. 2658–2668, Oct. 2003, doi: 10.1109/
TIT.2003.817421.
achieved. [6] D. Gesbert, M. Kountouris, R. W. Heath, C.-B. Chae, and T. Salzer,
Focusing on the results achieved and regarding the ‘‘Shifting the MIMO paradigm,’’ IEEE Signal Process. Mag., vol. 24, no. 5,
temporal dispersion of the channel, a great variability of pp. 36–46, Sep. 2007, doi: 10.1109/MSP.2007.904815.
[7] T. L. Marzetta, ‘‘How much training is required for multiuser MIMO?’’ in
the values of the mean square delay, and consequently of Proc. Fortieth Asilomar Conf. Signals, Syst. Comput., 2006, pp. 359–363.
the coherence bandwidth can be observed. The coherence [8] T. L. Marzetta, ‘‘Noncooperative cellular wireless with unlimited numbers
bandwidths obtained show very scattered values, not only of base station antennas,’’ IEEE Trans. Wireless Commun., vol. 9, no. 11,
pp. 3590–3600, Nov. 2010, doi: 10.1109/TWC.2010.092810.091092.
among different UTs, but also for the M sub-channels [9] E. Björnson, E. G. Larsson, and T. L. Marzetta, ‘‘Massive MIMO: Ten
established between a specific UT and the BS. The CDF of myths and one critical question,’’ IEEE Commun. Mag., vol. 54, no. 2,
the BC obtained for the three correlation values considered pp. 114–123, Feb. 2016.
[10] T. E. Bogale and L. B. Le, ‘‘Massive MIMO and mmWave for 5G wireless
present a significant convergence in the lower tail of the HetNet: Potential benefits and challenges,’’ IEEE Veh. Technol. Mag.,
CDF, so the 10% outage BC values achieved are of the vol. 11, no. 1, pp. 64–75, Mar. 2016, doi: 10.1109/MVT.2015.2496240.
same order of magnitude for the all three correlation levels. [11] X. Gao, O. Edfors, F. Rusek, and F. Tufvesson, ‘‘Massive MIMO per-
formance evaluation based on measured propagation data,’’ IEEE Trans.
However, the 10% outage BC values practically double Wireless Commun., vol. 14, no. 7, pp. 3899–3911, Jul. 2015, doi: 10.1109/
when the correlation level falls from 90% (2.0 MHz) to TWC.2015.2414413.
70% (4.1 MHz) and 50% (7.6 MHz). This fact is of great [12] F. Rusek, D. Persson, B. Kiong Lau, E. G. Larsson, T. L. Marzetta, and
F. Tufvesson, ‘‘Scaling up MIMO: Opportunities and challenges with
importance in the definition of the coherence block in very large arrays,’’ IEEE Signal Process. Mag., vol. 30, no. 1, pp. 40–60,
the systems operated in the MU-MIMO-OFDM scheme. Jan. 2013, doi: 10.1109/MSP.2011.2178495.
The results show remarkable differences between the ChB [13] E. G. Larsson, O. Edfors, F. Tufvesson, and T. L. Marzetta, ‘‘Massive
MIMO for next generation wireless systems,’’ IEEE Commun. Mag.,
samples depending on the correlation level. Therefore, it is vol. 52, no. 2, pp. 186–195, Feb. 2014, doi: 10.1109/MCOM.2014.
important to determine which degree of correlation should 6736761.
be required to consider the channel effectively flat fading [14] H. Quoc Ngo, E. G. Larsson, and T. L. Marzetta, ‘‘Energy and spectral
efficiency of very large multiuser MIMO systems,’’ IEEE Trans. Commun.,
during BC . Likewise, the dispersion of the NC values shows vol. 61, no. 4, pp. 1436–1449, Apr. 2013, doi: 10.1109/TCOMM.
the convenience of having more experimental data, not only 2013.020413.110848.
VOLUME 8, 2020 107033J. R. Pérez et al.: Analysis of Massive MIMO Performance in an Indoor Picocell With High Number of Users
[15] S. Payami and F. Tufvesson, ‘‘Channel measurements and analysis for very RAFAEL P. TORRES received the M.S. degree in
large array systems at 2.6 GHz,’’ in Proc. 6th Eur. Conf. Antennas Propag. physics from Granada University, Spain, in 1986,
(EUCAP), Mar. 2012, pp. 433–437. and the Ph.D. degree in telecommunications engi-
[16] J. Hoydis, C. Hoek, T. Wild, and S. ten Brink, ‘‘Channel measurements neering from the Polytechnic University of Madrid
for large antenna arrays,’’ in Proc. Int. Symp. Wireless Commun. Syst. (UPM), in 1990. He became an Associate Pro-
(ISWCS), Aug. 2012, pp. 811–815. fessor with the Department of Communications
[17] J. Li and Y. Zhao, ‘‘Channel characterization and modeling for large-scale
Engineering, Universidad de Cantabria, Spain,
antenna systems,’’ in Proc. 14th Int. Symp. Commun. Inf. Technol. (ISCIT),
Sep. 2014, pp. 559–563.
where he is currently a Full Professor in signal
[18] B. Zhang, Z. Zhong, B. Ai, R. He, F. Tufvesson, J. Flordelis, Q. Wang, and processing and communications engineering. His
J. Li, ‘‘Empirical evaluation of indoor multi-user MIMO channels with fundamental lines of research have been in the
linear and planar large antenna arrays,’’ in Proc. IEEE 28th Annu. Int. development of numerical methods for the analysis and design of antennas,
Symp. Pers., Indoor, Mobile Radio Commun. (PIMRC), Oct. 2017, pp. 1–6. the applications of high-frequency techniques for simulation, and the
[19] J. Zhang, M. Shafi, A. F. Molisch, F. Tufvesson, S. Wu, and K. Kitao, analysis of the radar section, as well as the design of radar systems. Since
‘‘Channel models and measurements for 5G,’’ IEEE Commun. Mag., the 1990s, his research has been focusing on the study, modeling, and
vol. 56, no. 12, pp. 12–13, Dec. 2018, doi: 10.1109/MCOM.2018.8570033. measurement of the radio channel, and the analysis of its impact on mobile
[20] Z. Lin, X. Du, H.-H. Chen, B. Ai, Z. Chen, and D. Wu, ‘‘Millimeter- and wireless communications systems. His main achievements focus on
wave propagation modeling and measurements for 5G mobile networks,’’ the development of ray-tracing methods to simulate the radio channel in
IEEE Wireless Commun., vol. 26, no. 1, pp. 72–77, Feb. 2019, doi: 10. complex propagation environments, the experimental characterization of the
1109/MWC.2019.1800035. channel, both SISO and MIMO, and the development of space-time coding
[21] F. Challita, P. Laly, M. Liénard, E. Tanghe, W. Joseph, and D. P. Gaillot,
techniques.
‘‘Hybrid virtual polarimetric massive MIMO measurements at 1.35 GHz,’’
IET Microw., Antennas Propag., vol. 13, no. 15, pp. 2610–2618, Dec. 2019,
doi: 10.1049/iet-map.2018.6120.
[22] F. Challita, M.-T. Martinez-Ingles, M. Lienard,
J.-M. Molina-Garcia-Pardo, and D. P. Gaillot, ‘‘Line-of-Sight massive
MIMO channel characteristics in an indoor scenario at 94 GHz,’’ IEEE MARTA DOMINGO received the M.Sc. and
Access, vol. 6, pp. 62361–62370, 2018, doi: 10.1109/ACCESS.2018. Ph.D. degrees in physics (electronics) from the
2876225. Universidad de Cantabria, in 1989 and 1994,
[23] A. O. Martinez, J. O. Nielsen, E. De Carvalho, and P. Popovski, ‘‘An exper- respectively. She became an Associate Professor
imental study of massive MIMO properties in 5G scenarios,’’ IEEE Trans.
with the Department of Communication Engineer-
Antennas Propag., vol. 66, no. 12, pp. 7206–7215, Dec. 2018, doi: 10.
1109/TAP.2018.2871881.
ing, Universidad de Cantabria. She was involved in
[24] E. L. Bengtsson, F. Rusek, P. C. Karlsson, F. Tufvesson, and O. Edfors, several research projects, and she has authored sev-
‘‘Simulation of multiple-antenna terminal performance in massive MIMO eral articles and conference papers. Her research
systems based on indoor measurements,’’ IEEE Trans. Veh. Technol., interests include numerical and high-frequency
vol. 69, no. 1, pp. 418–427, Jan. 2020, doi: 10.1109/TVT.2019.2949738. methods, simulation and measurement techniques
[25] J. R. Perez and R. P. Torres, ‘‘On the impact of the radiation pattern of the for radio propagation, and channel characterization for wireless and mobile
antenna element on MU-MIMO indoor channels,’’ IEEE Access, vol. 8, communications.
pp. 25459–25467, 2020, doi: 10.1109/ACCESS.2020.2970769.
[26] J. Flordelis, F. Rusek, X. Gao, G. Dahman, O. Edfors, and F. Tufvesson,
‘‘Spatial separation of closely-located users in measured massive MIMO
channels,’’ IEEE Access, vol. 6, pp. 40253–40266, 2018, doi: 10.1109/
ACCESS.2018.2854307.
[27] J. R. Perez, R. P. Torres, L. Rubio, J. Basterrechea, M. Domingo, V. M. LUIS VALLE received the M.Sc. and Ph.D. degrees
R. Penarrocha, and J. Reig, ‘‘Empirical characterization of the indoor in physics (electronics) from the Universidad
radio channel for array antenna systems in the 3 to 4 GHz frequency de Cantabria, Spain, in 1990 and 1996, respec-
band,’’ IEEE Access, vol. 7, pp. 94725–94736, 2019, doi: 10.1109/ tively. He became an Associate Professor with
ACCESS.2019.2928421. the Department of Communication Engineering,
[28] L. Rubio, R. P. Torres, V. M. Rodrigo, J. R. Pérez, H. Fernández, Universidad de Cantabria. He has authored several
J. M. Molina, and J. Reig, ‘‘Contribution to the channel path loss articles and conference papers. His research inter-
and time-dispersion characterization in an office environment at 26 ests include numerical and high-frequency meth-
GHz,’’ Electronics, vol. 8, no. 11, 1261, pp. 1–14, Nov. 2019, doi: ods in electromagnetics applied to antennas and
10.3390/electronics8111261. microwave components, radio propagation, and
[29] J. D. Parsons, ‘‘Wideband channel characterization,’’ in The Mobile Radio
mobile communications.
Propagation Channel, 2nd ed. Hoboken, NJ, USA: Wiley, 2000, ch. 6,
pp. 164–189.
[30] R. Steele and L. Hanzo, ‘‘Mobile radio channels,’’ in Mobile Radio
Communications, 2nd ed. Chichester, U.K.: Wiley, 1999, ch. 2, pp. 91–118.
JOSÉ BASTERRECHEA (Member, IEEE)
JESÚS R. PÉREZ received the B.Sc., M.Sc., and received the M.Sc. and Ph.D. degrees in
Ph.D. degrees in telecommunications engineer- physics (electronics) from the Universidad de
ing from the Universidad de Cantabria, Spain, Cantabria, in 1987 and 1992, respectively.
in 1996, 1999, and 2005, respectively. He joined He joined the former Department of Electronics,
the Department of Communications Engineering, Universidad de Cantabria, in 1987, and he was a
Universidad de Cantabria, in 1999, and he was National Graduate Research Fellow, from 1988 to
awarded a graduate research and a postdoctoral 1991. He became an Assistant Professor with
grant, in 2002 and 2006, respectively. He became the Department of Communications Engineering,
an Associate Professor, in 2009. His research in 1992, and he earned an Associate Professor
interests include computational electromagnetics, position, in 1995. His research interests include numerical methods,
optimization methods, antenna measurement techniques, radio propagation, electromagnetic compatibility, antenna measurement techniques, and
and measurement techniques for the experimental characterization of the optimization and synthesis methods.
radio channel.
107034 VOLUME 8, 2020You can also read