Few-Layer Graphene from Mechanical Exfoliation of Graphite-Based Materials: Structure-Dependent Characteristics - MDPI
←
→
Page content transcription
If your browser does not render page correctly, please read the page content below
chemengineering

Article
Few-Layer Graphene from Mechanical Exfoliation of
Graphite-Based Materials:
Structure-Dependent Characteristics
Azhar A. Pirzado 1,2 , François Le Normand 2 , Thierry Romero 1 , Sandra Paszkiewicz 3 ,
Vasiliki Papaefthimiou 1 , Dris Ihiawakrim 4 and Izabela Janowska 1, *
 1   Institut de Chimie et Procédés pour l’Énergie, l’Environnement et la Santé (ICPEES), CNRS UMR
     7515-University of Strasbourg, 25 rue Becquerel, 67087 Strasbourg, France; pirzado@etu.unistra.fr (A.A.P.);
     thierry.romero@unistra.fr (T.R.); papaefthymiou@unistra.fr (V.P.)
 2   Laboratoire des sciences de l0 Ingénieur, de l0 Informatique et de l0 Imagerie (ICube), UMR 7357, CNRS –
     University of Strasbourg, 67400 Strasbourg, France; francois.le-normand@unistra.fr
 3   West Pomeranian University of Technology, Institute of Material Science and Engineering Piastow Av. 19,
     70310 Szczecin, Poland; spaszkiewicz@zut.edu.pl
 4   Institut de Physique et Chimie des Matériaux de Strasbourg (IPCMS), CNRS UMR 7504-University of
     Strasbourg, France; drisihi@ipcms.unistra.fr
 *   Correspondence: janowskai@unistra.fr; Tel.: +33-(0)36-885-2633

 Received: 19 February 2019; Accepted: 1 April 2019; Published: 7 April 2019

 Abstract: We present a high-scale method to produce few-layer graphene (FLG) based on the
 mechanical exfoliation of graphite and compare the obtained FLG with the one reported earlier arising
 from pencil lead ablation. Several elements were modified and improved in the new approach. The
 purification and the ablation set-up were simplified, and the morphology of the FLG was modified and
 improved in view of some applications. The morphology-dependent properties of FLGs, lead-FLG,
 and graphite-FLG as conductive layers and in nanocomposites were investigated. The newly obtained
 FLG had a higher aspect ratio (high lateral size vs thickness/higher 2D aspect), which is reflected by
 enhanced transparency–conductivity features of the layer (film) and elongation-at-break behavior
 of the polymer composites. On the contrary, the nanocomposite containing lead-FLG showed, for
 instance, excellent gas barrier properties due to the multi-step structure of the lead-FLG flakes. Such
 structure exhibited less 2D and more 3D character, which can be highly suitable for applications where
 the presence of active/reactive edges is beneficial, e.g., in catalysis or supercapacitors’ electrodes.
 Nuclear reaction analysis was employed to investigate the morphology of graphite-FLG film.

 Keywords: few-layer graphene; mechanical exfoliation; graphene nanocomposites; conductive layer;
 nuclear reaction analysis

1. Introduction
      A significant number of methods have been developed for the production of graphene and/or
few-layer graphene (FLG), since graphene was mechanically isolated from graphite by a scotch tape
for the first time in 2004 [1]. The ideal method should fit the envisaged applications in terms of cost,
efficiency, and scalability, but also the morphological properties of the obtained FLG product. High
expectations from the industry concerning the applications of graphene and graphene-based materials
also induce a permanent search for efficient methods that additionally could answer the sustainable
development requirements. Bottom-up methods such as catalytic chemical vapor deposition (CVD)
or epitaxial growth over SiC produce high-quality graphene films dedicated to more sophisticated
needs in electronics, optoelectronics, spintronics, and related fields [2,3], while their limited yields

ChemEngineering 2019, 3, 37; doi:10.3390/chemengineering3020037          www.mdpi.com/journal/chemengineering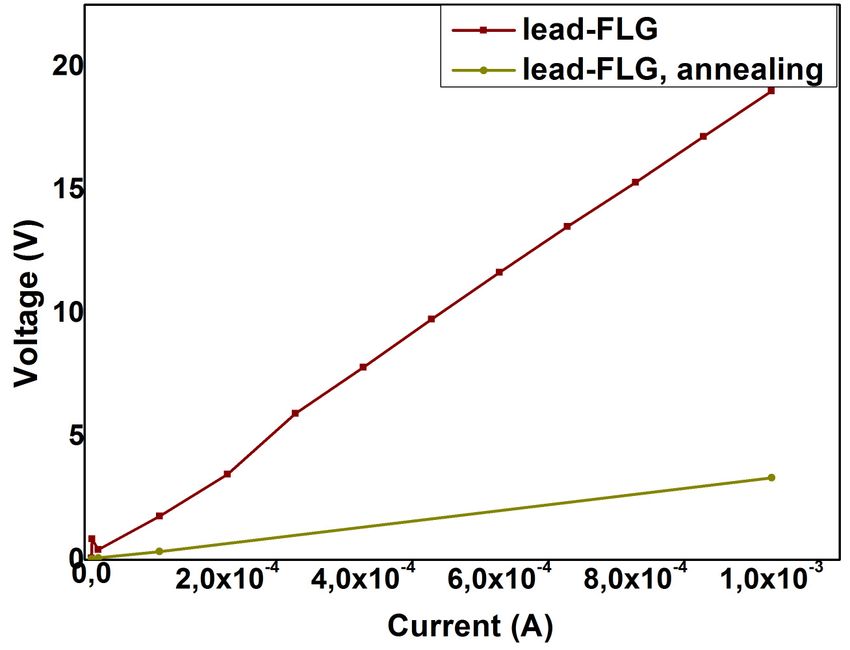
ChemEngineering 2019, 3, 37                                                                        2 of 10

and scalability exclude them from many other applications. The fields that require high-yield
“bulk graphene”/FLG powder/platelets are, for instance, high-performance composites, conductive
inks, coatings, and catalysis. They focus on top-down approaches dealing with the exfoliation of
graphite-based materials where the van der Waals forces between sheets in the graphite need to be
defeated. The most common top-down method is the ultrasonication-assisted exfoliation in liquids,
either in an organic solvent with the appropriate surface tension [4] or in aqua solution in the presence
of surfactant. Additionally, a large number of works reporting the production of reduced graphene
oxide focus mostly on the restoration of the continuous conjugated –C=C– lattice lost during the highly
oxidative exfoliation of graphite into graphite oxide [5]. The recent prominent exfoliation in water
instead involves the use of bio-surfactants [6,7], where high exfoliation yield and highly concentrated
colloids can be reached [7]. Apart from exfoliation improvement by chemistry, the mechanically
applied shear forces and the way they are applied play a significant role, impacting the efficiency and
structure of the resulting FLG. A significant progress in FLG production was observed, for instance,
when a kitchen blender [8], microfluidization [9], or mixing-assisted ultrasonication were applied [7].
     The scarce top-down methods concern the mechanical exfoliation of graphite, including the scotch
tape approach, and usually either proceed with low yield or lead to FLG with a highly disturbed
morphology, as is the case for ball-milled graphite [1,10,11]. One of the highest yield methods reported
by us a few years ago is the mechanical ablation of a pencil lead on a rough glass surface [12]. The
ablation was assisted by the simultaneous ultrasonication of the glass surface in ethanol (water) aiming
at the detachment of the ablated (exfoliated) products.
     Herein, we show several beneficial modifications of this mechanical ablation method that were
conducted by replacing the pencil lead by graphite discs with an adaptation of the processing
and set-up.

2. Materials and Methods
     Lead-FLG was obtained according to the work reported previously [12].
     Graphite-FLG was obtained through the mechanical ablation of a pure graphite disc (provided
by Nanocyl) on a rough glass surface. The set-up consisted of a modified polishing-like apparatus,
in which the horizontal glass disc, as the ablation substrate, turned with a controlled speed, while
the graphite disc hung loosely over the glass surface, kept by a suction cup system from the top. A
stream of ethanol was systematically used to remove the material ablated and attached to the glass
surface. Next, the product of the ethanol suspension was submitted to a sedimentation process for 4 h.
The supernatant containing FLG was then separated with an overall yield of around 60% and dried
under vacuum evaporation. Eventually, a final drying in a standard oven at 100 ◦ C for 2 h was applied.
     FLG layers/films were prepared from ethanol suspensions with concentrations of 0.5 mg/mL
that were sprayed on preheated and continuously heated quartz plates at 120 ◦ C with Airgun (Hi-line
Iwata). Air was used as a carrier gas with gun inlet pressure of 1.5 bars.
     Thermal annealing of the films was performed at 900 ◦ C for 2 h under Ar flow.
     Transmission electron microscopy (TEM) was carried out on a Topcon 002B-UHR microscope
working with an accelerated voltage of 200 kV and a point-to-point resolution of 0.17 nm. The sample
was dispersed in ethanol, and a drop of the suspension was deposited onto a carbon-coated copper
grid for analysis. In the case of composites, a slice of composite was cut prior to analysis.
     Scanning electron microscopy (SEM) analysis was carried out on a JEOL 6700-FEG microscope.
     Thermogravimetric analyses (TGA) were carried out on a TA instrument SDT Q600 under air; the
rate of heating was fixed at 5◦ /min.
     Raman spectroscopy was performed using a Horiba Scientific Labram Aramis Raman
Spectrometer (Jobin Yvon technology) with the following conditions: laser wavelength of 532.15 nm,
D2 filter (1% power) and spectrum in regions from 1250 to 1650 cm−1 and from 2600 to 2800 cm−1 ,
with integration time of 100 s for each phase.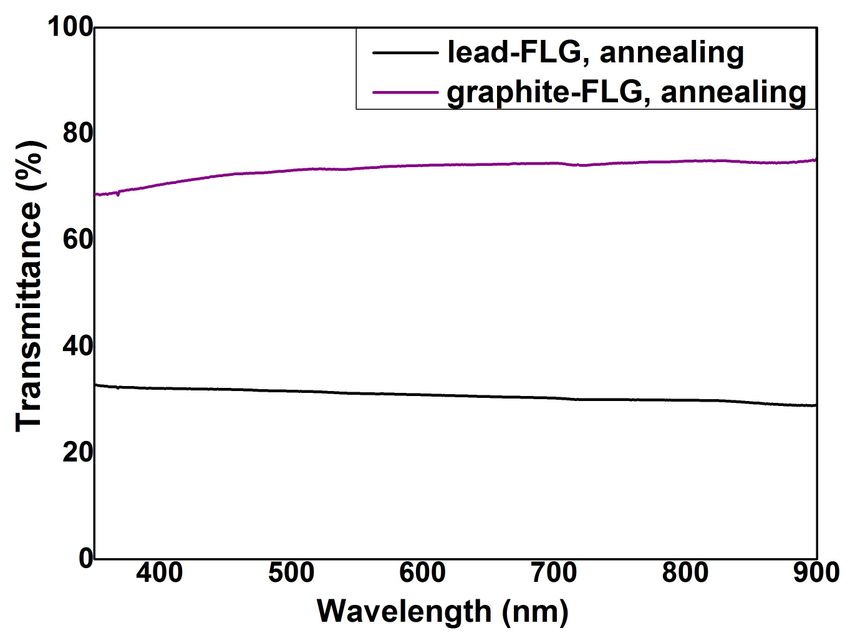
ChemEngineering 2019, 3, 37                                                                         3 of 10

      The X-ray Photoelectron Spectroscopy (XPS) measurements were performed in an ultrahigh
vacuum (UHV) setup equipped with a VSW ClassWA hemispherical electron analyzer with a
multi-channeltron detector. A monochromated AlKα X-ray source (1486.6 eV; anode operating at
240 W) was used as incident radiation. The base chamber pressure was 1 × 10⁻⁹ mbar. High-resolution
spectra were recorded in constant-pass-energy mode (100 and 20 eV, respectively). Prior to individual
elemental scans, a survey scan was taken for all the samples, to detect all of the present elements.
      Ultraviolet Photoelectron spectroscopy (UPS) measurements. During the work function
measurements by UPS (hν = 21.2 eV), a bias of 15.31 V was applied to the samples in order to
avoid interference of the spectrometer threshold in the UP spectra. The work function of the surface
was determined from the UP spectra by subtracting their width (i.e., the energy difference between the
Fermi level and the high binding energy cutoff) from the He I excitation energy (21.2 eV).
      Transmission spectra (UV–Vis) were obtained on a VARIAN Cary 100 Scan UV–Visible
spectrometer which had a deuterium arc and tungsten halogen lamps.
      The thickness of the graphite–FLG was measured by a Veeco DEKTAK 150 profilometer.
      Four-point probes (FPPs) measurements were performed in order to achieve sheet resistance (Rs )
of the lead–FLG and graphite–FLG films using Keithley 220 programmable current source coupled
with a Hewlett-Packard 34401A multimeter. For some films, a pair of electrodes (Au/Cr) was deposited.
It was, however, noticed by the systemically performed measurements that the electrodes were not
necessary to maintain good contact with the FLG films, and the measurable values were comparable
with those of electrode-free films.
      The average thickness of the films was measured by a Dektac a (and confirmed by atomic
force microscopy).
      Nuclear reaction analysis (NRA). The ion beam analysis was carried out on a 4MV Van De Graff
accelerator facility, using deuterium (2H) as an incident ion with energy of 900 keV and a scattering
angle of 150◦ . The conversion from channel (C) to energy (E) in keV (arbitrary number slots converted
to corresponding energy values, E = 7.04 × C − 85.00) was done by using the standard oxygen and
carbon nuclear reactions [O16 (d,p0 )O17 ], [O16 (d,p1 )O17 ] and [C12 (d,p)C13 ]. The bare SiO2 and SiC
samples were used for the calibration of the spectra. The spectra were calibrated by using SiO2
and SiC samples for oxygen and carbon, using the standard oxygen and carbon nuclear reactions
[O16 (d,p0 )O17 ], [O16 (d,p1 )O17 ] and [C12 (d,p)C13 ]. The spectra were fitted with the SIMRA software.

3. Results and Discussion

3.1. Ablation Process/FLG Structure
     For the present purpose, the discs of two kinds of graphite were used for the mechanical ablation:
highly oriented pyrolytic graphite (HOPG) and thermal pyrolytic graphite (TPG).
     According to the previous general procedure of mechanical exfoliation, the graphite disc is
ablated on a rough glass surface using an automatic set-up, while the ablated (exfoliated) product
is detached from the surface using a stream of solvent (ethanol or possibly water) [12]. The ablation
set-up is, however, modified compared to the one used for pencil lead (see Methods). Figure 1 is a
draft representing the ablations of both pencil lead and graphite disc. The presence of an inorganic
binder, such as kaolin in pencil lead, was not the only difference between the lead and graphite disc. It
was that the final products, FLG flakes, varied in terms of morphology, more precisely, by the size and
flakes’ edges. The FLG flakes from the exfoliation of lead often demonstrated a “multi-step” structure
(Figures 1a and 2a), which was previously confirmed by TEM and through the stabilization of metal
nanoparticles (NPs) [13] also in the self-assembling process where “3D-like particle” behavior was
observed [14]. A multi-step structure was also present in the edges but was observed less frequently in
the case of FLG originating from the graphite discs. We ascribe this difference to a different arrangement
of the initial graphite species in the lead versus the graphite disc. The surface of ablation was parallel
to the macroscopic surface of the graphitic disc but usually not parallel to the graphitic moieties in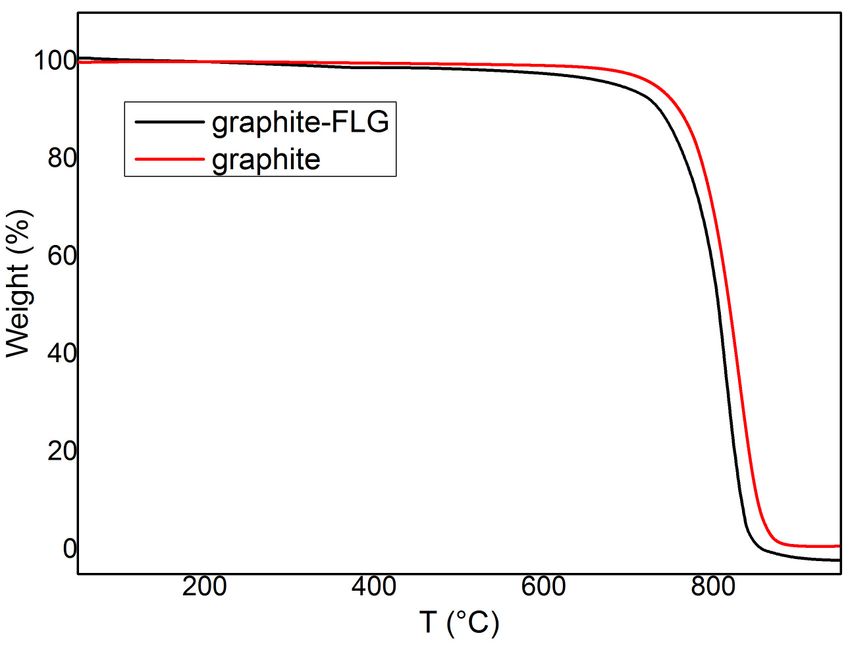
ChemEngineering 2019, 3, 37                                                                                        4 of 10

the lead. In the latter, the graphitic species were relatively smaller and randomly arranged under a
different angle,2019,
 ChemEngineering as they    were
                      3, x FOR   spaced
                               PEER      by the inorganic binder.
                                    REVIEW                                                     4 of 10

                              a                                    b

                                       PENCIL LEAD

                                                                       Graphite disc (HOPG)

                                    Multi-Step FLG

                                                                                 FLG

      Figure1.1.Draft
     Figure      Draftofofthethe ablation
                              ablation    process
                                       process overover a rough
                                                    a rough glass glass surface
                                                                  surface (a) of a(a) of alead
                                                                                   pencil  pencil
                                                                                               andlead  and
                                                                                                   (b) of    (b) of a
                                                                                                          a graphite
      graphite
     disc;       disc;
           related     related graphene
                   few-layer     few-layer(FLG)
                                            graphene   (FLG) morphologies
                                                 morphologies    (lead-FLG with(lead-FLG    with highly
                                                                                    highly multi-step     multi-step
                                                                                                       structure  vs
ChemEngineering
      structure2019,  3, x FOR PEER REVIEW
                 vs graphite-FLG).
     graphite-FLG).                                                                                                5 of 10

      aFigure 2 shows the related TEM micrographs of thebedges of FLGs exfoliated from both
 precursors, where, additionally,edges
                                     the number of layers can be counted. In a similar way to the pencil
       terraces the ablation of graphite was followed by a step of sedimentation, which aimed to
 lead ablation,
 separate the heavily exfoliated part of graphite. Likewise, the final supernatant (after a few hours of
 sedimentation) contained FLG flakes with a number of sheets rarely exceeding 10, while the settled-
                                                   steps
 down part was multi-layer graphene (MLG) with a number of sheets up to 40. Unlike FLG from a
 pencil lead, no purification treatment was required in the case of graphite-FLG, since no inorganic
 binder was present. The overall yield of graphite-FLG product reached around 60%–70%. The
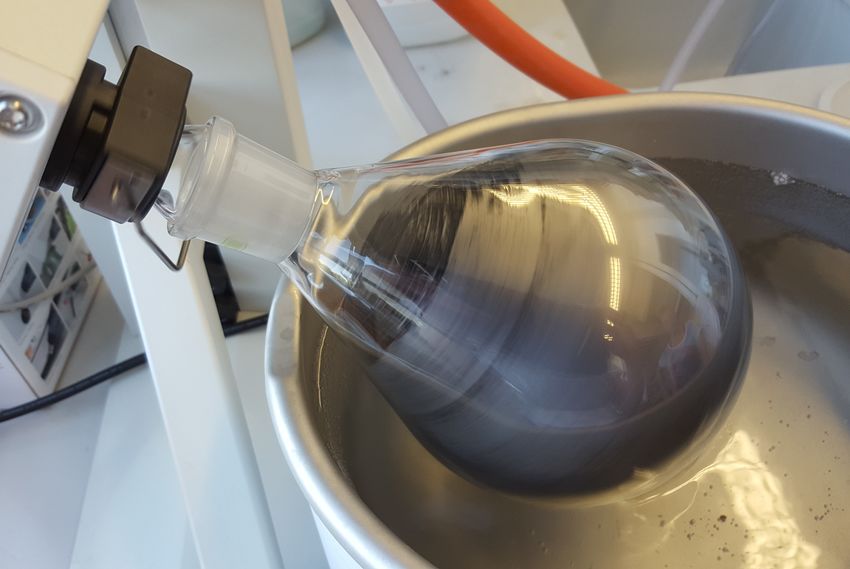
 solvent, in this case ethanol, could then be removed, for instance, by a standard rotary evaporator
 (Figure 3a), without inducing excessive stacking of the flakes. We find it important to highlight this
 simple5andnmfast step, since no literature reports such evaporation
                                                                   5 nm
                                                                     for graphene-based materials. This
 kind of evaporation would seem to favor the π–π stacking between the FLG sheets; however, it can
 be stopped
      c      before the solvent is totally removed leaving
                                                      d     a thin layer of solvent adsorbed on the FLG
 surface (due to the low pressure, the applied drying temperature can be highly decreased as well
 compared to standard drying). The remaining layer, in this case ethanol, helped the dispersion of
 FLG afterwards in polar solvents, as required for the introduction of FLG into polymers.

                                                5 nm

     Figure
     Figure 2.
             2. Transmission
                Transmission electron
                                electron microscopy
                                          microscopy (TEM)
                                                     (TEM) micrographs    of (a)
                                                             micrographs of  (a) aa thicker
                                                                                    thicker flake
                                                                                            flake of
                                                                                                  of lead-FLG
                                                                                                      lead-FLG with
                                                                                                               with
     multi-step
     multi-step structure,
                  structure, (b
                             (b and
                                 and c)
                                      c) variable
                                         variable number
                                                  number of sheets in graphite-FLG
                                                                       graphite-FLG from the supernatant
                                                                                                  supernatant and
     settled-down
     settled-down part, respectively, and (d) overall
                                                  overall view
                                                          view of
                                                               of the
                                                                  the assembly
                                                                      assembly ofof graphite-FLG
                                                                                     graphite-FLG flakes.
                                                                                                     flakes.

     The high purity of the graphite-FLG product was confirmed by XPS, Raman, and TGA analyses
(Figure 3 c–e). As it can be seen, the thin and relatively symmetric C1s peak at ca. 284.5 eV in the XPS
spectrum revealed a high content of sp2 carbon and a very low content of sp3 carbon and oxygen-
bonded C, whose signatures appeared at higher binding energy, above 285 up to ca. 290 eV. On the
contrary, a clear π–π* transition loss peak at 291 eV revealing easy electron delocalization could be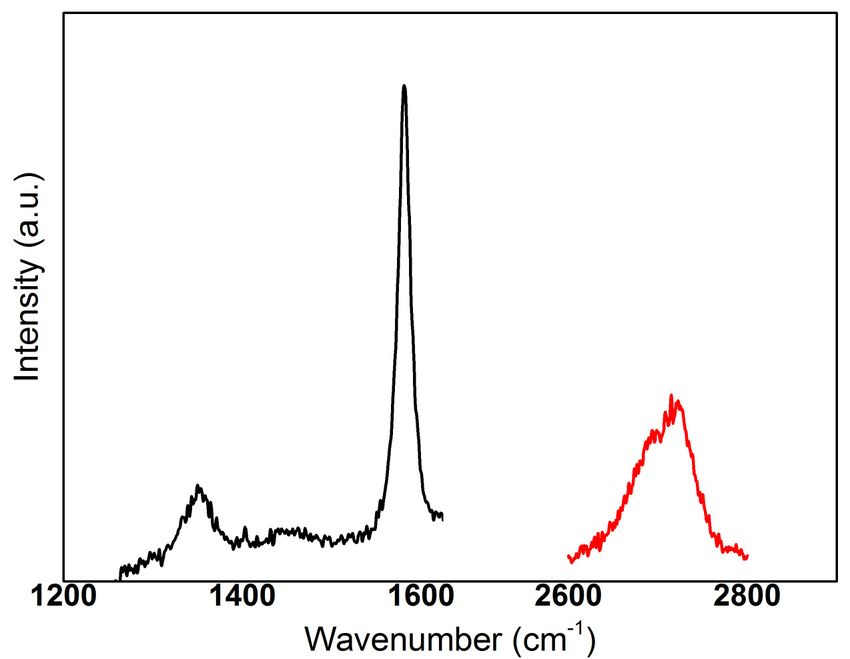
ChemEngineering 2019, 3, 37                                                                                          5 of 10

     Figure 2 shows the related TEM micrographs of the edges of FLGs exfoliated from both precursors,
where, additionally, the number of layers can be counted. In a similar way to the pencil lead ablation,
the ablation of graphite was followed by a step of sedimentation, which aimed to separate the heavily
exfoliated part of graphite. Likewise, the final supernatant (after a few hours of sedimentation)
contained FLG flakes with a number of sheets rarely exceeding 10, while the settled-down part was
multi-layer   graphene
  ChemEngineering            (MLG)
                  2019, 3, x FOR PEERwith
                                       REVIEWa number of sheets up to 40. Unlike FLG from a pencil                 lead,
                                                                                                             6 of 10
no purification treatment was required in the case of graphite-FLG, since no inorganic binder was
       Although
present. The overallthe two
                         yieldpolymers   (PTF, PTT)
                                 of graphite-FLG      are different
                                                    product          andaround
                                                               reached    the interactions
                                                                                 60%–70%.  between  them and
                                                                                             The solvent,       FLGcase
                                                                                                           in this
  may  vary,  the  signature    of FLG  morphology     in  the two  composites   was clear and suggested
ethanol, could then be removed, for instance, by a standard rotary evaporator (Figure 3a), without         a higher
  aspect ratio
inducing        (lateralstacking
           excessive       size vs thickness)  of FLG
                                    of the flakes.  We originating    from pure
                                                         find it important        graphite.this
                                                                             to highlight    Thesimple
                                                                                                 significant
                                                                                                         and aspect
                                                                                                              fast step,
  ratio should indeed provide a higher elongation at break and possibly create some preferential 2D
since no literature reports such evaporation for graphene-based materials. This kind of evaporation
  paths of percolation in the graphite-FLG composite. Locally, the PTT was less charged with FLG,
would seem to favor the π–π stacking between the FLG sheets; however,                   it can be stopped before the
  which permitted, however, gas passing (nanocomposite films of 5 cm2 were subjected to permeability
solvent is totally removed leaving a thin layer of solvent adsorbed on the FLG surface (due to the
  measurements). On the contrary, the lower size and edges-rich lead-FLG was highly and more
low pressure, the applied drying temperature can be highly decreased as well compared to standard
  homogenously distributed in the nanocomposite, and its multi-step structures with inequivalent
drying).  The remaining layer, in this case ethanol, helped the dispersion of FLG afterwards in polar
  edges (and so inequivalent graphitic planes) helped to inhibit the permeability of gases at higher
solvents, as required
  overall volume           for the
                     (surface   andintroduction    of FLG
                                     thickness), similar   tointo polymers.barrier.
                                                              a cascade-like

     a                                                                     b

                                                                           10 nm

     c                        d                                     e

         C1s                                 G

                                                     2D
                                  D

        Figure3.3. (a)
      Figure        (a) Removal
                         Removal of the solvent
                                           solvent from
                                                     from the
                                                            the FLG
                                                                 FLGsuspension
                                                                       suspensionbybyrotary
                                                                                        rotaryevaporation,
                                                                                                evaporation,(b)(b)
                                                                                                                TEMTEM
        micrograph
      micrograph        of graphite-FLG
                    of graphite-FLG         embedded
                                       embedded     into ainto  a polymer
                                                           polymer           (PTF) showing
                                                                     (PTF) showing   different different
                                                                                               number ofnumber     of
                                                                                                         edges/sheets
      inedges/sheets
         particular FLG in particular FLG
                            flakes (3–9    flakes (c)
                                        sheets),  (3–9C1s
                                                        sheets), (c) C1s XPSofspectrum
                                                            XPS spectrum                of graphite-FLG,
                                                                               graphite-FLG,   (d) Raman(d)   Raman of
                                                                                                           spectrum
        spectrum   of  graphite-FLG,   and  (e) TGA   curves  of graphite
      graphite-FLG, and (e) TGA curves of graphite and graphite-FLG.      and  graphite-FLG.

  3.3.The
       FLGhigh
           Conductive
               purity Layer/Film/Electrode
                        of the graphite-FLG product was confirmed by XPS, Raman, and TGA analyses
(FigureThe
         3 c–e).
            higherAs  it can
                   lateral sizebeofseen,  the thin andflakes
                                    the graphite-FLG     relatively symmetric
                                                             and structure     C1s peakcould
                                                                           homogeneity    at ca.  284.5 eV in
                                                                                               be observed
the  XPS  spectrum   revealed    a high  content  of sp 2 carbon and a very low content of sp3 carbon and
  by SEM (Figure 4 a,b) and also by investigation of the transparency–conductivity trade-off in FLG
oxygen-bonded     C, whose
  films (Figure 4d–f)    [18]. signatures   appeared atwere
                                The FLG films/layers      higher  binding
                                                                formed  byenergy, above
                                                                           deposition of 285 upFLGs
                                                                                          both   to ca.over
                                                                                                        290 eV.
  transparent substrates via the hot-spray technique, followed by annealing treatment in Ar. The
  annealing process allowed the removal of ethanol and other possible impurities adsorbed on the FLG
  flakes’ surface, which resulted in a decrease of the resistance. Both FLGs were deposited in minimum,
  but high enough, quantity to obtain a conductive layer. The layer formed from graphite-FLG showed
  a transparency up to 74% for a same range of conductivity (Rs ≈ 21 kΩ/sq) compared to FLG from the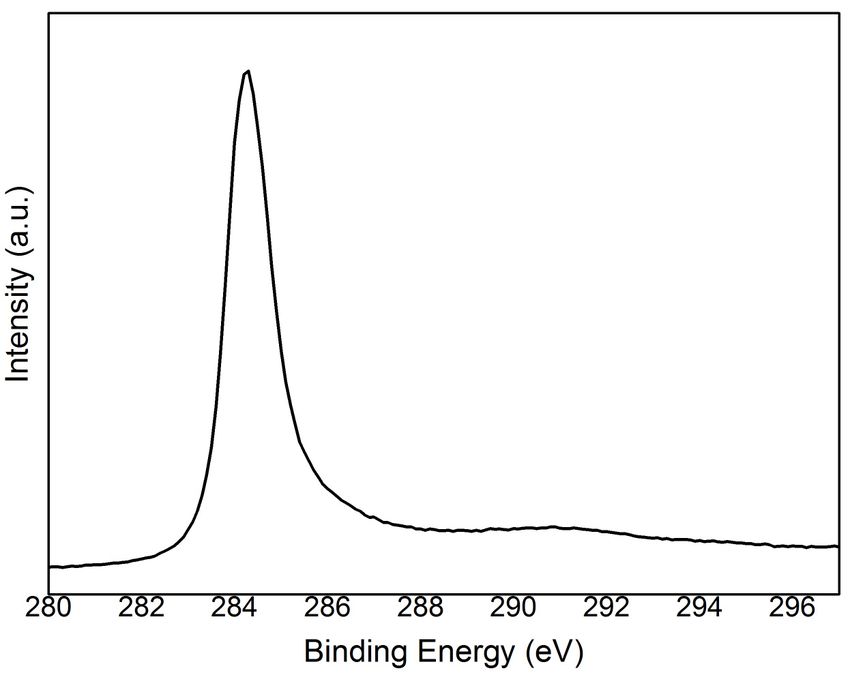
ChemEngineering 2019, 3, 37                                                                          6 of 10

On the contrary, a clear π–π* transition loss peak at 291 eV revealing easy electron delocalization could
be observed [15]. The low ratio of relative D and G peaks’ intensity ID /IG = 0.13 in Raman spectra
confirmed a very high content of undisturbed conjugated cyclic carbon. The shape of the 2D peak in
selected flakes at c.a. 2700 cm−1 suggests few, but no more than five, layers in the analyzed flake (the
intensity of the broad part of the peak at lower wavelength is significant) [16]. Likewise, graphite-FLG
oxidized at a relatively high temperature (under air), around 700 ◦ C, while, as expected, it started to be
oxidized 30–40 ◦ C earlier than graphite before the ablation.

3.2. FLG in Nanocomposites
     The rotary-assisted-evaporated graphite-FLG was used next as an additive filler with 0.1 and
0.3 wt % in poly(trimethylene 2,5-furanoate) (PTF), where very high dispersion of FLG was observed
after nanocomposite formation using an in situ polymerization process. The polymerization was
preceded by dispersing the FLG in the monomer [17]. It was found that the addition of 0.3% of FLG
(PTF–FLG) did not increase the electrical conductivity. It slightly decreased oxygen transmission, while
thermal conductivity and elongation at break were significantly improved.
     For a nanocomposite based on poly(trimethylene tetraphtalate) containing FLG from ablation of
lead (PTT–FLG), different effects were observed. Here, for the same FLG content (0.3%), the elongation
at break was strongly decreased (εb [%] is 2.28 vs. 178.32 for pure PTT), while, on the contrary, the
permeability behavior was excellent, and the O2 and CO2 transmission of PTT–FLG dropped to
negligible values, from 74.3 to 2.3 and from 649.6 to 36.7 cm3 /m2 × 24h, respectively.
     Although the two polymers (PTF, PTT) are different and the interactions between them and FLG
may vary, the signature of FLG morphology in the two composites was clear and suggested a higher
aspect ratio (lateral size vs thickness) of FLG originating from pure graphite. The significant aspect
ratio should indeed provide a higher elongation at break and possibly create some preferential 2D
paths of percolation in the graphite-FLG composite. Locally, the PTT was less charged with FLG,
which permitted, however, gas passing (nanocomposite films of 5 cm2 were subjected to permeability
measurements). On the contrary, the lower size and edges-rich lead-FLG was highly and more
homogenously distributed in the nanocomposite, and its multi-step structures with inequivalent edges
(and so inequivalent graphitic planes) helped to inhibit the permeability of gases at higher overall
volume (surface and thickness), similar to a cascade-like barrier.

3.3. FLG Conductive Layer/Film/Electrode
     The higher lateral size of the graphite-FLG flakes and structure homogeneity could be observed
by SEM (Figure 4a,b) and also by investigation of the transparency–conductivity trade-off in FLG films
(Figure 4d–f) [18]. The FLG films/layers were formed by deposition of both FLGs over transparent
substrates via the hot-spray technique, followed by annealing treatment in Ar. The annealing process
allowed the removal of ethanol and other possible impurities adsorbed on the FLG flakes’ surface,
which resulted in a decrease of the resistance. Both FLGs were deposited in minimum, but high
enough, quantity to obtain a conductive layer. The layer formed from graphite-FLG showed a
transparency up to 74% for a same range of conductivity (Rs ≈ 21 kΩ/sq) compared to FLG from the
lead (Rs ≈ 15 kΩ/sq), whose transparency did not exceed 35%. It is worthy to note that conductivity
measurements were done by the FPPs method. The Hall Effect method measurements performed
previously (under N2 ) for lead-FLG showed lower Rs by one order of magnitude, 1 kΩ/sq [19]. These
results show that the charge transport properties were more hindered in the case of lead-FLG compared
to graphite-FLG: this was due firstly to the lower aspect ratio and, secondly, to the multi-step structure
of the former. The conductivity of the films were calculated to be σ = 3.7 S/cm and 5.1 S/cm for
graphite-FLG and lead-FLG, respectively, while, considering the transparency–conductivity figure
of merit, the calculated “conductivity of transparency” values were σgt = 61 S/cm and 41 S/cm for
graphite-FLG and lead-FLG, respectively [18].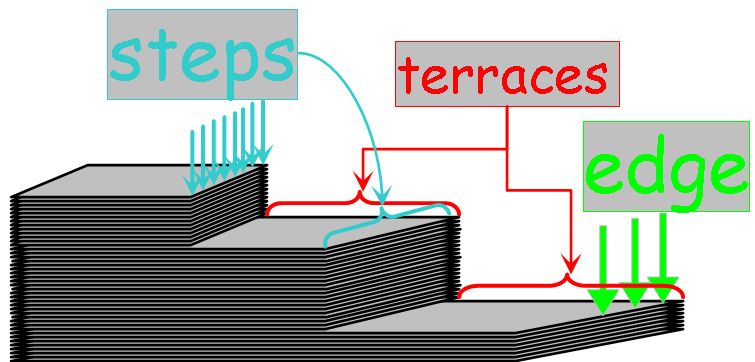
previously (under N2) for lead-FLG showed lower Rs by one order of magnitude, 1 kΩ/sq [19]. These
results show that the charge transport properties were more hindered in the case of lead-FLG
compared to graphite-FLG: this was due firstly to the lower aspect ratio and, secondly, to the multi-
step structure of the former. The conductivity of the films were calculated to be σ = 3.7 S/cm and 5.1
S/cm for graphite-FLG and lead-FLG, respectively, while, considering the transparency–conductivity
ChemEngineering 2019, 3, 37 7 of 10
figure of merit, the calculated “conductivity of transparency” values were σgt = 61 S/cm and 41 S/cm
for graphite-FLG and lead-FLG, respectively [18].
a b c
2�
m 4�
m 1�
m
d e f
110 kΩ
85 kΩ 21 kΩ
73.5%
31%
15 kΩ
Figure4.4. (a–c)
Figure (a–c) Scanning electronmicroscopy
Scanning electron microscopy(SEM)
(SEM)micrographs
micrographs of of sprayed
sprayed layers:
layers: (a) Lead-FLG,
(a) Lead-FLG,
(b,c)
(b,c) graphite-FLG; (d,e) I–V curves obtained by the four-point probes (FPPs) method for lead-for
graphite-FLG; (d,e) I–V curves obtained by the four-point probes (FPPs) method andlead-
and graphite-FLG
graphite-FLG layerslayers (without
(without andannealing),
and after after annealing), respectively,
respectively, and (f) transmittance
and (f) transmittance curves
curves of lead-
ofand
lead- and graphite-FLG
graphite-FLG layers, forlayers, for comparable
comparable conductivities
conductivities of the filmsof(Rsthe films (Rsand
= 15kΩ/sq = 15kΩ/sq
21 kΩ/sq, and
21 kΩ/sq, respectively).
respectively).
The
Thehigher
higher aspect ratio and,
aspect ratio and,more
moreprecisely,
precisely,the thehigh
highlateral
lateral size
size of of graphite-FLG
graphite-FLG flakes
flakes allowed
allowed
percolation
percolation and transport through the macroscopic surface (in 2D) at lower surface coverage. ThisThis
and transport through the macroscopic surface (in 2D) at lower surface coverage.
entailed
entailedthethehigher
higher overall transparency.
overall transparency.
In
Inorder
orderto to get
get more
more information
information aboutaboutthe themorphology
morphology ofofthethe graphite-FLG
graphite-FLG layer
layer prepared
prepared by by
hotspray,
hot spray,thethethickness
thickness of thethe film
filmwas
wasmeasured
measuredbybyprofilometry,
profilometry, andandthethe
volume
volume density
density (carbon)
(carbon)
wasdetermined
was determined
ChemEngineering afterwards
2019, 3, xafterwards by
by Nuclear
FOR PEER REVIEW NuclearReaction
ReactionAnalysis
Analysis (NRA).
(NRA). WeWe find it interesting
find it interestingto highlight
to8highlight
of 10
atatthis
thispoint
pointthe
the use
use of
of NRA,
NRA, since
since NRA
NRAisisrarely
rarelyapplied
appliedforfor analysis
analysis of of
such
suchrelatively
relativelythick films
thick films
prepared
The
prepared byhigh-scale
obtained
by high-scale methodsofsuch
volume density
methods the as
such FLG
as film, ρFigure
spraying.
spraying. was 5a
f,Figure much displays
5a lowerthe
displays NRA
than
the the
NRA spectra
volume obtained
spectra density
obtained forofafor a
conductive
graphite
conductive graphite-FLG
(∼ 2.25 graphite-FLG
g/cm film that
3), indicating
film with 12CC(d,
12
withmore p)p)
than
(d, signal
1313
half of at
signal ca.
theat 2735
volume
ca. 2735keV [20].
ofkeV
the FLG film was void (∼ 57%).
[20].
Because of the resolution of NRA analysis (up to a few µm), the depth profile included the FLG
film and SiO2 substrate displaying two oxygen peaks for 7the two reactions. It was calculated from
7500 a 13density10
SIMRA software that the cross-sectional C surface
12
(d,p)C
(A)b contained 6.25 × 10¹⁷ atoms/cm lead-FLG (4.0,eV)
2 while
TPG (4.6 eV)
the average thickness of the film (Tf) was 130 nm according 10 to the profilometer measurements.
6
HOPG (4.5 eV) On
6000
the basis of these two values, the volume density of the FLG Cutoff film (ρf) could be calculated according
Intensity (a.u.)
Counts (a.u.)
5
to Equation 1: 10 Fermi energy
4500 edge
ρf = A16× M/(NA17× Tf )= 6.25 × 1017 × 12/ (130 × 10
104−7 × 6.023 × 1023) = 0.96 g/cm3 (1)
O (d,p1)O
3000
where NA is the Avogadro number (6.023 × 10²³ atoms/mol),
10 and M is the molecular weight of carbon
3
(12 g/mol).
1500 16 17
O (d,p0)O 10
2
0 1
10
500 1000 1500 2000 2500 3000 3500 -20 -15 -10 -5 0
Energy (keV) Binding Energy (eV)
Figure 5. (a)5.Nuclear
Figure Reaction
(a) Nuclear Analysis
Reaction (NRA)
Analysis spectra
(NRA) obtained
spectra for the
obtained forgraphite-FLG film (electrode)
the graphite-FLG film (electrode)
withwith
carbon 12
carbon 12
C at 2770 keV and
C at 2770 keV (b)
andUPS workwork
(b) UPS functions of lead-
functions and graphite-FLG
of lead- samples.
and graphite-FLG samples.
Because
Despite of the resolution
a significant amount of NRA
voids,analysis
the FLG(up to was
film a few µm), the depth
conductive, profile
meaning included
that the FLG
the amount
and film and SiO2 of
arrangement substrate
the FLG displaying twosufficient
flakes were oxygen peaks
to formforconductive
the two reactions. It was
paths. On the calculated
other hand,from
regarding the average thickness of the film and amount of voids, it is important to note that the
overall transparency of the film was also due to the voids and not only to the low thickness of the
FLG flakes themselves. The transmittance values obtained by UV–Vis spectroscopy were measured
for micrometric spots that covered a relatively high surface, including the FLG flakes and the voids.
The low homogeneity and still relatively low transparency of such prepared FLG film make itChemEngineering 2019, 3, 37 8 of 10
SIMRA software that the cross-sectional surface density (A) contained 6.25 × 10¹⁷ atoms/cm2 , while
the average thickness of the film (Tf ) was 130 nm according to the profilometer measurements. On
the basis of these two values, the volume density of the FLG film (ρf ) could be calculated according to
Equation (1):
ρf = A × M/(NA × Tf ) = 6.25 × 1017 × 12/(130 × 10−7 × 6.023 × 1023 ) = 0.96 g/cm3 (1)
where NA is the Avogadro number (6.023 × 10²³ atoms/mol), and M is the molecular weight of carbon
(12 g/mol).
The obtained volume density of the FLG film, ρf , was much lower than the volume density of
graphite (~2.25 g/cm3 ), indicating that more than half of the volume of the FLG film was void (~57%).
Despite a significant amount of voids, the FLG film was conductive, meaning that the amount
and arrangement of the FLG flakes were sufficient to form conductive paths. On the other hand,
regarding the average thickness of the film and amount of voids, it is important to note that the
overall transparency of the film was also due to the voids and not only to the low thickness of the
FLG flakes themselves. The transmittance values obtained by UV–Vis spectroscopy were measured for
micrometric spots that covered a relatively high surface, including the FLG flakes and the voids. The
low homogeneity and still relatively low transparency of such prepared FLG film make it insufficient
for applications like transparent conductive films/electrodes (TCFs). However, conductive layers/film
with other useful properties such as hydrophobicity, anti-static properties, thermal conductivity, etc.
can be easily obtained. Yet, further optimization of the FLG-graphite structure by additional separation
methods and appropriate deposition would lead to better transparency–conductivity–homogeneity
characteristics of the films. Meanwhile, in view of the potential application of mechanically ablated
FLGs as electrodes/conductive layers, work functions (Φ) measurements were additionally performed
by the UPS method. The Φ values were determined by subtracting the difference between the
UPS secondary cutoff (cutoff) and Fermi edges Ef . The obtained Φ for lead-FLG, 4.0 ± 0.1 eV,
was much lower than the Φ of graphite/graphene, ~ 4.6 eV [21], which could be related to the
purification step and the structure itself. The Φ of TPG-FLG and HOPG-FLG, 4.6 ± 0.1 and
4.5 ± 0.1 eV, respectively, corresponded to Φ of graphite/graphene and were almost equivalent to Φ
of ITO (4.7 eV), showing that this FLG could be envisaged for applications in optoelectronics if, of
course, the conductivity/transparency trade-off is resolved. On the contrary, the FLG-lead will be
more appropriate as an electrode with a low Φ, for instance as a solution-processable material that
can replace metal-based counter electrodes (cathodes) in organic photovoltaic (OPV) cells (Ag, Al
electrode: 4.0–4.3 eV). The metal electrodes are in general deposited by costly evaporation methods
such as sputtering.
4. Conclusions
The significant modifications of morphology and some related properties of FLG obtained by
the mechanical ablation (exfoliation) of graphite were compared to those of FLG obtained previously
by ablation of pencil lead. The new approach is a high-yield and simple method with a simplified
set-up and absence of additional purification steps. The new product (graphite-FLG) consists of flakes
of few/several sheets with much higher aspect ratio and more homogenous structure compared
to lead-FLG. Because of the different arrangement and purity of graphitic entities in the initial
materials, larger FLG flakes with homogenous size of sheets and equivalent edges were obtained, while
multi-step-structure FLG flakes from pencil lead were often observed. The two different structures
of graphite-FLG and lead-FLG reflect different signatures in nanocomposites (in polymers) and
in conductive layers. The enhanced conductivity–transparency properties of film and increased
elongation at break in nanocomposites of graphite-FLG compared to lead-FLG were measured. In turn,
the increased number of effective edges in the multi-step FLG flakes (lead-FLG) is advantageous for
the reduction of gases permeability in nanocomposites but also, e.g., for the enhancement of dispersionChemEngineering 2019, 3, 37 9 of 10
and stabilization of metal nanoparticles for catalytic applications. NRA analysis of the graphite-FLG
films was used to get inside cross-sectional density and porosity of the film, and UPS analysis was
used to check the work function values for both graphite- and lead-FLG. The work function also varied
for both types of FLG, placing them in different potential electrode applications. Concerning the lower
aspect ratio and multi-step structure of lead-FLG flakes, they exhibited less 2D and more 3D character,
which can be highly suitable for applications where the presence of active/reactive edges is beneficial,
e.g., in catalysis [22] or supercapacitors’ electrodes [23].
Author Contributions: A.A.P.: preparation of FLG and FLG films, selected analysis, F.L.N.: NRA analysis and
related discussion, T.R.: SEM microscopy, modification of ablation set-up, S.P.: preparation and analysis of
nanocomposites, V.P.: UPS analysis, D.I.: TEM microscopy, I.J.: PI/coordinator of work, wrote the manuscript.
Funding: This research was funded by CONECTUS ALSACE (2010-2012).
Acknowledgments: The Conectus Alsace is acknowledged for the financial support. Cuong Pham-Huu is
acknowledged for help to get the Conectus support. Higher Education Commission, Pakistan, is acknowledged
for the financial support for A. A. Pirzado. Y. Le Gall and D. Muller (Icube/MaCEPV) are acknowledged for
NRA analyses.
Conflicts of Interest: On behalf of all authors, the corresponding author states that there is no conflict of interest.
References
1. Novoselov, K.S.; Geim, A.K.; Morozov, S.V.; Jiang, D.; Zhang, Y.; Dubonos, S.V.; Grigorieva, I.V.; Firsov, A.A.
Electric Field Effect in Atomically Thin Carbon Films. Science 2004, 306, 666–669. [CrossRef]
2. Zhang, Y.; Zhang, L.; Zhou, C. Review of Chemical Vapor Deposition of Graphene and Related Applications.
Acc. Chem. Res. 2013, 46, 2329–2339. [CrossRef] [PubMed]
3. Mishra, N.; Boeckl, J.; Motta, N.; Iacopi, F. Graphene growth on silicon carbide: A review. Phys. Status Solidi
2016, 2013, 2277–2289. [CrossRef]
4. Hernandez, Y.; Nicolosi, V.; Lotya, M.; Blighe, F.M.; Sun, Z.; De, S.; McGovern, I.T.; Holland, B.;
Byrne, M.; Gun’Ko, Y.K.; et al. High- yield production of graphene by liquid-phase exfoliation of graphite.
Nat. Nanotechnol. 2008, 3, 563–568. [CrossRef]
5. Rozada, R.; Paredes, J.I.; Villar-Rodil, S.; Martínez-Alonso, A.; Tascoń, J.M.D. Towards full repair of defects
in reduced graphene oxide films by two-step graphitization. Nano Res. 2013, 6, 216–233. [CrossRef]
6. Paredes, J.I.; Villar-Rodil, S. Biomolecule-assisted exfoliation and dispersion of graphene and other
two-dimensional materials: a review of recent progress and applications. Nanoscale 2016, 8, 15389–15413.
[CrossRef] [PubMed]
7. Ba, H.; Truong-Phuoc, L.; Pham-Huu, C.; Luo, W.; Baaziz, W.; Romero, T.; Janowska, I. Colloid Approach to
the Sustainable Top-Down Synthesis of Layered Materials. ACS Omega 2017, 2, 8610–8617. [CrossRef]
8. Yi, M.; Shen, Z. Kitchen blender for producing high-quality few-layer graphene. Carbon 2014, 78, 622–626.
[CrossRef]
9. Karagiannidis, P.G.; Hodge, S.A.; Lombardi, L.; Tomarchio, F.; Decorde, N.; Milana, S.; Goykhman, I.; Su, Y.;
Mesite, S.V.; Johnstone, D.N.; et al. Microfluidization of Graphite and Formulation of Graphene-Based
Conductive Inks. ACS Nano 2017, 11, 2742–2755. [CrossRef]
10. Zhu, H.; Cao, Y.; Zhang, J.; Zhang, W.; Xu, Y.; Guo, J.; Yang, W.; Liu, J. One-step preparation of graphene
nanosheets via ball milling of graphite and the application in lithium-ion batteries. J. Mater. Sci. 2016, 51,
3675–3683. [CrossRef]
11. Natarajan, C.; Fujimoto, H.; Mabuchi, A.; Tokumitsu, K.; Kasuh, T. Effect of mechanical milling of graphite
powder on lithium intercalation properties. J. Power Sources 2001, 92, 187–192. [CrossRef]
12. Janowska, I.; Vigneron, F.; Bégin, D.; Ersen, O.; Bernhardt, P.; Romero, T.; Ledoux, M.J.; Pham-Huu, C.
Mechanical thinning to make few-layer graphene from pencil lead. Carbon 2012, 50, 2679–3120. [CrossRef]
13. Moldovan, S.; Bulou, H.; Dappe, Y.J.; Janowska, I.; Bégin, D.; Pham-Huu, C.; Ersen, O. On the Evolution of Pt
Nanoparticles on Few-Layer Graphene Supports in the High-Temperature Range. J. Phys. Chem. C 2012, 116,
9274–9282. [CrossRef]ChemEngineering 2019, 3, 37 10 of 10
14. Janowska, I. Evaporation-induced self-assembling of few-layer graphene into a fractal-like conductive
macro-network with a reduction of percolation threshold. Phys. Chem. Chem. Phys. 2015, 17, 7634–7638.
[CrossRef]
15. Blyth, R.I.R.; Buqa, H.; Netzer, F.P.; Ramsey, M.G.; Besenhard, J.O.; Golob, P.; Winter, M. XPS studies of
graphite electrode materials for lithium ion batteries. Appl. Surf. Sci. 2000, 167, 99–106. [CrossRef]
16. Ferrari, A.C.; Meyer, J.C.; Scardaci, V.; Casiraghi, C.; Lazzeri, M.; Mauri, F.; Piscanec, S.; Jiang, D.;
Novoselov, K.S.; Roth, S.; et al. Raman Spectrum of Graphene and Graphene Layers. Phys. Rev. Lett.
2006, 97, 187401. [CrossRef] [PubMed]
17. Paszkiewicz, S.; Janowska, I.; Pawlikowska, D.; Szymczyk, A.; Irska, I.; Lisiecki, S.; Stanik, R.; Gude, M.;
Piesowicz, E. New functional nanocomposites based on poly(trimethylene 2,5-furanoate) and few layer
graphene prepared by in situ polymerization. Express Polym. Lett. 2018, 12, 530–542. [CrossRef]
18. Eigler, S. A new parameter based on graphene for characterizing transparent, conductive materials. Carbon
2009, 47, 2933–2939. [CrossRef]
19. Pirzado, A.A.; Jouane, Y.; Le Normand, F.; Akilimali, R.; Papaefthimiou, V.; Matei Ghimbeu, C.; Janowska, I.
Electrical Transport in “Few-Layer Graphene” Film Prepared by the Hot-Spray Technique: The Effect of
Thermal Treatment. J. Phys. Chem. C 2014, 118, 873–880. [CrossRef]
20. Gutierrez, G.; Le Normand, F.; Muller, D.; Aweke, F.; Speisser, C.; Antoni, F.; Le Gall, Y.; Lee, C.S.;
Cojocaru, C.S. Multi-layer graphene obtained by high temperature carbon implantation into nickel films.
Carbon 2014, 66, 1–10. [CrossRef]
21. Yu, Y.-J.; Zhao, Y.; Ryu, S.; Brus, L.E.; Kim, K.S.; Kim, P. Tuning the Graphene Work Function by Electric Field
Effect. Nano Lett. 2009, 9, 3430–3434. [CrossRef] [PubMed]
22. Tao, L.; Wang, Q.; Dou, S.; Ma, Z.; Huo, J.; Wang, S.; Dai, L. Edge-rich and dopant-free graphene as a highly
efficient metal-free electrocatalyst for the oxygen reduction reaction. Chem. Commun. 2016, 52, 2764–2767.
[CrossRef] [PubMed]
23. Kim, Y.J.; Yang, C.-M.; Park, K.C.; Kaneko, K.; Kim, Y.A.; Noguchi, M.; Fujino, T.; Oyama, S.; Endo, M.
Edge-Enriched, Porous Carbon-Based, High Energy Density Supercapacitors for Hybrid Electric Vehicles.
ChemSusChem 2012, 5, 535–541. [CrossRef] [PubMed]
© 2019 by the authors. Licensee MDPI, Basel, Switzerland. This article is an open access
article distributed under the terms and conditions of the Creative Commons Attribution
(CC BY) license (http://creativecommons.org/licenses/by/4.0/).You can also read


