INACTIVATING SARS-COV-2 USING 275NM UV-C LEDS THROUGH A SPHERICAL IRRADIATION BOX: DESIGN, CHARACTERIZATION AND VALIDATION - PREPRINTS.ORG
←
→
Page content transcription
If your browser does not render page correctly, please read the page content below
Preprints (www.preprints.org) | NOT PEER-REVIEWED | Posted: 25 February 2021 doi:10.20944/preprints202102.0588.v1

 Article

 Inactivating SARS-CoV-2 using 275nm UV-C LEDs through a
 spherical irradiation box: design, characterization and valida-
 tion
 Nicola Trivellin 1, Matteo Buffolo 2, Francesco Onelia 3, Alberto Pizzolato 4, Marco Barbato 4, Viviana Teresa
 Orlandi 5, Claudia Del Vecchio 3, Fabrizio Dughiero 1, Enrico Zanoni 2, Gaudenzio Meneghesso 2,
 Andrea Cristanti 3, Matteo Meneghini 2

 1Department of Industrial Engineering, University of Padova, Via Gradenigo 6A, 35131 Padova (PD) Italy
 2Department of Information Engineering, University of Padova, Via Gradenigo 6B, 35131 Padova (PD) Italy
 3Department of Molecular Medicine, University of Padova, Via Gabelli 63, 35121 Padova (PD) Italy

 4LightCube SRL, Viale Navigazione Interna 51, 35129, Padova (PD), Italy

 5DBSV, University of Insubria, Via J.H. Dunant 3, 21100 Varese (VA), Italy

 * Correspondence: nicola.trivellin@unipd.it

 Abstract: We report on the design, characterization and validation of a spherical irradiation system
 for inactivating SARS-CoV-2, based on UV-C 275 nm LEDs. The system is designed to maximize
 irradiation intensity and uniformity, and can be used for irradiating a volume of 18 liters. To this
 aim: (i) several commercially available LEDs have been acquired and analyzed; (ii) a complete
 optical study has been carried out in order to optimize the efficacy of the system. (iii) The resulting
 prototype has been characterized optically, and tested for the inactivation of SARS-CoV-2 for
 different exposure times, doses and surface types. Results indicate that a 99.9% inactivation can be
 reached after 1 minute of treatment with a dose of 83.1 J/m2.

 Keywords: SARS-CoV-2, Covid-19, LED, UVC, disinfection, inactivation, virucide.

 Introduction
 The spread of SARS-CoV-2 virus, the etiological agent of COVID-19, is stressing the
 global healthcare [1] and economical systems [2]. Although still discussed, the infection is
 thought to be mainly related to droplets and aerosol [3]. While personal devices like face
 masks are effective toward the spread of droplets [4] [5,6] contamination of surfaces [7],
 water and air must be prevented to minimize the spread of the virus. In most cases,
 decontamination is performed through chemical agents, like alcohol- or chlorine-based
 solutions. However, these disinfection strategies are time-consuming, and not suitable for
 large surfaces.
 For this reason, non-chemical and photoassisted strategies are currently being
 explored, mostly based on ultraviolet light. Several papers indicated that UV light can be
 effective towards the inactivation of different pathogenic microorganisms, including,
 recently,the SARS-CoV-2 [8] on surfaces. The ability of having a precise and reliable
 sanification can be achieved by UVC irradiation, thus helping the use of “community”
 objects like portable payment terminals, handrails, elevators, etc.
 UV-assisted disinfection is of particular importance in community environments,
 especially in presence of young generations: schools, gyms and sport fields are often kept
 open to relieve social tension, thus being places where the virus can easily spread. In
 addition, team sport activities are affected by the necessary use of “community” objects
 like sport balls, that are touched by all players, in presence of droplets, aerosol and body
 fluids. For this reason, providing frequently sanitized sport equipment (like sport
 basketballs) is crucial for the containment of the contagion and the continuation of the

 © 2021 by the author(s). Distributed under a Creative Commons CC BY license.
Preprints (www.preprints.org) | NOT PEER-REVIEWED | Posted: 25 February 2021 doi:10.20944/preprints202102.0588.v1

 2 of 14

 physical activities. Most personal objects used at school have dimensions of 100-200 mm,
 while sport-balls can have a diameter near 250 mm, so designing systems capable of
 inactivating the viruses in volumes around 15-18 liters is a necessity to control the virus
 in community life.
 Deep ultraviolet LEDs based on Aluminum Gallium Nitride (AlGaN) material have
 been available since approximately two decades [9], nevertheless their limited
 performances [10], reliability [11] and high cost per watt were playing a major role in
 limiting their market diffusion. Recently, the efficiency of these devices has rose up to
 levels of 1-3%, while a sensible reduction of cost made them suitable for different
 commercial applications. UVC LEDs are still less efficient than low pressure mercury
 lamp, but their compactness, low voltage operation and instant switch on compensate for
 these deficiencies.
 The goal of this paper is to present the design, optimization and validation of a
 sanification system based on UVC-LEDs, specifically tested with reference to SARS-CoV-
 2 virus. The proposed system is designed to inactivate the virus located on the surface of
 personal and community objects, in particular spherical sport balls, thus being ideal for
 the disinfection in community environments (sport field, school, …).

 Experimental details
 The light-emitting part of the system is represented by commercially available off-
 the-shelf UVC LEDs. For the proposed study we evaluated 6 UVC LEDs from different
 manufacturers, the details of the LEDs, as determined from each datasheet, are reported
 in Table I.

 Table I: LED selection and properties

 Manufacturer LED Nominal Nominal Nominal Maximum Voltage Vf
 Code current IN flux @ IN wavelength current (V)
 (mA) (mW) (nm) (mA)
 A A1 20 2-4 270-280 40 6.5
 A A2 350 37.5 275 800 6.5
 A A3 350 37.5 280 800 6.5
 B B1 150 7.5 278 150 7.5
 C C1 100 10 275 150 6.3
 D D1 50 5 278 100 6.1

 UVC LED technology is still under development. From the technical and
 cost/manufacturing aspects it becomes crucial to carefully estimate the electrical and
 optical properties of the available LEDs as a starting point for the design optimization.
 In this work we performed: i) electrical characterization by means of current-voltage
 characteristics, ii) optical characterization by means of absolute spectral measurement; iii)
 efficiency analysis at different driving currents.
 The electrical characterization was carried out by means of a Keithley 2614B Source-
 meter analyzer. For each LED, the voltage was swept between -2 V and the maximum
 rated voltage. The optical characterization was carried out by means of an absolute
 irradiance calibrated Ocean Insight USB4000 spectrometer equipped with a CC3-DA
 cosine corrector, the spectral range is between 200 and 850 nm. In order to perform the
 optical flux measurement, the LEDs were mounted on a 2 axis stepper motor goniometer
 and rotated in order to calculate the radiated flux from irradiance measurements. To
 acquire a sufficient signal from the LEDs the aperture of the spectrometer has been
 positioned at a distance of 300 mm from the emitter. The power emitted from the LED has
 also been measured at different current levels, in order to extract the efficiency of the
 different devices as a function of driving current.
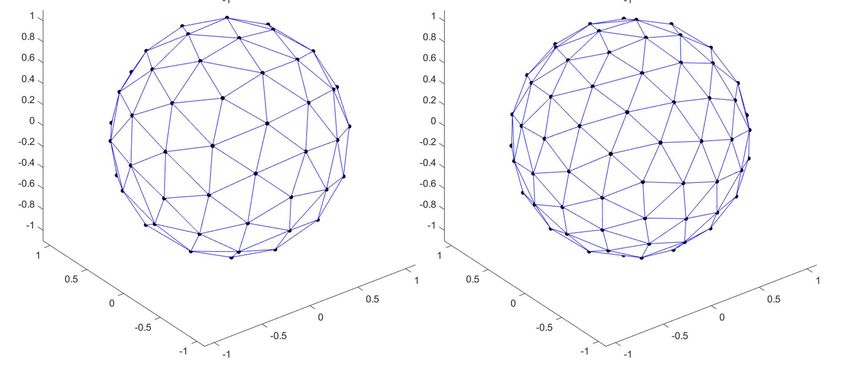
Preprints (www.preprints.org) | NOT PEER-REVIEWED | Posted: 25 February 2021 doi:10.20944/preprints202102.0588.v1

 3 of 14

 The design of the irradiation chambers has been carried out by means of ray tracing
 simulations. For the implementation of the sources a rayfile has been calculated from the
 angular emission of the LEDs as previously measured. The optical simulations are aimed
 at calculating the spatial resolved irradiance on a sensor surface. The surface is shaped as
 the target object: a sphere, representing the largest object to be irradiated (sportsball).
 The material and relative surface reflectivity used in the simulation is a steel surface
 covered with chromium, from the work of Sarosi et al. [12] we estimate a reflectivity of
 60% at 275 nm. Distributing uniformly points on the surface of a sphere is a well-known
 problem with no perfect solution. The Matlab function ParticleSampleSphere [13]
 has been used to generate an approximately uniform triangular tessellation of a unit
 sphere (used at the beginning for minimizing the generalized electrostatic potential
 energy, i.e., Reisz s-energy, of a system of charged particles). Effectively, this function uses
 gradient descent and produces a locally optimal solution to the problem that involves
 finding a minimum Reisz s-energy configuration of N equally charged particles confined
 to the surface of a unit sphere. Initial configuration of particles is based on random
 sampling of a sphere.
 Figure 1 reports the point distributions as calculated by the Matlab function and used
 in the following of this work for the design of a spherical emitting surface.

 Figure 1: Calculated point distribution on the surface of a sphere (top left) 25 points, (top right) 50
 points, (bottom left) 75 points, (bottom right) 100 points.
Preprints (www.preprints.org) | NOT PEER-REVIEWED | Posted: 25 February 2021 doi:10.20944/preprints202102.0588.v1

 4 of 14

 Design target
 When the wavelength is fixed, the antiviral effectiveness of a UV system is related to
 a specific irradiation fluence, corresponding to a specific light energy per unit area. The
 final aim of this design is to guarantee that in nearly the entirety of the irradiated object
 surface reaches a minimum fluence. Considering that for the type of the systems analyzed
 in this work the irradiation time is the same for the entire target surface, a minimum flu-
 ence value translates into a minimum irradiance value.
 In both systems the target of the design is an optimization of the minimum irradiance
 on the target surface versus the cost of the system. For this analysis the cost of the system
 is represented mainly by the cost of the single LED multiplied by the number of the LEDs
 in the system. On the market, LEDs emitting at a peak wavelength of 275 ± 10 nm are
 available with different radiant fluxes, typical values go from 10 mW for a 100 mA device
 to 110 mW for a 800 mA device. Considering that the price of these LEDs ( ) in-
 creases with their emitted optical power ( ) with a nearly linear dependence (defined
 factor in the following), we estimate that the price of the system ( ) composed
 of N LEDs is related to the total optical power ( ) emitted and that the LEDs all have
 the same power.
 = ∗ (1)
 = ∗ (2)
 = ∗ = ∗ ∗ = ∗ (3)
 For a finer assessment of the costs, one should consider that, by increasing the num-
 ber of LEDs an intrinsic higher manufacturing and assembly cost: we will therefore care-
 fully optimize their number.
 For a fixed treatment time, the design rule becomes to obtain a minimum irradiance
 for a given total installed power. Since a local irradiance higher than the minimum is not
 necessary, the immediate annotation is that to improve the minimum irradiance we
 should also improve the irradiance uniformity, in order not to waste any optical power.
 Optical design
 From recent scientific literature, the amount of fluence necessary to inactivate the
 Sars-CoV-2 is estimated at different values approximately between 6-8 mJ/cm 2 [14], up to
 37.5 mJ/cm2 [15] Our aim is to inactivate the virus in few minutes, possibly just 60 seconds.
 We set the ideal average irradiance at 2.5 W/m2 and a target minimum irradiance of 1
 W/m2. The ideal average irradiance does not consider the actual optical losses, while the
 minimum irradiance is the target value for the optimization we will use in the following.
 In the design of the system, several possible architectures have been evaluated, but
 for manufacturing simplicity a design constraint has been set: LEDs are positioned onto a
 spherical surface with a diameter of 330 mm, the optical axis of each LED is pointing at
 the center of the sphere. We will optimize the number of the LEDs together with their
 optical power. The uniformity will be evaluated for 25, 50, 75 and 100 LEDs, while the
 sum of the power emitted by the LEDs will be approximately 500 mW. We will also in-
 vestigate the effect of the diameter of the internal sphere with respect to irradiance values.
 The best optimization solution will be the configuration allowing the higher minimum
 value of irradiance.
 To analyze the data we will use, among others, the non-uniformity NU parameter,
 defined as reported below:
 −
 = × 100 [%] (4)
 +
Preprints (www.preprints.org) | NOT PEER-REVIEWED | Posted: 25 February 2021 doi:10.20944/preprints202102.0588.v1

 5 of 14

 Biological materials and assays
 Viral stock preparation and viral titer evaluation
 The photoinactivation tests have been performed against virus belonging to family
 of Coronaviridae, SARS-CoV-2. All the experiments were performed in a biosafety level 3
 laboratory, while the virus was obtained from ISS (Istituto Superiore della Sanità, Italy).
 Each viral suspension was prepared and propagated on a large scale in monolayer cell
 cultures of Vero E6 ATCC CCL-81™ (American Type Culture Collections). Cell cultures
 were incubated at 37 °C with 5% (v/v) CO2 in DMEM (Dulbecco's Modified Eagle Me-
 dium) added with 10% (v/v) of fetal bovine serum (FBS), 1% (w/v) of penicillin-strepto-
 mycin.
 Viral titer was calculated using the Spaerman - Karber equation (ID50 assessment), as
 follows:

 − = −( ) − − 0.5 × − ℎ (5)
 100
 Where is the 10th base logarithm of the lowest dilution with 100% positive reac-
 tion and (CPE) is the summation (%) of positive cultures.
 Photo-virucidal test
 The photo-virucidal test was performed at 20° C. A volume of 50 µL of the viral sus-
 pension (107 PFU/ml) has been inoculated directly on three different samples: a basket
 ball, a soccer ball and a volley ball. The suspension was allowed to dry and then have been
 then the sample has been placed inside the irradiation chamber. A 35 mm stainless steel
 support disc was inoculated with a viral suspension (50 µL) and not irradiated and used
 as control.
 After UVC irradiation (1 min and 2 min), a sterile swab was used to recover the re-
 sidual virus from sample surface. Thereafter, the swab was inoculated in 1 ml of fresh
 medium and ten-fold dilutions (from 10-2 to 10-9) were prepared. Each dilution was used
 to inoculate six wells of 24-well plates containing confluent VERO culture (> 90 %). Six
 wells of the plate were untreated and considered as controls. Cells were incubated at 37 °
 C for 1 h, and subsequently the supernatant culture was removed, and cells were washed
 with PBS and added with fresh medium (500 µl of DMEM supplemented with 2% v/v FBS
 and 0.75% v/v of carboxymethylcellulose).
 After incubation at 37°C for three days, the plaque formation was checked and upon
 Crystal Violet staining, the infectivity title (ID50) was determined with the Spaerman -
 Kärber equation previously shown (5). A decrease of ≥ 4 log unit of viral titer (pfu/ml) can
 be considered a virucidal effect.

 Results
 LED characterization results
 The spectrum of the analyzed LEDs are reported in Figure 2, they have been meas-
 ured at the nominal current, normalized to the maximum value and plotted in semilog
 scale. Results indicate that the peak emission wavelength ranges from 275nm for LEDs
 B1, C1, D1 and 284 nm for LED A2. LED A3 shows an evident higher wavelength emis-
 sion, thus indicating a possible higher defect density related to Mg acceptors and Nitrogen
 vacancies [16]. Results of the LED characterized optical power are reported in Figure 3.
 While LED A2 reports the higher optical power, we focus on the area of around 10 mW to
 evaluate an LED candidate for the next phase, where B1 and C1 report the higher value
 for the same current, with a slight advantage for C1.
 The results of the electrical characterization are reported in Figure 4, due to their
 larger chip size, LEDs A2 and A3 show a much lower voltage for the same current. For
 the other LEDs results are similar up to 100mA, with a Vf of 5.6V, above this current the
 higher series resistance of LED C1 has an important effect on voltage drop with respect to
 D1. Analyzing the efficiency of the LED samples, we detect that the efficiency (Figure 5)
Preprints (www.preprints.org) | NOT PEER-REVIEWED | Posted: 25 February 2021 doi:10.20944/preprints202102.0588.v1

 6 of 14

 varies between 1 and 3 %. Interestingly LEDs with smaller chip (LED A1) has higher effi-
 ciency than bigger LEDS (A2 and A3), the analyzed LEDs have similar efficacy at around
 100 mA with values of approx. 1.75 %. All the analyzed LEDs suffer from efficiency droop,
 but the amount of the droop is strongly dependent on the LED series resistance, for exam-
 ple as seen between B1 and C1. It is also possible to notice that LED B1 has a lower effi-
 ciency at lower currents, possibly indicating that a higher defect density increases the non-
 radiative recombination rate, thus limiting the efficiency at low injection levels [17].

 1
 A1
 Normalized spectrum @ IN

 A2
 0.1 A3
 B1
 C1
 D1
 0.01

 0.001

 1E-4
 240 260 280 300 320 340 360 380
 Wavelength (nm)

 Figure 2: Normalized spectrum of the selected LEDs, semi logarithmic scale, LEDs measured at
 nominal current, 25°C.
Preprints (www.preprints.org) | NOT PEER-REVIEWED | Posted: 25 February 2021 doi:10.20944/preprints202102.0588.v1

 7 of 14

 60
 20 50
 40

 Flux
 30
 20
 15 10
 0
 Flux (mW)

 0 200 400 600 800
 Current (mA)
 10

 A1
 5 A2
 A3
 B1
 0 C1
 D1
 0 25 50 75 100 125 150 175 200
 Current (mA)

 Figure 3: Optical flux as a function of current for the selected LEDs.

 0.9

 0.8 A1
 A2
 0.7
 A3
 0.6 B1
 Current (A)

 0.5
 C1
 D1
 0.4

 0.3

 0.2

 0.1

 0.0

 4.6 4.8 5.0 5.2 5.4 5.6 5.8 6.0

 Voltage (V)

 Figure 4: Electrical characteristics of the selected LEDs.
Preprints (www.preprints.org) | NOT PEER-REVIEWED | Posted: 25 February 2021 doi:10.20944/preprints202102.0588.v1

 8 of 14

 3.5
 A1
 3.0 A2
 A3
 2.5 B1
 Efficiency (%)

 C1
 2.0 D1

 1.5

 1.0

 0.5

 0.0
 0.001 0.01 0.1 1
 Current (A)
 Figure 5: Wall plug efficiency as a function of LED current for the selected samples.

 Design
 LED choice
 Based on the previous characterization phase Both LEDs B1 and C1 are good candi-
 dates for the design of the system. They have lower emission wavelength, higher OP at
 around 100 mA with respect to the other candidates. While B1 has higher efficiency and
 lower voltage, C1 has slightly higher OP. Also due to commercial availability, LED C1 has
 been chosen for the development of the irradiation system.
 Optical design
 The results of the ray tracing simulations are plotted in Figure 6 as the number of
 LEDs increases, the irradiance becomes more uniform on the target surface. The average
 irradiance is almost not affected due to the total optical power of the system being fixed
 at 500 mW in all the simulations. For a quantitative analysis we report in Figure 7 the
 minimum, average and maximum for the 4 combinations. A massive variation in uni-
 formity is detected between 25 and 50 LEDs, while increasing the number of sources above
 50 provide a measurable, but minor improvement.
Preprints (www.preprints.org) | NOT PEER-REVIEWED | Posted: 25 February 2021 doi:10.20944/preprints202102.0588.v1

 9 of 14

 Irradiance (W/m2) Irradiance (W/m2)
 3.000 3.000
 100 100

 80 2.750 80 2.750

 60 60
 2.500 2.500
 40 40

 y position (mm)
 y position (mm)

 2.250 2.250
 20 20

 0 2.000 0 2.000

 -20 -20
 1.750 1.750

 -40 -40
 1.500 1.500
 -60 -60

 -80 1.250 -80 1.250

 -100 1.000 -100 1.000

 -100 -80 -60 -40 -20 0 20 40 60 80 100 -100 -80 -60 -40 -20 0 20 40 60 80 100
 x position (mm) x position (mm)
 (a) (b)

 Irradiance (W/m2) Irradiance (W/m2)
 3.000 3.000
 100 100

 80 2.750 80 2.750

 60 60
 2.500 2.500
 40 40
 y position (mm)

 20
 2.250
 y position (mm) 20
 2.250

 0 2.000 0 2.000

 -20 -20
 1.750 1.750
 -40 -40
 1.500 1.500
 -60 -60

 -80 1.250 -80 1.250

 -100 1.000
 -100 1.000

 -100 -80 -60 -40 -20 0 20 40 60 80 100 -100 -80 -60 -40 -20 0 20 40 60 80 100
 x position (mm) x position (mm)
 (c) (d)

 Figure 6: Optical simulation results: irradiance on the surface of the sphere, total optical power is
 constant at 500 mW, (a) 25 points, (b) 50 points, (c) 75 points, (d) 100 points.
Preprints (www.preprints.org) | NOT PEER-REVIEWED | Posted: 25 February 2021 doi:10.20944/preprints202102.0588.v1

 10 of 14

 3.0 Average
 Minimum
 Maximum
 2.5
 Irradiance (W/m2)

 2.0

 1.5

 1.0

 0.5
 25 50 75 100
 Number of LEDs

 Figure 7: Simulated maximum, minimum and average irradiance as a function of the number of
 LEDs

 Selected optical design
 The design choice has been the use of 56 LEDs, just above the number of 50 as de-
 scribed in the previous section. To allow the subdivision of the sphere in two identical
 hemispheres with a 330 mm diameter it has been necessary to slightly modify the position
 of the LEDs, the consequent reduction in the optimized uniformity has been compensated
 by introduction of 6 more LEDs, bringing the total to 56. The optical power of the single
 LEDs has been kept at a nominal value of 10 mW, thus allowing a small increase in aver-
 age irradiance.
 For the manufactured prototype it has also been evaluated (Figure 8) the effect of the
 size of the irradiated sphere, we simulated the irradiance for spheres ranging from 65 mm
 (the size of a tennis ball) to 250 mm (the size of a basket ball) placed at the center of the
 irradiation chamber. The concentric structure of the system implies that the reduction of
 the size of the target sphere allows an increase of the average irradiance as well as a re-
 duction of the NU on the surface of the target. The best condition is achieved for a target
 diameter sphere of 125 mm.
 The manufacturing of the prototype has been carried out by means of two-chrome
 plated identical steel hemispheres. Since a spherical cavity with specular reflectivity
 would have the effect of guiding the rays which are not incident onto the target surface in
 a circular loop, a diffused reflectivity has been chosen for the plating process. The effect
 of diffused reflectivity on the performance of the system has been reported in Figure 9. It
 can be noticed that as the reflectivity increases the average irradiance increases in a more
 than linear fashion, the non uniformity of the system therefore reduces. With a chromium
 reflectivity of approx. 50% in the a non uniformity of 23% is expected at 275 nm.
Preprints (www.preprints.org) | NOT PEER-REVIEWED | Posted: 25 February 2021 doi:10.20944/preprints202102.0588.v1

 11 of 14

 2.2

 Irradiance (W/m2) 2.0

 1.8

 1.6

 1.4
 Maximum
 Average
 1.2 Minimum

 60 80 100 120 140 160 180 200 220 240 260
 Target object diameter (mm)

 Figure 8: Irradiance as a function of the internal object diameter.

 3.0 30

 2.8

 2.6
 25
 Non uniformity (%)

 2.4
 Irradiance (W/m2)

 2.2
 20
 2.0

 1.8

 1.6 max 15
 average
 1.4
 min
 1.2 NU
 10
 0 25 50 75 100
 Internal surface diffuse reflectivity (%)

 Figure 9: Irradiance and non-uniformity parameter (NU) as a function of internal surface reflectivity
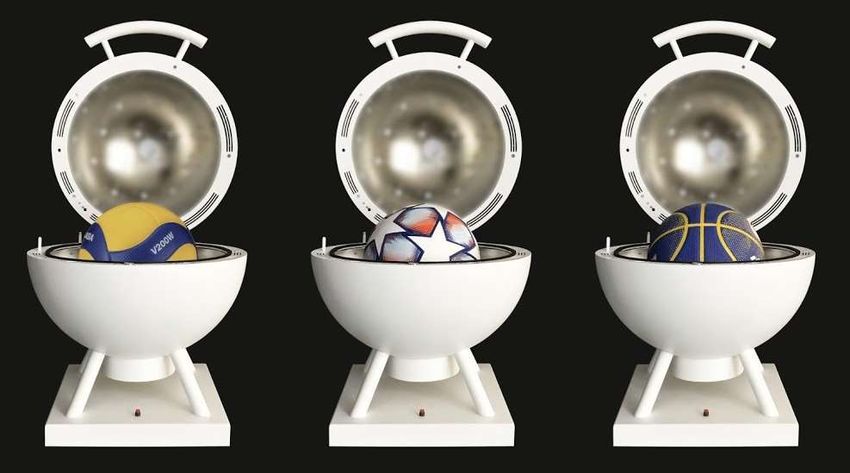
Preprints (www.preprints.org) | NOT PEER-REVIEWED | Posted: 25 February 2021 doi:10.20944/preprints202102.0588.v1

 12 of 14

 Electronic design, safety and robustness
 The prototype is driven by standard constant current LED drivers with a high output
 voltage (up to 200 VDC) allowing the connection of several UVC LEDs in series. The sys-
 tem is regulated and managed by a microcontroller to automate the irradiation process:
 after the defined irradiation time has elapsed, the LEDs are switched off and the treatment
 is complete. Since short wavelength light is dangerous both for eyes and skin, when deal-
 ing with UVC LEDs maximum care should be taken to avoid accidental human exposure.
 Both systems are equipped with safety mechanical switches to interrupt the LED circuit
 and to give feedback to the microcontroller. When the door gets open, the treatment may
 or may not be completed, the microcontroller resets the timer and when the door is closed
 it starts over to ensure the designed dose is reached. The system has also been designed
 to ensure that in case of an LED failure (open circuit or short circuit) the microcontroller
 detects the voltage variation on the LED chain and reports a failure.

 Optical characterization results
 The characterization of the prototype reported in Figure 10 has been carried out by a
 spherical structure with a diameter of 250 mm, the USB4000 spectrometer is encased so
 that the cosine corrector is tangent to the spherical supporting structure. By rotating the
 spectrometer support it has been possible to measure the spatial irradiance of a portion of
 the target surface. Results are presented in Figure 11. The measured minimum irradiance
 is similar to the simulated value, but since the maximum and average values are slightly
 lower the NU is down to 13.5% in the sampled area.

 Figure 10: Picture of the manufactured prototype with the different tested balls.
Preprints (www.preprints.org) | NOT PEER-REVIEWED | Posted: 25 February 2021 doi:10.20944/preprints202102.0588.v1

 13 of 14

 -10 0 10 Irradiance (W/m2)
 -20 20 1.850
 14 30
 1.800
 12 1.750
 10 1.700

 8 1.650

 1.600
 6
 1.550
 4 1.500
 2 1.450

 0 1.400

 1.350

 Min Irradiance = 1.385 W/m2
 Average Irradiance = 1.64 W/m2
 Max Irradiance = 1.818 W/m2
 Figure 11: measured uniformity on the surface of a 250 mm sphere wedge.

 Virucidal tests results
 The virucidal test results are reported in
 Table II, three balls for Soccer, Basketball and Volleyball have been tested. Results indi-
 cate that for both 1 and 2 minutes exposure time the percent reduction after test contact
 time is greater than 99.9%, corresponding to more than log 3 inactivation.

 Table II: Results of the SARS-CoV-2 virucidal tests carried out on the surface of different sport
 balls.

 Ball type Duration of the Viral titer before Viral titer after Percent reduction
 treatment treatment* treatment* after test contact
 time
 Soccer ball 1 min
 7.0 0.01 > 99.9 %
 (3 repetitions) 2 min
 basket ball 1 min
 7.0 0.01 > 99.9 %
 (3 repetitions) 2 min
 Volley ball 1 min
 7.0 0.01 > 99.9 %
 (3 repetitions) 2 min
 *Data express the log value of plaque-forming units per milliliter of viral suspension (PFU/ml) at
 different irradiation times.

 Conclusions
 With this work we presented an in dept optical optimization analysis for the design
 of effective surface treatment systems based on 275nm UVC LEDs, with spherical volume
 of 18 liters. The light sources are 10mW LEDs emitting at 275nm, which have been selected
 after an experimental comparison between different manufacturers and solutions. The de-
 sign target has been the achievement of a minimum level of irradiance, and optimization
 of the light uniformity: a spherical distribution of 56 LEDs has been chosen, together with
 a chrome plating treatment of the internal surface of the irradiation chamber.
 A prototype of the designed solution has been manufactured, irradiance characteri-
 zation reported a minimum irradiance of 1.385 W/m2.
 The antiviral efficacy of the prototype has been demonstrated with respect to Sars-
 CoV-2 virus by means of specific viral titering before and after the treatment: an
Preprints (www.preprints.org) | NOT PEER-REVIEWED | Posted: 25 February 2021 doi:10.20944/preprints202102.0588.v1

 14 of 14

 inactivation greater than 99.9% has been detected after 1 minute of exposure. The esti-
 mated dose for the treatment, calculated at the minimum irradiance, is 83.1 J/m2. The re-
 sults of this study are of fundamental importance for the design of virus inactivation sys-
 tems to be used in school and community objects, and can be readily implemented for the
 realization of UV-C based systems.

 References:
 1. Roy, D.; Tripathy, S.; Kar, S.K.; Sharma, N.; Verma, S.K.; Kaushal, V. Study of knowledge, attitude, anxiety & perceived mental healthcare need in Indian

 population during COVID-19 pandemic. Asian J. Psychiatr. 2020, 51, 102083, doi:10.1016/j.ajp.2020.102083.

 2. Ceylan, R.F.; Ozkan, B.; Mulazimogullari, E. Historical evidence for economic effects of COVID-19. Eur. J. Heal. Econ. 2020, 21, 817–823, doi:10.1007/s10198-020-

 01206-8.

 3. Stadnytskyi, V.; Bax, C.E.; Bax, A.; Anfinrud, P. The airborne lifetime of small speech droplets and their potential importance in SARS-CoV-2 transmission. Proc.

 Natl. Acad. Sci. 2020, 117, 11875–11877, doi:10.1073/pnas.2006874117.

 4. Cook, T.M. Personal protective equipment during the coronavirus disease (COVID) 2019 pandemic – a narrative review. Anaesthesia 2020, 75, 920–927,

 doi:10.1111/anae.15071.

 5. Gondim, J.A.M. Preventing epidemics by wearing masks: An application to COVID-19. Chaos, Solitons & Fractals 2021, 143, 110599,

 doi:10.1016/j.chaos.2020.110599.

 6. Morten Gram Pedersen, M.M. Data-driven estimation of change points reveals correlation between face mask use and accelerated curtailing of the COVID-19

 epidemic in Italy. COVID-19 SARS-CoV-2 Prepr. from medRxiv bioRxiv 2020, doi:https://doi.org/10.1101/2020.06.29.20141523.

 7. Fiorillo, L.; Cervino, G.; Matarese, M.; D’amico, C.; Surace, G.; Paduano, V.; Fiorillo, M.T.; Moschella, A.; La Bruna, A.; Romano, G.L.; et al. COVID-19 surface

 persistence: A recent data summary and its importance for medical and dental settings. Int. J. Environ. Res. Public Health 2020, 17, doi:10.3390/ijerph17093132.

 8. Inagaki, H.; Saito, A.; Sugiyama, H.; Okabayashi, T.; Fujimoto, S. Rapid inactivation of SARS-CoV-2 with deep-UV LED irradiation. Emerg. Microbes Infect. 2020,

 9, 1744–1747, doi:10.1080/22221751.2020.1796529.

 9. Asif Khan, M. AlGaN multiple quantum well based deep UV LEDs and their applications. Phys. status solidi 2006, 203, 1764–1770, doi:10.1002/pssa.200565427.

 10. Shatalov, M.; Jain, R.; Saxena, T.; Dobrinsky, A.; Shur, M. Development of Deep UV LEDs and Current Problems in Material and Device Technology. In; 2017;

 pp. 45–83.

 11. Trivellin, N.; Monti, D.; De Santi, C.; Buffolo, M.; Meneghesso, G.; Zanoni, E.; Meneghini, M. Current induced degradation study on state of the art DUV LEDs.

 Microelectron. Reliab. 2018, 88–90, 868–872, doi:10.1016/j.microrel.2018.07.145.

 12. Sárosi, Z.; Knapp, W.; Kunz, A.; Wegener, K. Evaluation of reflectivity of metal parts by a thermo-camera. InfraMation 2010 Proc. 2010,

 doi:https://doi.org/10.3929/ethz-a-006206911.

 13. Semechko, A. Suite of functions to perform uniform sampling of a sphere 2020.

 14. Gerchman, Y.; Mamane, H.; Friedman, N.; Mandelboim, M. UV-LED disinfection of Coronavirus: Wavelength effect. J. Photochem. Photobiol. B Biol. 2020, 212,

 112044, doi:10.1016/j.jphotobiol.2020.112044.

 15. Hamzavi, I.H.; Lyons, A.B.; Kohli, I.; Narla, S.; Parks-Miller, A.; Gelfand, J.M.; Lim, H.W.; Ozog, D.M. Ultraviolet germicidal irradiation: Possible method for

 respirator disinfection to facilitate reuse during the COVID-19 pandemic. J. Am. Acad. Dermatol. 2020, 82, 1511–1512, doi:10.1016/j.jaad.2020.03.085.

 16. Trivellin, N.; Monti, D.; Piva, F.; Buffolo, M.; De Santi, C.; Zanoni, E.; Meneghesso, G.; Meneghini, M. Degradation processes of 280 nm high power DUV LEDs:

 Impact on parasitic luminescence. Jpn. J. Appl. Phys. 2019, 58, doi:10.7567/1347-4065/ab1393.

 17. Kim, M.-H.; Schubert, M.F.; Dai, Q.; Kim, J.K.; Schubert, E.F.; Piprek, J.; Park, Y. Origin of efficiency droop in GaN-based light-emitting diodes. Appl. Phys. Lett.

 2007, 91, 183507, doi:10.1063/1.2800290.
You can also read