Nanoscale optical and structural characterisation of silk
←
→
Page content transcription
If your browser does not render page correctly, please read the page content below

Nanoscale optical and structural characterisation of silk
Meguya Ryu1, Reo Honda1, Adrian Cernescu2, Arturas Vailionis3,4, Armandas Balčytis5,
Jitraporn Vongsvivut6, Jing-Liang Li7, Denver P. Linklater5, Elena P. Ivanova8,
Vygantas Mizeikis9, Mark J. Tobin6, Junko Morikawa1 and Saulius Juodkazis*5,10,11

  Full Research Paper                                                                                                         Open Access

  Address:                                                                  Beilstein J. Nanotechnol. 2019, 10, 922–929.
  1Tokyo Institute of Technology, Meguro-ku, Tokyo 152-8550, Japan,         doi:10.3762/bjnano.10.93
  2Neaspec GmbH, Bunsenstrasse 5, 82152 Martinsried, Germany,
  3Stanford Nano Shared Facilities, Stanford University, Stanford, CA       Received: 27 October 2018
  94305, USA, 4Department of Physics, Kaunas University of                  Accepted: 09 April 2019
  Technology, Studentu street 50, LT-51368 Kaunas, Lithuania,               Published: 23 April 2019
  5Swinburne University of Technology, John st., Hawthorn, 3122 Vic,

  Australia, 6Infrared Microspectroscopy Beamline, Australian               Associate Editor: C. T. Yavuz
  Synchrotron, Clayton, Victoria 3168, Australia, 7Institute for Frontier
  Materials, Deakin University, Geelong, VIC 3220, Australia, 8School       © 2019 Ryu et al.; licensee Beilstein-Institut.
  of Science, RMIT University, Melbourne, VIC 3001, Australia,              License and terms: see end of document.
  9Research Institute of Electronics, Shizuoka University, Naka-ku,

  3-5-3-1 Johoku, Hamamatsu, Shizuoka 4328561, Japan, 10Tokyo
  Tech World Research Hub Initiative (WRHI), School of Materials and
  Chemical Technology, Tokyo Institute of Technology, 2-12-1,
  Ookayama, Meguro-ku, Tokyo 152-8550, Japan and 11Melbourne
  Center for Nanofabrication, Australian National Fabrication Facility,
  Clayton 3168, Melbourne, Australia

  Email:
  Saulius Juodkazis* - sjuodkazis@swin.edu.au

  * Corresponding author

  Keywords:
  absorbance; anisotropy; retardance; silk

Abstract
The nanoscale composition of silk defining its unique properties via a hierarchial structural anisotropy needs to be analysed at the
highest spatial resolution of tens of nanometers corresponding to the size of fibrils made of β-sheets, which are the crystalline build-
ing blocks of silk. Nanoscale optical and structural properties of silk have been measured from 100 nm thick longitudinal slices of
silk fibers with ca. 10 nm resolution, the highest so far. Optical sub-wavelength resolution in hyperspectral mapping of absorbance
and molecular orientation were carried out for comparison at IR wavelengths of 2–10 μm using synchrotron radiation. A reliable
distinction of transmission changes by only 1–2% as the anisotropy of amide bands was obtained from nanometer-thin slices of silk.

Introduction
Recent advances in the nanofabrication of electronic devices                  Such technologies are particularly important to probe molecu-
require cutting-edge analytical technologies to provide a reli-               lar properties of cross sections smaller than 100 nm in all three
able structural characterisation of materials at the nanoscale.               dimensions, which is of rapidly growing interest in the field of

                                                                                                                                           922
Beilstein J. Nanotechnol. 2019, 10, 922–929.

nanotechnology. Electronic chip manufacturing is currently              tive measurements of the absorbance by different near- and far-
introducing the sub-10 nm fabrication node (a half pitch of a           field techniques are essentially required to understand differ-
grating pattern) in the development of 3D fin-gates of field-           ences in electric-field determination of the local light and its
effect transistors. Nanofabrication techniques are approaching          interaction with the sample [12].
single-digit-nanometer resolution using electron emission [1]
and thermal probes [2,3]. Further control of surface nanotex-           Different modalities of sample preparation for nanoscale
turing, to achieve regularly patterned features with sub-100 nm         imaging include focused ion beam milling and microtome
resolution, is currently under development for inherent material        slicing. When the thickness of samples, especially soft biomate-
properties, such as controllable surface wettability, anti-             rials, is close to 100 nm the cutting tool might cause tear- and
biofouling, anti-reflection, and biocidal/bactericidal properties       cut-induced strain below the surface. In turn, this can cause arti-
[4,5]. For example, the motheye plastic films produced by roll-         facts in the determination of optical properties that are related to
to-roll technology already replicate nanopillars with 100 nm            the mass density and its gradients. It is important to measure n
separation (MOSMITE from Mitsubishi Chemicals Ltd.).                    and κ from decreasingly smaller volumes and to compare with
                                                                        data obtained from the bulk samples.
The structural and optical properties of a material are interre-
lated. By using a wide spectrum of electromagnetic waves from           Here, we used a near-field scattering method to probe n and κ
visible light to terahertz radiation, it is possible to gain insights   and to determine spectral differences between the reflectance
into complex hierarchical structures of composite materials. For        and absorbance of silk fibers with ca. 10 nm resolution. Cross
materials with strong structural anisotropy, defined by the mo-         sections of silk fibers were prepared using an ultramicrotome.
lecular orientation and alignment of crystalline microvolumes, it       Silk was chosen due to its well-known spectral properties and
is important to characterise structure at the highest lateral and       its increasing applications as a biocompatible and biodegrad-
longitudinal resolutions [6,7]. Anderson localisation of light and      able material [13,14]. Silk exhibits a uniaxial symmetry that can
thermal cooling of silk at IR wavelengths was recently demon-           be examined from longitudinal microtome slices used in this
strated to be related to the fibril substructure of silk, which was     study. Sub-wavelength resolution in hyperspectral IR mapping
in the range of tens of nanometers [8]. This defines the range of       of absorbance and orientational properties of the absorbing
the spatial resolution required for structural and chemical             bands was reliably achieved in 100 nm thick slices of silk. Such
analyses that are typically carried out using X-ray and IR-based        a high-resolution technique is essential in order to gain a better
techniques at larger scales.                                            understanding of the fibril structure of silk [8].

Real and imaginary parts of the refractive index,                   ,   Experimental
together with the orientation dependency of the birefringence           Silk slices
Δn and dichroism Δκ, define the optical response of a material.         White Bombyx mori cocoons were purchased from the silk
The reflectance R is proportional to the real part, while the ab-       rearing house in Jiangsu, China, and brown Antheraea pernyi
sorbance A corresponds to the imaginary part of . Recently,             silkworm cocoons were collected from Liaoning Province,
we demonstrated that the IR measurements of silk performed              China. The white and brown silk fibers used in this work are
using three different methods, i.e., (i) a table-top Fourier-trans-     fibroin fibers obtained by degumming Bombyx mori and
form infrared (FTIR) transmission spectrometer, (ii) a synchro-         Antheraea pernyi silk fibres, respectively. To degum the fibres,
tron-based attenuated total reflection (ATR) FTIR spectrometer,         the cocoons were boiled three times in an aqueous 0.5% (w/v)
and (iii) an atomic force microscopy (AFM) tip responding to            Na2CO3 solution to remove the sericin coating. The degummed
the absorbed IR light (nano-IR [9]), produced comparable spec-          silk fibers were rinsed with warm ultrapure water (60 °C) thor-
tral features [10]. Whilst the first two modalities probe microm-       oughly to remove the residual sericin, and then dried at room
eter-sized volumes of silk, the AFM-based nano-IR technique             temperature.
acquires structural information at the nanoscale (i.e., the area
under the AFM tip from a volume with a lateral cross section of         Silk fibers were embedded in epoxy resin (Oken Ltd., Japan)
ca. 20 nm). Differences in absorbance and spectral line shapes          and cut by using an ultramicrotome to achieve a sample thick-
of the characteristic silk bands are related to the different sensi-    ness of ca. 100 nm. The slices were then immobilised on
tivity of R and A to the real and imaginary parts of                .   IR-transparent non-birefringent CaF 2 substrates.
The absorbance measured from the far-field transmission
directly reflects the imaginary part of the index κ, while the ab-      X-ray characterization
sorbance obtained in the ATR-FTIR mode is affected by the               3D X-ray computed microtomography (micro-CT) of white
real part of the index via Snell’s law [11]. As a result, compara-      Bombyx mori silk fibers was performed using a ZEISS Versa

                                                                                                                                          923
Beilstein J. Nanotechnol. 2019, 10, 922–929.

520 X-ray Microscope at the Stanford Nano Shared Facilities,                     phy) by its basic AFM operation and, simultaneously, under
Stanford University. The scan settings were as follows: source                   external infrared illumination (broadband laser with difference
voltage - 30 kV, pixel size - 3.15 μm, number of projections -                   frequency generation, Toptica), acts as a light-concentrating
1600, exposure time - 10 s. The micro-CT dataset was recon-                      antenna such that the sample is probed with a nanofocused light
structed using the ZEISS Scout-and-Scan Reconstructor soft-                      field. The AFM tapping-mode operation (ca. 60 nm amplitude)
ware (Figure 1).                                                                 modulates the near-field interaction between the tip and sample
                                                                                 [15]. An asymmetric Michelson interferometer and a lock-in
2D X-ray diffraction of Bombyx mori silk was carried out on a                    detection of the signal at higher harmonic of the tapping fre-
Bruker D8 Venture single-crystal diffractometer using a Cu Kα                    quency (approximately 250 kHz) provides background-free
microfocus X-ray source with λ = 1.5418 Å (Figure 2a).                           nano-IR spectra and images with maximum resolution imposed
                                                                                 by the AFM tip size independent of the laser wavelength [12].
IR spectral measurements
The sub-diffraction scattering scanning near-field optical micro-                The nano-FTIR spectra were recorded at a rate of
scope (s-SNOM, neaspec GmbH) uses a metalized atomic force                       ca. 100 s/spectrum with a spectral resolution of 10 cm −1 .
microscopy (AFM) tip. The tip maps the surface relief (topogra-                  Removal of the instrumental response function from the nano-

 Figure 1: X-ray tomographic images showing 3D rendered volumes of white Bombyx mori silk fibers at 3.15 μm pixel resolution. The bundle of silk
 fibers is composed of degummed single-strand silk fibers.

 Figure 2: (a) Wide-angle 2D X-ray diffraction of a bundle of white Bombyx mori silk fibers. The inset shows an optical microscopic image of a
 convolved silk fiber bundle. The silk bundle was composed of degummed single-strand silk fibers. The long axis of the fibers was predominantly
 vertical. (b) Optical image of white silk fibers through an optically aligned polariser–analyser (high-transmission) setup under white-light illumination
 using a Nikon MPlan 10× DIC objective lens with numerical aperture NA = 0.25.

                                                                                                                                                             924
Beilstein J. Nanotechnol. 2019, 10, 922–929.

FTIR spectra was done by normalization of the measured spec-                     Bragg’s law d = λ/(2sinθ). The size L of the nanocrystalline
tra to a reference Si signal. Resulting nano-FTIR absorption and                 phase can be estimated from the Scherrer equation
reflectivity spectra can be directly correlated with the standard                L = Kλ/(B(2θ)cosθ; where K = 0.89 for spherical crystals and
far-field IR spectra [16,17].                                                    B(2θ) is the full width at half maximum of the peak. The wide-
                                                                                 angle XRD pattern (Figure 2a) is identical to that reported
Hyperspectral imaging of the absorbance was measured on the                      earlier [18]. The most pronounced peak corresponds to the sepa-
IR Microspectroscopy (IRM) Beamline at Australian Synchro-                       ration between the equatorial (200) planes d(200) = 4.69 nm and
tron (Victoria, Australia). The measurements were performed                      crystal cross section of L ≈ 2.15 nm, while for the meridional
using a Bruker Hyperion 2000 FTIR microscope (Bruker Optik                       (002) planes d(002) = 3.46 nm and crystal size of L ≈ 10.76 nm
GmbH, Ettlingen, Germany) coupled to a Vertex V80v                               [18]. These are the dimensions of the β-sheets, which are crys-
FT-IR spectrometer equipped with a liquid nitrogen-cooled                        talline segments in the silk fiber. SNOM measurements are well
narrow-band mercury cadmium telluride (MCT) detector. Holo-                      suited to measure n and κ from areas of comparable dimensions.
graphic ZnSe wire-grid polarisers (Edmund) were used to set
polarisation at the IR spectral range of λ = 750–4000 cm−1                       Silk is a strongly birefringent material, as revealed by cross-
(2.5–13.3 μm); the extinction of polarisers was Tmax/Tmin ≈ 150                  polarised optical imaging (Figure 3). The images were taken
and the transmittance was about 50%. The far-field                               following adjustments of the voltage of a liquid crystal (LC)
transmission measurements were carried out with a 36× magni-                     retarder, which was inserted with its slow-axis perpendicular to
fication Cassegrain objective lens (NA = 0.5) at the correspond-                 the orientation of the silk fiber (see inset in Figure 3b). Using
ing resolution of 0.61λ/NA ≈ 4.1 μm at the 3000 cm −1                            such a geometry, it is possible to compensate for the birefrin-
band (λ = 3.33 μm). The absorbance or optical density                            gence of the silk fibers, Δn ≡ ne − no > 0, with a phase delay
A = −log(T) spectrum is defined by the absorption coefficient                    imparted by the LC retarder. When the phase delay through the
α ≡ 4πκ/λ = 2ωκ/c [cm−1] for the transmitted light intensity                     LC retarder is equal to the absolute value, but has an opposite
IT = I0e−αd = I0 × 10−OD; where d is the thickness of sample, the                sign through the silk fiber, the darkest (black) region is formed
transmittance T = I T /I 0 , OD is the optical density, ω is the                 in the image at ca. 2.9 V (Figure 3a). For the thickness of fiber
cyclic frequency of light, and c is the speed of light. The                      d = 48 μm and measured retardance, the birefringence
reflectance for the normal incidence from air is defined as                      Δn ≈ 4 × 10⁻³. This is an estimate of the order of magnitude
R = [(n− 1) 2 + κ 2 ]/[(n + 1) 2 + κ 2 ].                                        since the calibration of the LC retarder is carried out at a single
                                                                                 wavelength, while the imaging is done under white-light illumi-
Results and Discussion                                                           nation. The birefringence originates from the alignment of the
X-ray diffraction is the method of choice to reveal the internal                 structures, which is determined by the fiber orientation down to
structure of complex materials and to detect crystalline regions.                molecular bonds and spans hierarchically over a wide range of
Figure 1 and Figure 2a show 3D reconstructions of the Bombyx                     wavelengths due to secondary ordering [19]. Previously, longi-
mori silk fibers bundled together and their X-ray diffraction                    tudinal ca. 1 μm thick silk slices were measured in transmission
(XRD) pattern, respectively. The period d corresponds to the                     mode using synchrotron IR radiation to characterise the molecu-
most pronounced peaks at the diffraction angle 2θ, given by                      lar alignment of the typical amide bands [20], including amide

 Figure 3: (a) A series of optical images taken at different voltages of a liquid crystal (LC) retarder (schematically shown in the inset of (b)) and a Nikon
 Optiphot-pol microscope with LMPlanFL 20× objective lens, NA = 0.4. (b) Calibration curve of retardance as a function of voltage collected at 635 nm
 wavelength and 22.8 °C.

                                                                                                                                                          925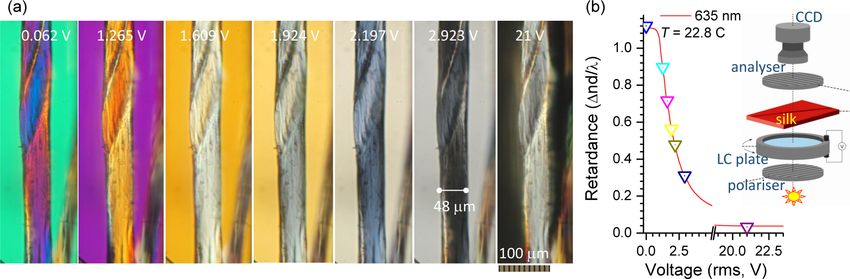
Beilstein J. Nanotechnol. 2019, 10, 922–929.

II at 1512 cm−1 (C–N), amide I (β-sheets) at 1628 cm−1 (C=O),                   Scattering SNOM was used to measure reflectance and absor-
and amide A at 3290 cm−1 (N–H). A perpendicular orientation                     bance spectra from nanoscale areas of a single silk slice. Lateral
between C=O and C-N bonding was revealed at a high accu-                        slices of 0.1 μm were prepared on a gold mirror (Figure 4a).
racy when longitudinal silk slices were prepared [20]. Longitu-                 Optical and topographic images were obtained that confirmed
dinal slices facilitated more precise measurements of the molec-                the thickness of the silk slices to be ca. 100 nm (Figure 4b).
ular alignment since there were no averaging artifacts due to the               Spectra of nano-FTIR reflectance and absorption from selected
curvature of silk fiber and different thickness across the fiber                points were also measured (Figure 5) with a high repro-
slice [21].                                                                     ducibility, showing a clear distinction between the silk

 Figure 4: (a) Far-field optical image of longitudinal slices of white silk embedded in an epoxy sheet. The inset shows schematics of a lateral silk slice
 composed of β-sheets interconnected with α-coils and amorphous segments. (b) Optical and topographic images of the silk slice shown in (a)
 measured with scattering near-field microscopy (SNOM; neaspec). Markers in optical image indicate locations where spectra were acquired.

 Figure 5: Scattering near-field optical microscopy (SNOM) measurements of the nano-FTIR reflectance (a) and absorption (b) spectra from selected
 points on silk and epoxy (shown in the right inset).

                                                                                                                                                         926
Beilstein J. Nanotechnol. 2019, 10, 922–929.

and the epoxy host matrix. The nano-FTIR absorption is propor-
tional to the imaginary part of the scattering coefficient
                    , which relates the scattered field of the light
E s (ω), and the incident field E i (ω) through the equation
Es = σnEi; where s(ω) and          are the amplitude and phase of
the back-scattered spectra [12]. The reflectivity information is
given by the real part of the scattering coefficient [12]. Using an
asymmetric Michelson interferometer, the full complex func-
tion of the scattered optical signal could be recorded, therefore
enabling the simultaneous measurement of both nano-FTIR
absorption and reflectivity spectra, shown in Figure 5.

The amide-I and amide-II bands were well reproduced in the
absorption spectra collected from four different single points.
However, only spectra from two measurement points are
displayed in Figure 5 for a better clarity of presentation. Nano-
scale resolution is readily achievable for SNOM measurements
and is defined by the AFM tip, which has a diameter of
ca. 10 nm. Around the center of the absorption peak, regions of
normal dispersion with a higher refractive index at a higher
photon energy (proportional to the wavenumber) was observed.
Spectral positioning of the absorption peak and dispersion line
shapes corresponded to the expected Lorentzian behavior of a
damped oscillator.

Next, direct absorbance and orientation mapping [22] through a
100 nm thick silk slice was demonstrated using synchrotron IR
radiation (Figure 6). By measuring the absorbance at several
azimuth angles, θ, it was possible to determine the molecular
alignment within the fibril structure. Here, we demonstrate the
use of the technique on the thinnest silk section of 100 nm. The
well-aligned amide bands were measured in transmission mode
at wavelengths that are much longer than the thickness of the
silk slice (d = 100 nm). A wavenumber of 1500 cm−1 corre-
sponds to a wavelength of 6.67 μm. The pitch between mea-
surement points was 2 μm and was approximately two-times
smaller than the focal spot (4.1 μm). This caused an uncertainty
in orientation azimuth at the boundary of the silk fiber and the
surrounding epoxy matrix. However, the central part of the fiber
shows a well-defined orientation, while the epoxy region has a
random orientation. The absorbance from silk, which makes
only d/λ ≈ 1.5% of the probing wavelength, was reliably
measured in transmission. The retardance of silk, d = 100 nm,
has a birefringence of Δn = 4 × 10 −3 at the non-absorbing
vis–IR wavelengths. For example, the band at 3600 cm −1
(λ = 2.78 μm) resulted in ΔT = sin 2 (πΔnd/λ) = 2 × 10 −5 %,
which was beyond the precision of measurements. Alternative-           Figure 6: (a) Single-point absorbance spectra of thin silk samples on
ly, the real part of the refractive index can be determined from       BaF2 collected at different angles θ between the linear polarisation and
                                                                       the fiber axis, using 2 μm pixel pitch, 15 × 15 pixel points, 4.17 μm
the known values of reflectance R and extinction κ following           spatial resolution, and 4 cm−1 spectral resolution. (b) Orientation color
the equation n = [(1 + R)/(1 − R)] + [4R/(1 − R)2 − κ2]1/2. How-       maps indicating that amide A (N–H) is oriented perpendicular to amide
                                                                       I (C=O) and amide II (C-N).
ever, R was not measured in this experiment.

                                                                                                                                             927
Beilstein J. Nanotechnol. 2019, 10, 922–929.
Anisotropy in absorption is defined by the dichroism via ARC Discovery DP170100131 grant. Experiments were
carried out through a beamtime proposal (ID. 12107) at the
Australian Synchrotron IRM Beamline, part of ANSTO. We are
grateful for R. Kikuchi from Materials Analysis Division of
where k = 2π/λ is the wave vector. It defines the losses in trans- Tokyo Institute of Technology, Ookayama, for his assistance
mission T, at the maximum and minimum orientations of linear with ultramicrotomy. X-ray characterisation was performed at
polarisation . The dichroism was estimated the Stanford Nano Shared Facilities (SNSF), supported by the
for the amide bands. For the amide-A band, Δ” ≈ 0.014 sug- National Science Foundation under award ECCS-1542152. SJ is
gests only a minute transmission change for grateful for sabbatical stays at Tokyo Institute of Technology
the two perpendicular polarisations. Similarly, the results ob- and Shizuoka University. A part of this work was carried out
tained for the amide-I band (Δ” ≈ 0.027 and 97.4%) and the under the Cooperative Research Project Program of the
amide-II band (Δ” ≈ 0.019 and 98.1%) also indicated that very Research Institute of Electronics, Shizuoka University.
small changes of absorbance of light passed through the thin
100 nm lateral slices of the silk fiber occurred. This shows that ORCID® iDs
an anisotropy of absorbance can be measured from nanoscale Saulius Juodkazis - https://orcid.org/0000-0003-3542-3874
materials of sub-wavelength thickness. There were no apparent
spectral differences among the measurements at different orien- References
tations of 100 nm thick silk slices. The far-field (Figure 6) and 1. Rangelow, I. W.; Ahmad, A.; Ivanov, T.; Kaestner, M.;
near-field (Figure 5) absorbance spectra are comparable and are Krivoshapkina, Y.; Angelov, T.; Lenk, S.; Lenk, C.; Ishchuk, V.;
Hofmann, M.; Nechepurenko, D.; Atanasov, I.; Volland, B.; Guliyev, E.;
matching earlier results measured from thicker samples [10].
Durrani, Z.; Jones, M.; Wang, C.; Liu, D.; Reum, A.; Holz, M.;
This study shows that the SNOM measurements reach the reso-
Nikolov, N.; Majstrzyk, W.; Gotszalk, T.; Staaks, D.; Dallorto, S.;
lution required to measure the structural composition of silk Olynick, D. L. J.
fibres corresponding to the crystalline segments observed in J. Vac. Sci. Technol., B: Nanotechnol. Microelectron.: Mater., Process.,
XRD and the measurements can be carried out with nanometer- Meas., Phenom. 2016, 34, 06K202. doi:10.1116/1.4966556
thin slices of silk. 2. Paul, P. C.; Knoll, A. W.; Holzner, F.; Despont, M.; Duerig, U.
Nanotechnology 2011, 22, 275306.
doi:10.1088/0957-4484/22/27/275306
Conclusion 3. Holzner, F.; Paul, P.; Drechsler, U.; Despont, M.; Knoll, A. W.;
Spectral characterisation, lateral mapping and transmission with Duerig, U. Appl. Phys. Lett. 2011, 99, 023110. doi:10.1063/1.3610490
deep sub-wavelength resolution in the spectral window of IR 4. Linklater, D. P.; Nguyen, H. K. D.; Bhadra, C. M.; Juodkazis, S.;
molecular fingerprints were demonstrated using 100 nm thin Ivanova, E. P. Nanotechnology 2017, 28, 245301.
doi:10.1088/1361-6528/aa700e
lateral slices of silk. Absorbance and reflectance spectra of silk
5. Ivanova, E. P.; Hasan, J.; Webb, H. K.; Gervinskas, G.; Juodkazis, S.;
with the resolution of the SNOM tip of ca. 10 nm were ob- Truong, V. K.; Wu, A. H. F.; Lamb, R. N.; Baulin, V. A.; Watson, G. S.;
tained. Absorbance from nanometer-thin silk slices with thick- Watson, J. A.; Mainwaring, D. E.; Crawford, R. J. Nat. Commun. 2013,
ness only 1.5% of the wavelength were measured when the 4, 2838. doi:10.1038/ncomms3838
beam diameter was comparable to the IR wavelength. Hyper- 6. Shao, Z.; Vollrath, F. Nature 2002, 418, 741. doi:10.1038/418741a
7. Jiang, J.; Zhang, S.; Qian, Z.; Qin, N.; Song, W.; Sun, L.; Zhou, Z.;
spectral mapping across the silk fiber slice was obtained with
Shi, Z.; Chen, L.; Li, X.; Mao, Y.; Kaplan, D. L.; Gilbert Corder, S. N.;
high accuracy and reproducibility. An orientational map of the
Chen, X.; Liu, M.; Omenetto, F. G.; Xia, X.; Tao, T. H.
amide bands was revealed and was consistent with data Adv. Mater. (Weinheim, Ger.) 2018, 30, 1705919.
collected from bulk samples. It shows that preparation of thin doi:10.1002/adma.201705919
microtome slices of soft biomaterials is not altering their struc- 8. Choi, S. H.; Kim, S.-W.; Ku, Z.; Visbal-Onufrak, M. A.; Kim, S.-R.;
ture and opens the possibility to read optical properties from Choi, K.-H.; Ko, H.; Choi, W.; Urbas, A. M.; Goo, T.-W.; Kim, Y. L.
Nat. Commun. 2018, 9, No. 452. doi:10.1038/s41467-017-02500-5
nanovolumes. In the case of optical measurements, optical aver-
9. Dazzi, A.; Prazeres, R.; Glotin, F.; Ortega, J. M. Opt. Lett. 2005, 30,
aging over thicker inhomogeneous volumes of samples can be 2388–2390. doi:10.1364/ol.30.002388
avoided using nanoslices and this provides more reliable direct 10. Ryu, M.; Kobayashi, H.; Balčytis, A.; Wang, X.; Vongsvivut, J.; Li, J.;
measurement of optical properties. The study demonstrated the Urayama, N.; Mizeikis, V.; Tobin, M.; Juodkazis, S.; Morikawa, J.
characterisation of silk fibers with nanoscale resolution in all Mater. Res. Express 2017, 4, 115028. doi:10.1088/2053-1591/aa98a9
11. Bertie, J. E.; Michaelian, K. H. J. Chem. Phys. 1998, 109, 6764–6771.
three dimensions.
doi:10.1063/1.477322
12. Huth, F.; Schnell, M.; Wittborn, J.; Ocelic, N.; Hillenbrand, R.
Acknowledgements Nat. Mater. 2011, 10, 352–356. doi:10.1038/nmat3006
JM acknowledges a partial support by a JSPS KAKENHI Grant 13. Ling, S.; Qin, Z.; Li, C.; Huang, W.; Kaplan, D. L.; Buehler, M. J.
No.16K06768 and 18H04506. We acknowledge partial support Nat. Commun. 2017, 8, 1387. doi:10.1038/s41467-017-00613-5
928Beilstein J. Nanotechnol. 2019, 10, 922–929.
14. Li, C.; Hotz, B.; Ling, S.; Guo, J.; Haas, D. S.; Marelli, B.; Omenetto, F.;
Lin, S. J.; Kaplan, D. L. Biomaterials 2016, 110, 24–33.
doi:10.1016/j.biomaterials.2016.09.014
15. Richards, D.; Zayats, A.; Keilmann, F.; Hillenbrand, R.
Philos. Trans. R. Soc., A 2004, 362, 787–805.
doi:10.1098/rsta.2003.1347
16. Huth, F.; Govyadinov, A.; Amarie, S.; Nuansing, W.; Keilmann, F.;
Hillenbrand, R. Nano Lett. 2012, 12, 3973–3978.
doi:10.1021/nl301159v
17. Westermeier, C.; Cernescu, A.; Amarie, S.; Liewald, C.; Keilmann, F.;
Nickel, B. Nat. Commun. 2014, 5, 4101. doi:10.1038/ncomms5101
18. Drummy, L. F.; Farmer, B. L.; Naik, R. R. Soft Matter 2007, 3, 877–882.
doi:10.1039/b701220a
19. Balčytis, A.; Ryu, M.; Wang, X.; Novelli, F.; Seniutinas, G.; Du, S.;
Wang, X.; Li, J.; Davis, J.; Appadoo, D.; Morikawa, J.; Juodkazis, S.
Materials 2017, 10, 356. doi:10.3390/ma10040356
20. Ryu, M.; Balčytis, A.; Wang, X.; Vongsvivut, J.; Hikima, Y.; Li, J.;
Tobin, M. J.; Juodkazis, S.; Morikawa, J. Sci. Rep. 2017, 7, 7419.
doi:10.1038/s41598-017-07502-3
21. Honda, R.; Ryu, M.; Li, J.-L.; Mizeikis, V.; Juodkazis, S.; Morikawa, J.
Sci. Rep. 2018, 8, 17652. doi:10.1038/s41598-018-36114-8
22. Hikima, Y.; Morikawa, J.; Hashimoto, T. Macromolecules 2011, 44,
3950–3957. doi:10.1021/ma2003129
License and Terms
This is an Open Access article under the terms of the
Creative Commons Attribution License
(http://creativecommons.org/licenses/by/4.0). Please note
that the reuse, redistribution and reproduction in particular
requires that the authors and source are credited.
The license is subject to the Beilstein Journal of
Nanotechnology terms and conditions:
(https://www.beilstein-journals.org/bjnano)
The definitive version of this article is the electronic one
which can be found at:
doi:10.3762/bjnano.10.93
929You can also read